Denpex: GPU, CUDA & PyTorch ML Crash DiagnosticsDiagnose GPU errors, CUDA OOM, PyTorch crashes, NCCL hangs, Xid, Slurm and vLLM failures in VS Code. Free offline analysis. No sign-up. Installation Launch VS Code Quick Open ( Ctrl+P), paste the following command, and press enter.Copied to clipboard |

Denpex: GPU, CUDA & PyTorch Crash Diagnostics for VS Code
Select a GPU error log. See the supporting evidence, likely cause, and what to check next, without leaving VS Code. Investigate CUDA out-of-memory errors, NCCL timeouts, PyTorch crashes, NVIDIA Xid faults, Slurm jobs, Kubernetes GPU failures, and vLLM inference errors. Local diagnosis is free, unlimited, and offline. No account, API key, or separate Node.js installation required. Quick InstallOr search Denpex in the VS Code Extensions tab ( Try a diagnosis
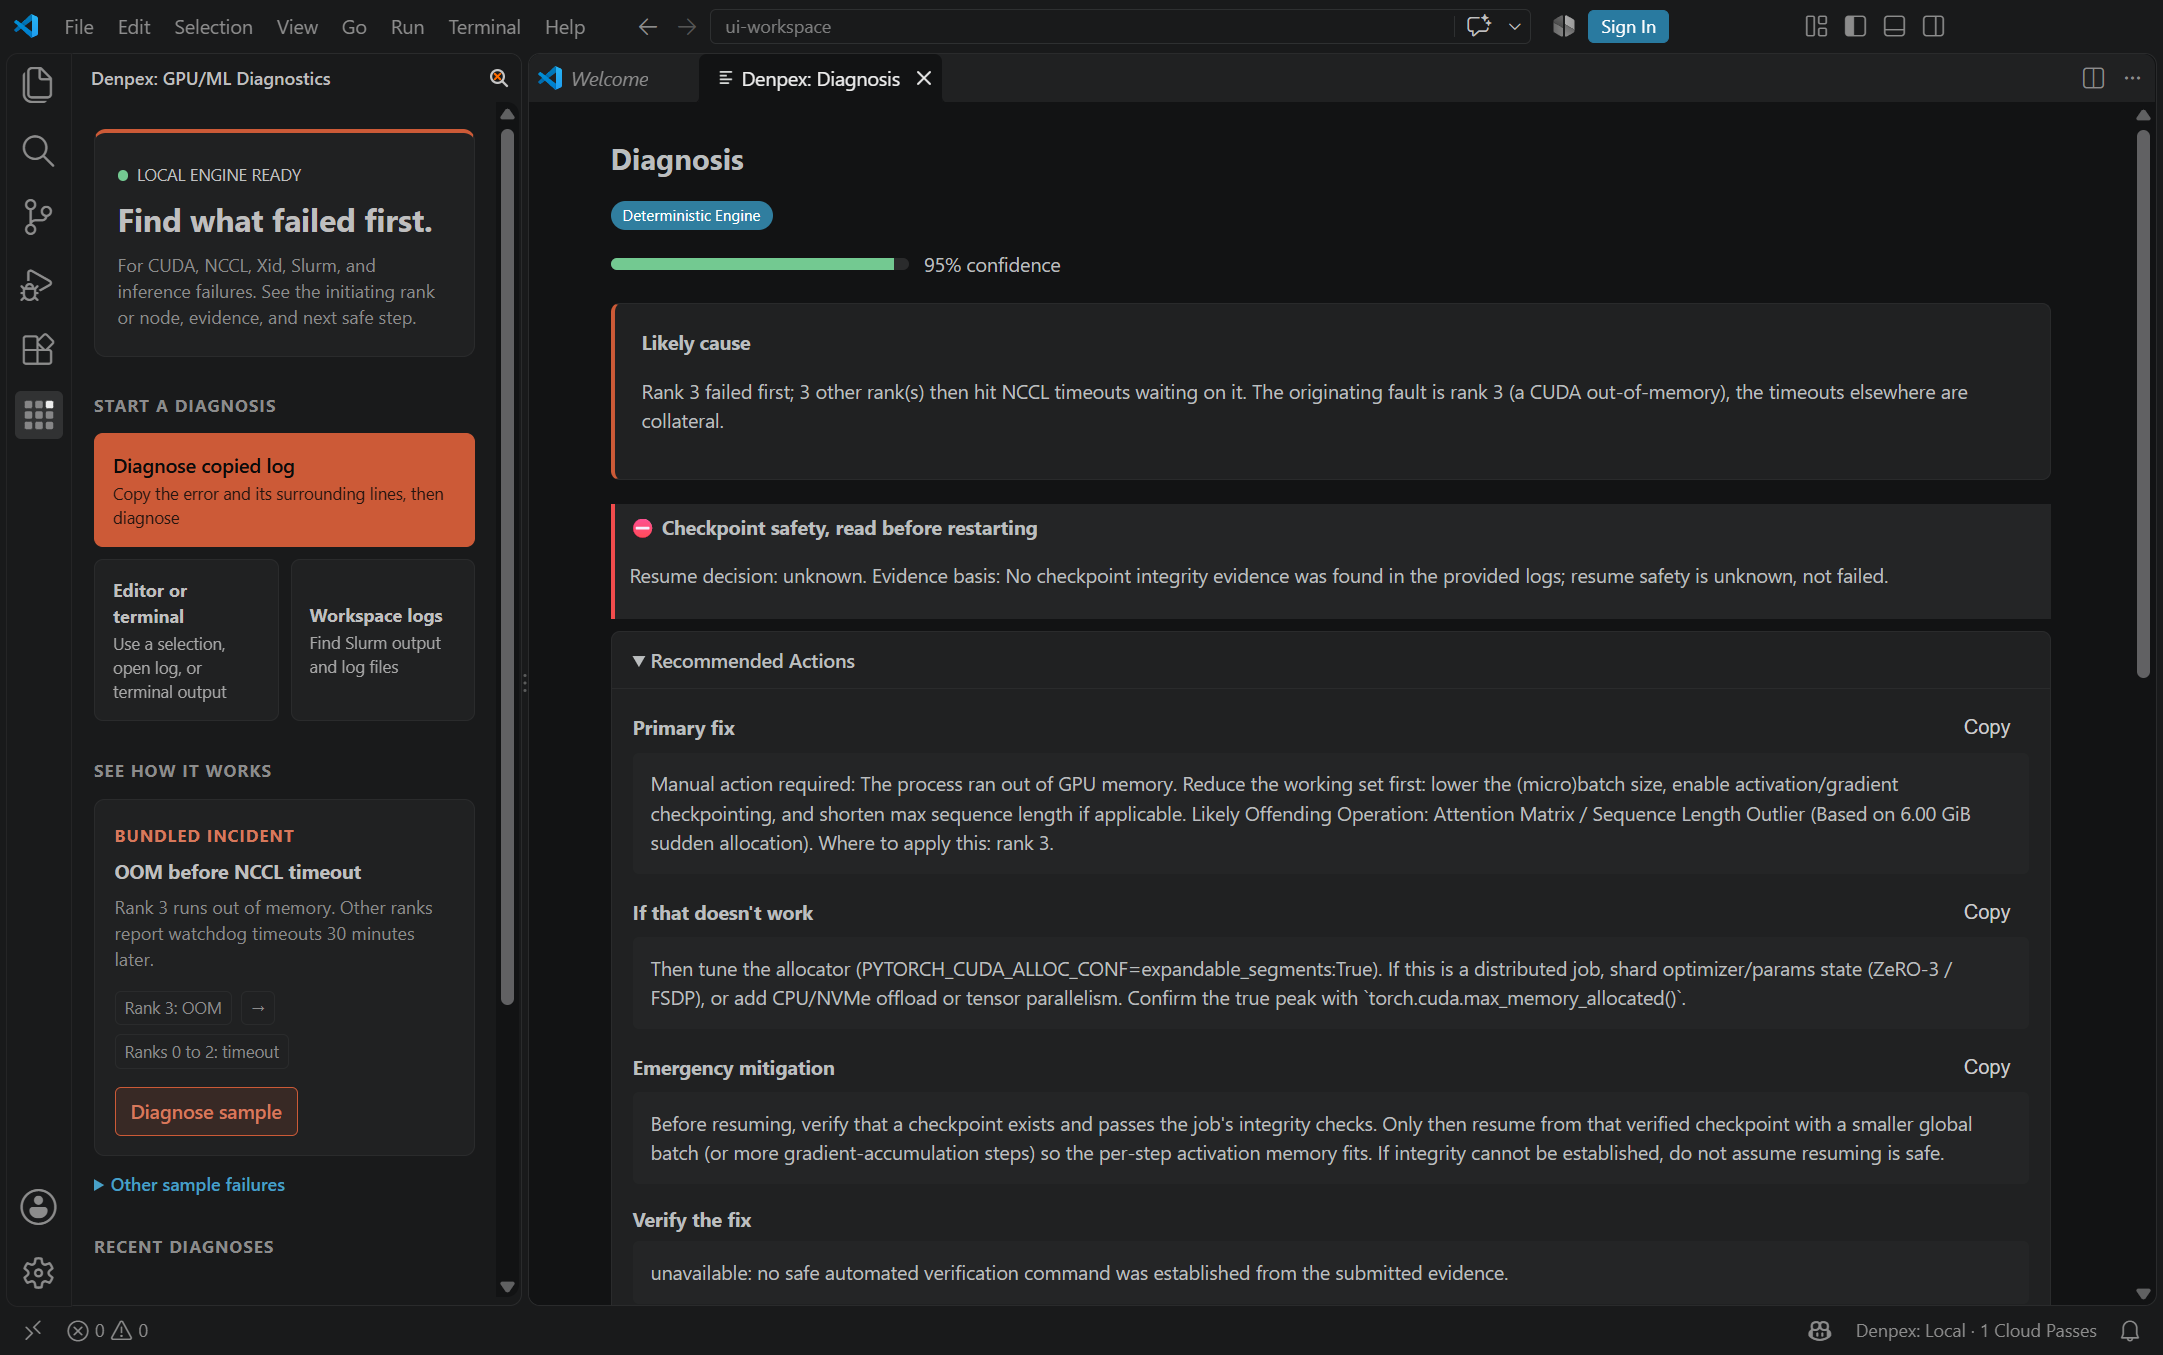
No log handy? Open the Denpex sidebar and run a bundled sample: an OOM followed by NCCL timeouts, GPU device loss, a network-interface mismatch, a Kubernetes device-plugin fault, or vLLM KV-cache exhaustion. The report separates an initiating failure from downstream symptoms when the log supports that distinction. If it cannot establish the cause, it asks for more evidence instead of treating a timeout as an explanation. What a diagnosis showsThe report leads with the likely cause, checkpoint safety when relevant, and recommended actions. Expand the evidence and causal chain to see how Denpex reached its conclusion. If the logs do not establish a cause, the report identifies what evidence is missing. Find the first failure and act on it. This bundled incident has a CUDA OOM on rank 3 followed by NCCL timeouts on other ranks. The extension identifies the initiating fault, flags unknown checkpoint safety, and shows the first fix in the same editor view.
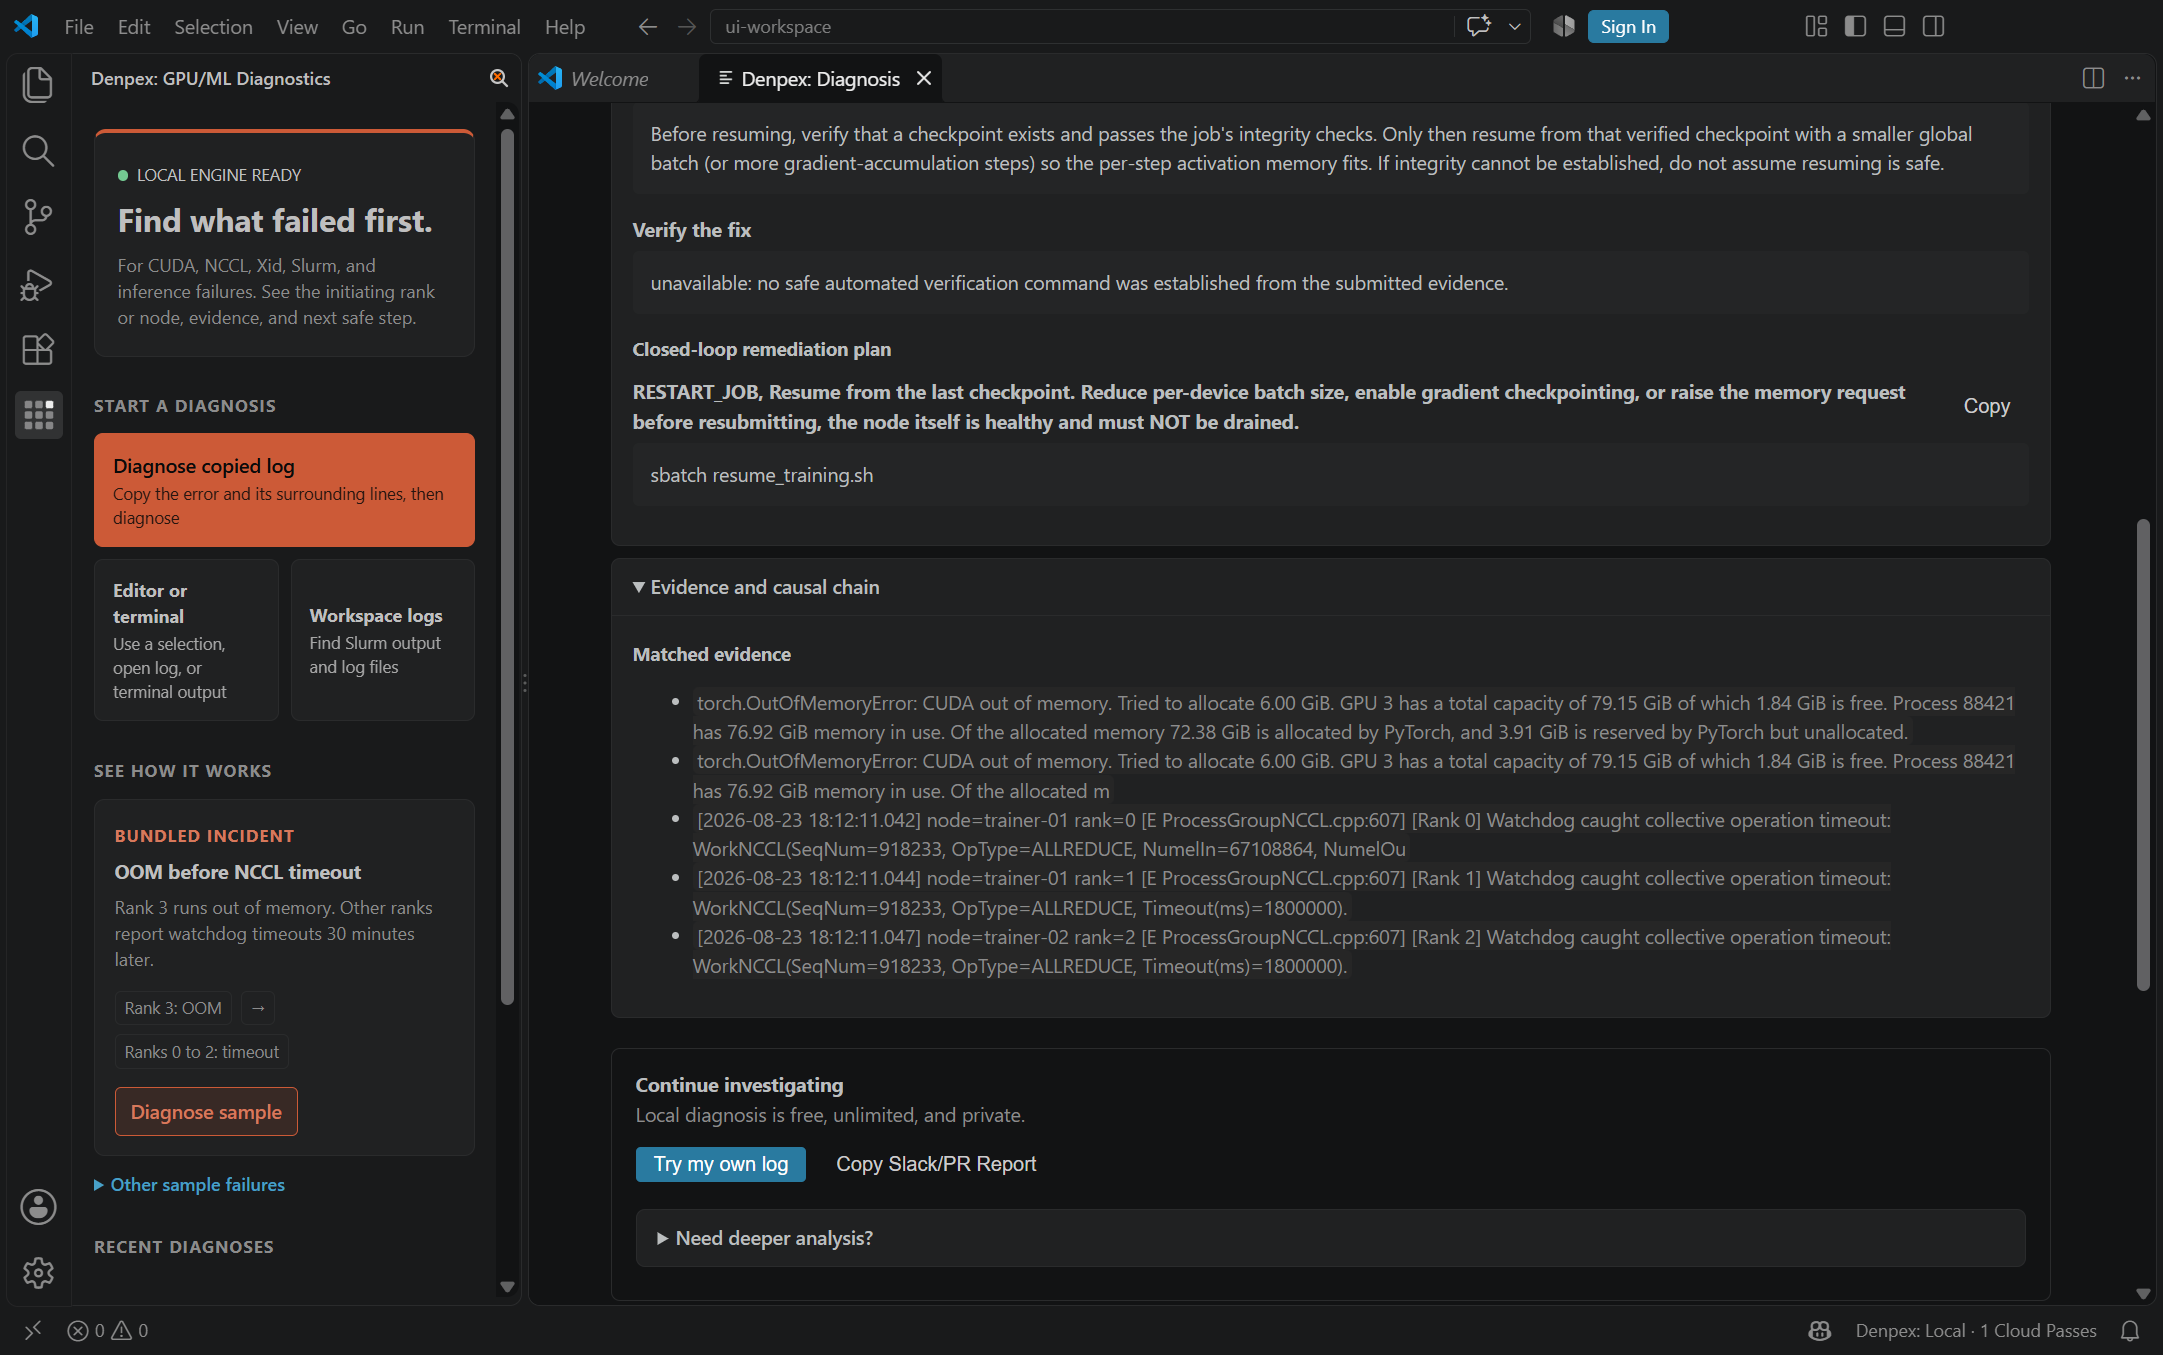
Check the source lines. Open the evidence section to inspect the OOM and downstream timeout lines that support the diagnosis.
Both screenshots were captured from the installed extension using its bundled synthetic sample. Your VS Code theme and window size may vary. Use it where you work
Console, Fleet and TopologyOpen Denpex: Open Console to paste a log, run a local diagnosis and ask about its recorded cause, evidence, fix or checkpoint safety. These local follow-ups do not invoke an LLM. Arbitrary questions require a separate cloud review. Choose Fleet or Topology in the console, or run Denpex: Open Fleet and Denpex: Open Topology. These editor panels use the website's shared components and read your connected account's reports and telemetry. A plan with the corresponding access is required. With no telemetry, the map shows setup instructions, not demo nodes. Stale telemetry is not presented as healthy. Account reports are read-only in the editor. Billing, API-key management, integrations and operational changes remain website actions. Opening a fleet view does not upload your local log or start LLM reasoning. Credentials stay in the extension host, not in the webview. Local diagnosis runs on the extension host, including Remote-SSH hosts and containers. The bundled engine also works without internet access. Interactive Terminal LinksRecognized GPU and ML error lines become clickable in the integrated terminal. Open a diagnosis from the error, then check its supporting evidence before making changes. Errors you can investigate
The engine recognizes patterns across PyTorch, NCCL, DeepSpeed, Slurm, Kubernetes, vLLM, TensorRT-LLM and related GPU tooling. Recognition does not certify every software/hardware combination or prove the cause from a single error line. Optional cloud reviewStart locally. If you need another pass, choose Try one free cloud review in the report. You get one immediate cloud deep analysis without an account. Later anonymous requests may require a browser check on denpex.com. Cloud review sends the selected log to Denpex. It is optional; local diagnosis stays unlimited. For regular cloud use:
Company-domain verification applies. If automatic verification fails, contact support@denpex.com for review. You can keep using the local engine while waiting. Connecting an account does not upload a log or start a diagnosis. Credentials are stored in VS Code SecretStorage. See the extension guide for setup details. PrivacyLocal diagnosis, predictive terminal monitoring, sample failures, and RMA payload generation run entirely on the extension host. Clipboard text is read only after you choose it from the source picker. Recent-diagnosis persistence stores only a timestamp, failure type, and engine source - not logs, evidence excerpts, or the report body. After your first completed diagnosis, Denpex asks whether you want to share optional anonymous product-step counts. It is off until you select Allow anonymous counts. If enabled, Denpex sends only the extension version and a completed-step label (sample diagnosis, own-log diagnosis, cloud review, Team trial request, or account connection). It sends no log, result, email address, file path, machine detail, or install identifier. Choose Denpex: Manage Anonymous Step Counts at any time to turn it off or on. An on-prem or custom API setup does not send these counts to Denpex. In Read the full Denpex privacy policy. Settings
Support |