Architectural and runtime observability for DSoftStudio.Mediator — directly inside VS Code.
See every request handler, behavior, pre/post-processor, notification dispatch, and stream — wired into the source it came from, with live profiling stats and one-click navigation.
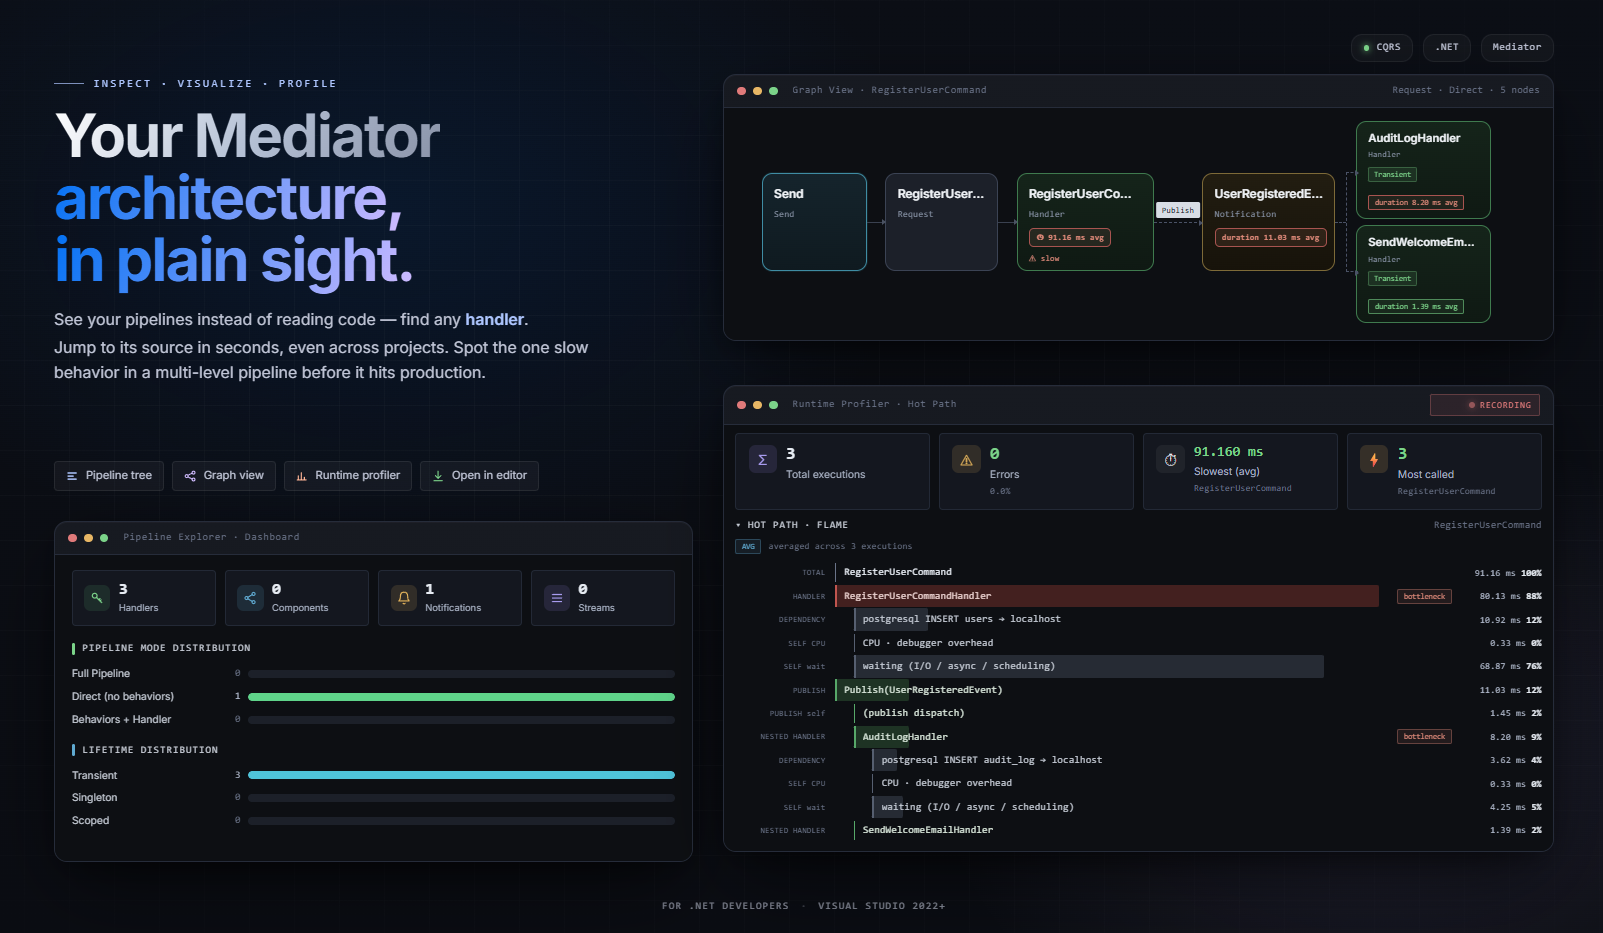
Screenshot: tree, detail panel, and interactive graph of a real CQRS solution.
Free trial — full access to every commercial feature while you evaluate it against your own codebase.
Start your trial →
Why Pipeline Explorer?
Mediator-heavy applications grow fast and become hard to reason about:
- Hidden behaviors silently wrap every dispatch — validation, logging, retry, transactions — and nobody remembers the chain.
- Nested mediator calls inside handlers turn a single endpoint into a dozen invocations the IDE won't show you.
- Notification fan-out scatters business effects across projects; tracing them needs grep and luck.
- Performance bottlenecks hide behind generic pipeline traces — which behavior is the slow one, on which request?
- Cross-project handlers live in
*.Application, dispatched from *.Api, decorated in *.Infrastructure — no single source file tells the story.
Pipeline Explorer gives you a real-time architectural and runtime view of the mediator graph as it exists in your codebase, with the source under one click and live timing data under another.
Example workflow
- Open the controller that dispatches
CheckLicenseCommand.
- Jump to the command type from the tree — instant.
- Inspect the behavior chain: validation → caching → authorization → handler. Open any of them.
- Visualize the request graph: see the notification fan-out and the nested
RegisterGrantCommand that fires inside the handler.
- Start runtime profiling. Issue requests against your local API.
- Spot a tail-heavy validation behavior at p99 — 380 ms while the median is 4 ms.
- Click the behavior in the profiler panel — jumps to source. Fix it. Re-run.
That loop — understand → navigate → measure → fix — without ever leaving the editor.
Capabilities
Pipeline tree explorer
Every request pipeline grouped by kind — Commands, Queries, Notifications, Streams — with at-a-glance badges (Command · PassThrough, Query · Full, notification fan-out count, stream kind). Filter by section, search across types, behaviors, and call sites.
Click-to-source navigation
Every node knows where it lives. Click a handler — opens the file at the right line. Click a behavior — same. Click a call site — opens the controller / endpoint that dispatched the request. No manual Ctrl+T hunt.
Interactive pipeline graph
Per-pipeline visualization of pre-processors → behaviors → handler → post-processors — with the exception-handler branch, notification fan-out, and nested mediator calls drawn inline. Every node carries its live average duration and a heat badge (fast / slow), so the bottleneck is obvious at a glance. Pan, zoom, click any node to navigate or inspect.
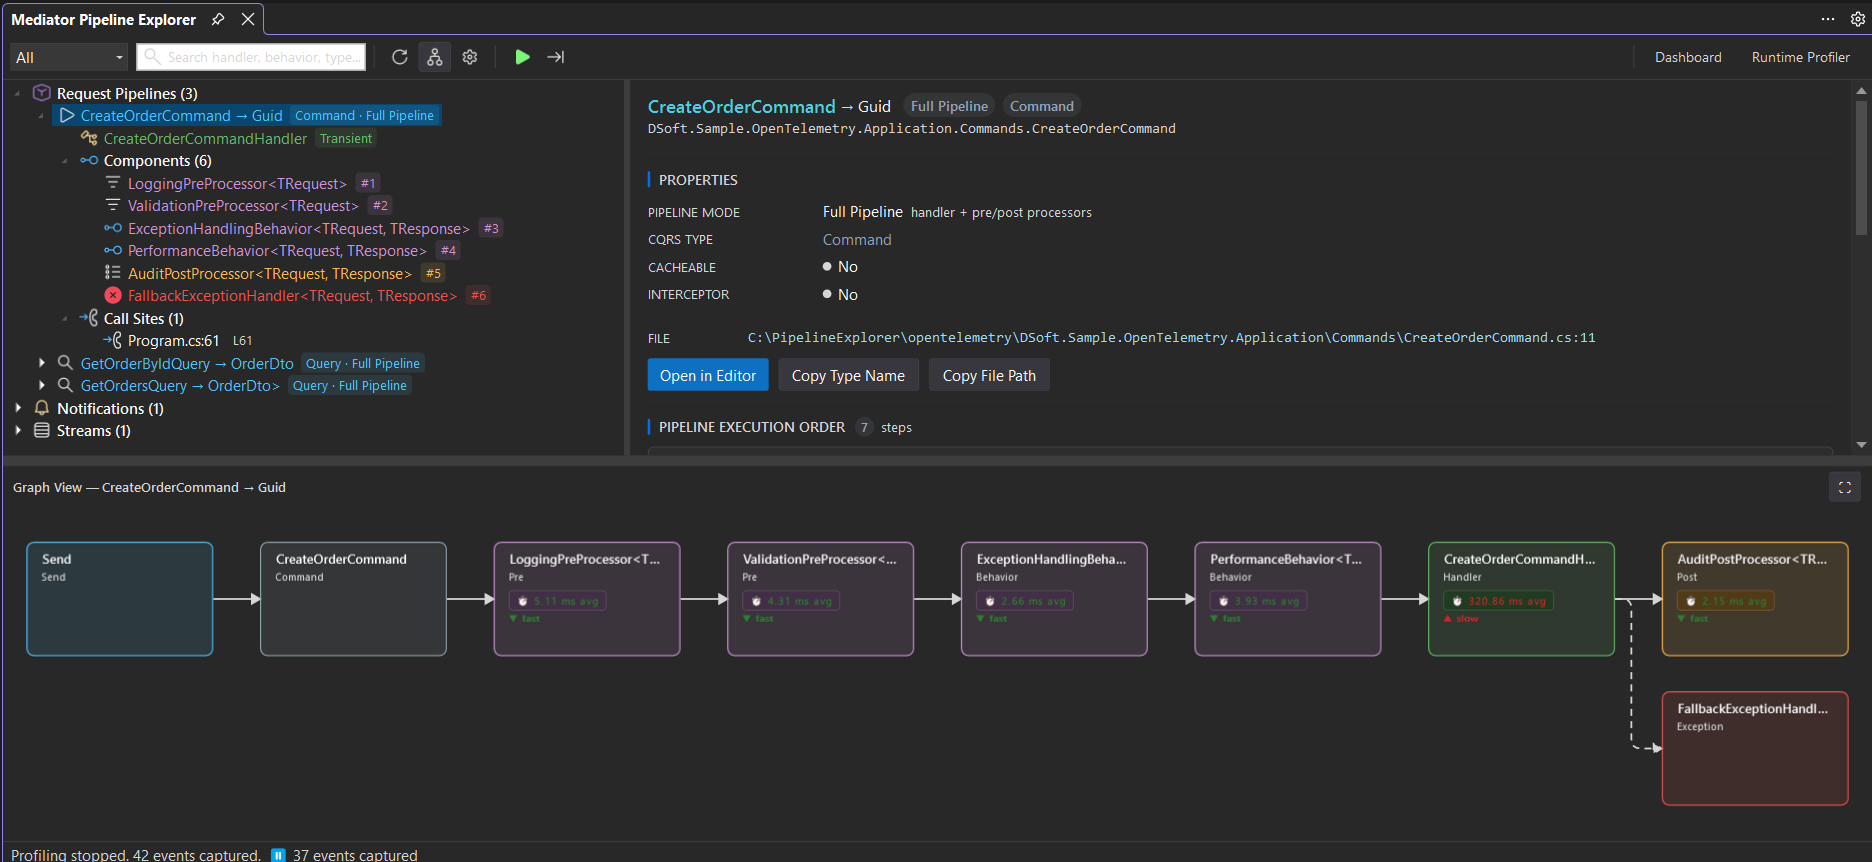
The full pipeline for a command — pre-processors, behaviors, handler, post-processors, and the exception branch — with per-node average timings and heat coloring, plus the tree and detail panel above.
Runtime profiler
Live handler and behavior timings — p50 / p95 / p99 percentiles, error rates, tail-heavy detection. The Hot Path view breaks one request into its exact execution order and attributes every millisecond: each pre-processor, behavior, and the handler, plus the external dependencies underneath it — EF Core compile/connect, the individual SQL statements (INSERT orders, SELECT inventory), HTTP calls — and the self-wait (time lost to I/O / async scheduling rather than CPU). A bottleneck badge flags the row that dominates. Snapshot, clear, export. The profiling hooks wire themselves into your application at compile time the moment the analyzer is loaded, so there is nothing to add to Program.cs.
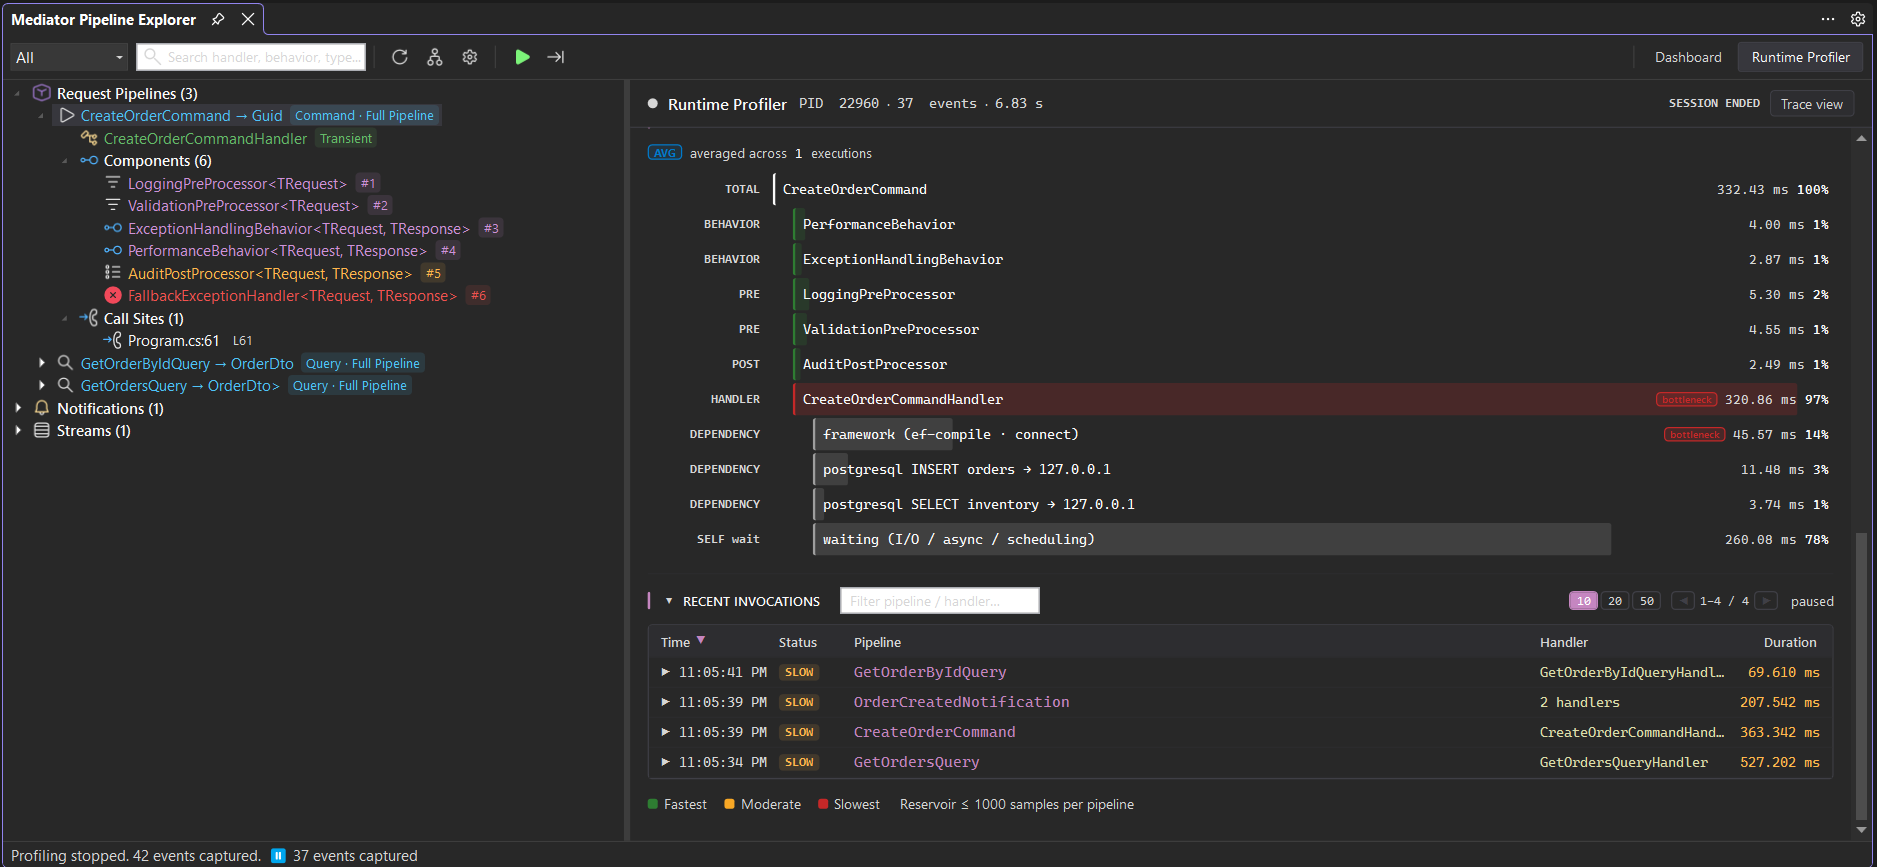
Hot Path: per-component timings, external dependency attribution (EF Core / PostgreSQL), and self-wait — with the dominant row flagged automatically.
Zoom out to the statistics dashboard for the whole session: per-pipeline Calls / Errors / Avg / P50 / P95 / P99 / Max, notification fan-out with per-handler overhead, and live request telemetry (fastest / slowest / tail factor / worst-P99 pipeline).
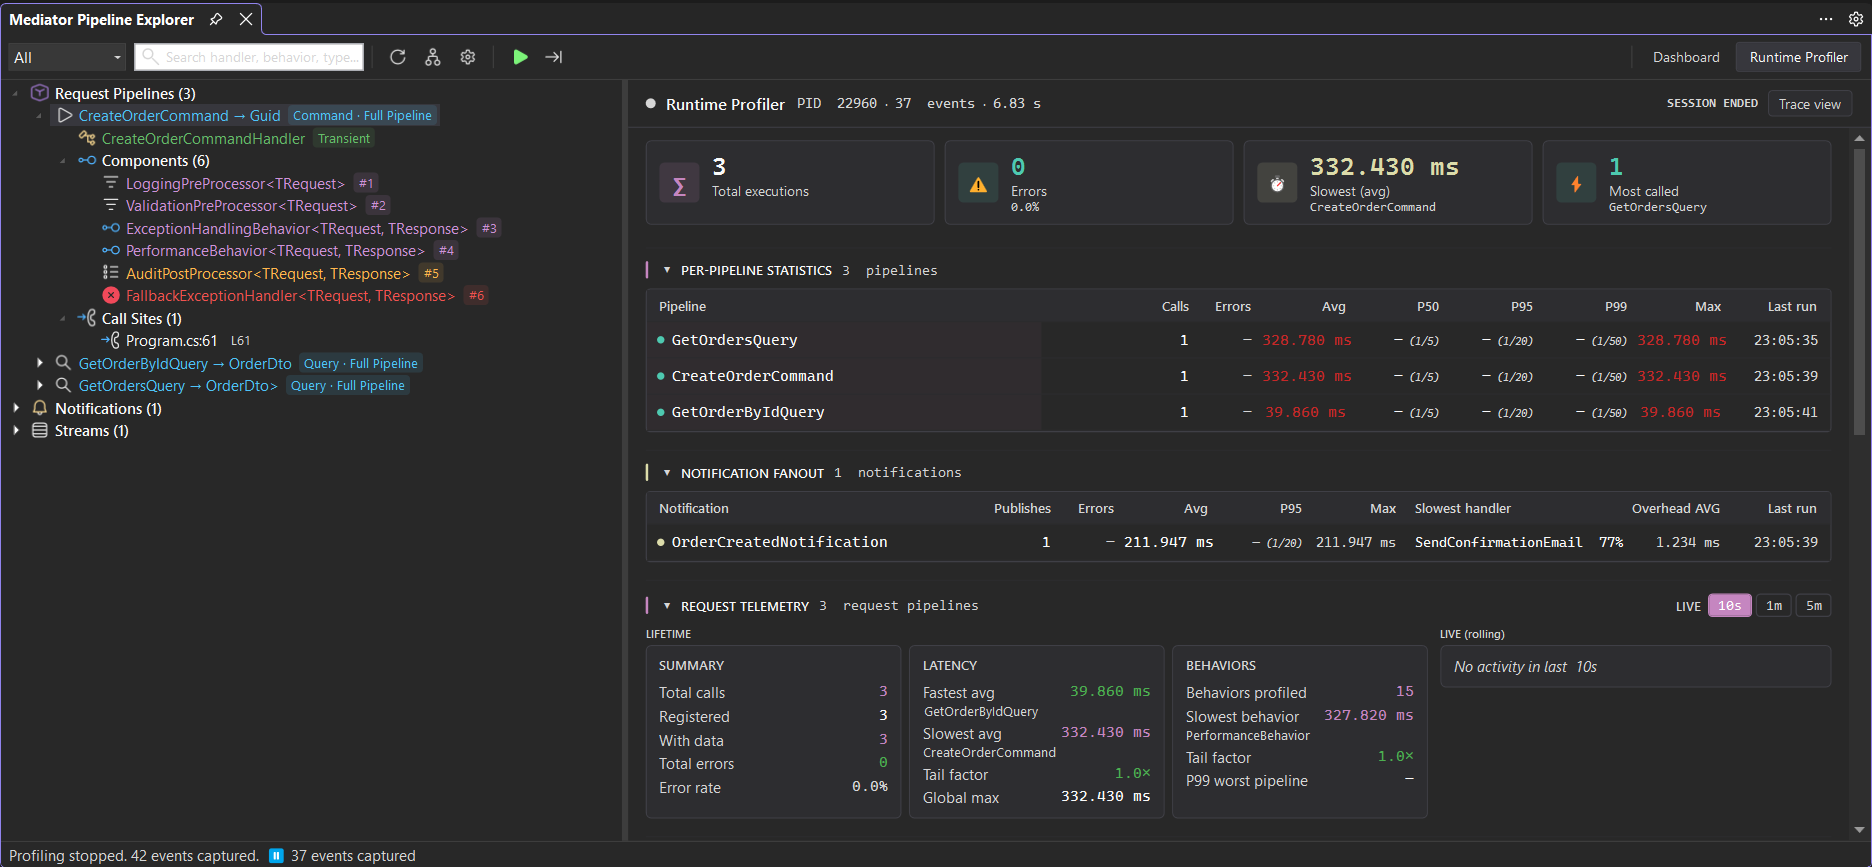
Per-pipeline percentiles, notification fan-out overhead, and live telemetry across the profiling session.
This is where the largest day-to-day ROI lives — pinpointing the one slow behavior in a dozen-deep chain takes seconds, not an afternoon of OpenTelemetry digging.
CQRS-aware view
Pipelines tagged automatically by interface (ICommand<>, IQuery<>, IRequest<>) so the tree groups them the way your codebase actually thinks. Dedicated icons distinguish reads from writes at a glance.
Zero-config discovery
Open a workspace with a .sln and the extension scans your projects, finds every IRequestHandler / IStreamRequestHandler / INotificationHandler, and builds the tree. No registration, no attributes, no MSBuild hooks beyond the analyzer NuGet you already reference.
Requirements
- VS Code 1.85+
- .NET 8 or 10 in the target solution
- DSoftStudio.Mediator referenced by the project(s) you want to inspect
- A license or a free trial — the extension asks for one on first run
- The bundled server auto-spawns; no manual install needed. macOS, Linux, and Windows are supported.
Getting started
- Install the extension from the Marketplace.
- Open a workspace containing a
.sln that references DSoftStudio.Mediator. The Pipeline Explorer view appears in the Activity Bar.
- Click
Refresh if the tree is empty — discovery runs on solution-open and on demand.
- Activate your license — open
Mediator: License Status from the Command Palette and paste your activation token, or set mediator.licenseKey in settings.
- Enable runtime profiling (optional) — run
Mediator: Start Profiling from the Command Palette. The profiler is wired into your application automatically by the analyzer; no code change is required. Live stats flow into the Profiler panel.
Configuration
All settings live under mediator.* in your User or Workspace settings.
| Setting |
Default |
Purpose |
mediator.licenseKey |
empty |
Activation token from the pricing portal |
mediator.diagnosticsEnabled |
true |
Toggle Roslyn analyzers / source generators emitted by the package |
mediator.showPipelineMode |
true |
Show the PassThrough / Full / BehaviorsOnly badge in the tree |
mediator.showNestedOperations |
true |
Render nested mediator dispatches inside the parent graph |
mediator.maxBufferedEvents |
2000 |
Profiling event buffer cap (FIFO) |
mediator.tailHeavyMinP99Ms |
20 |
Floor for tail-heavy detection to avoid sub-ms noise |
mediator.serverPath |
empty |
Override the bundled server location (advanced) |
Open the full settings panel from the Activity Bar gear icon.
Commands
All commands live under the Mediator: category in the Command Palette (Ctrl+Shift+P):
| Command |
What it does |
Refresh Pipelines |
Re-scan the solution; resets cached profiling data |
Show Pipeline Graph |
Open the interactive graph view |
Show Dashboard |
Open the project-level overview |
Start / Stop Profiling |
Attach or detach the runtime profiler |
Profiling Snapshot |
Capture a point-in-time snapshot of the current session |
Clear Profiling Data |
Drop all in-memory profiling state |
Show Profiler |
Open the profiler panel |
Toggle Profiler View Mode |
Switch between aggregated and per-handler view |
License Status |
Open the activation panel |
Stop Server |
Shut down the bundled server process |
- Solution-rooted only. Standalone
.csproj workspaces are not yet auto-detected; open the containing folder with the .sln.
- Profiler attach is solution-scoped. The profiler attaches to apps launched from the IDE or already running outside it (e.g.
dotnet run in a terminal), but it only considers processes that belong to the open solution — it never lists or attaches to unrelated processes on the machine.
- Single solution per window. Multi-solution workspaces show only the first
.sln discovered.
- Light-weight type resolution. Generic constraint chains and conditional registrations may not always resolve to a concrete handler; the analyzer warns when ambiguous.
We track these — and accept bug reports — at the GitHub repository.
Licensing
Pipeline Explorer is commercial software. A free trial is available so you can validate the workflow against your real codebase before purchasing. After the trial window, a valid activation token is required to continue using the extension.
Copyright (c) 2026 DSoftStudio. All rights reserved.
PROPRIETARY AND CONFIDENTIAL
This source code is the exclusive property of DSoftStudio.
Unauthorized copying, reproduction, modification, distribution,
or use of this software, in whole or in part, via any medium,
is strictly prohibited without the express prior written
permission of DSoftStudio.
For licensing inquiries: licensing@dsoftstudio.com
DSoftStudio Mediator is a registered product of DSoftStudio. Visual Studio Code is a trademark of Microsoft Corporation.

