Skip to content
| Marketplace
Sign in
Visual Studio Code>Other>BKPT ViewAlyzer - Embedded TraceNew to Visual Studio Code? Get it now.
BKPT ViewAlyzer - Embedded Trace

BKPT ViewAlyzer - Embedded Trace

BKPT

|
5 installs
| (0) | Free
Free embedded trace capture and viewing in VS Code: record RTOS and baremetal traces from J-Link and ST-LINK probes and explore them in timeline, event, and graph panels.
Installation
Launch VS Code Quick Open (Ctrl+P), paste the following command, and press enter.
Copied to clipboard
More Info

BKPT ViewAlyzer - Embedded Trace

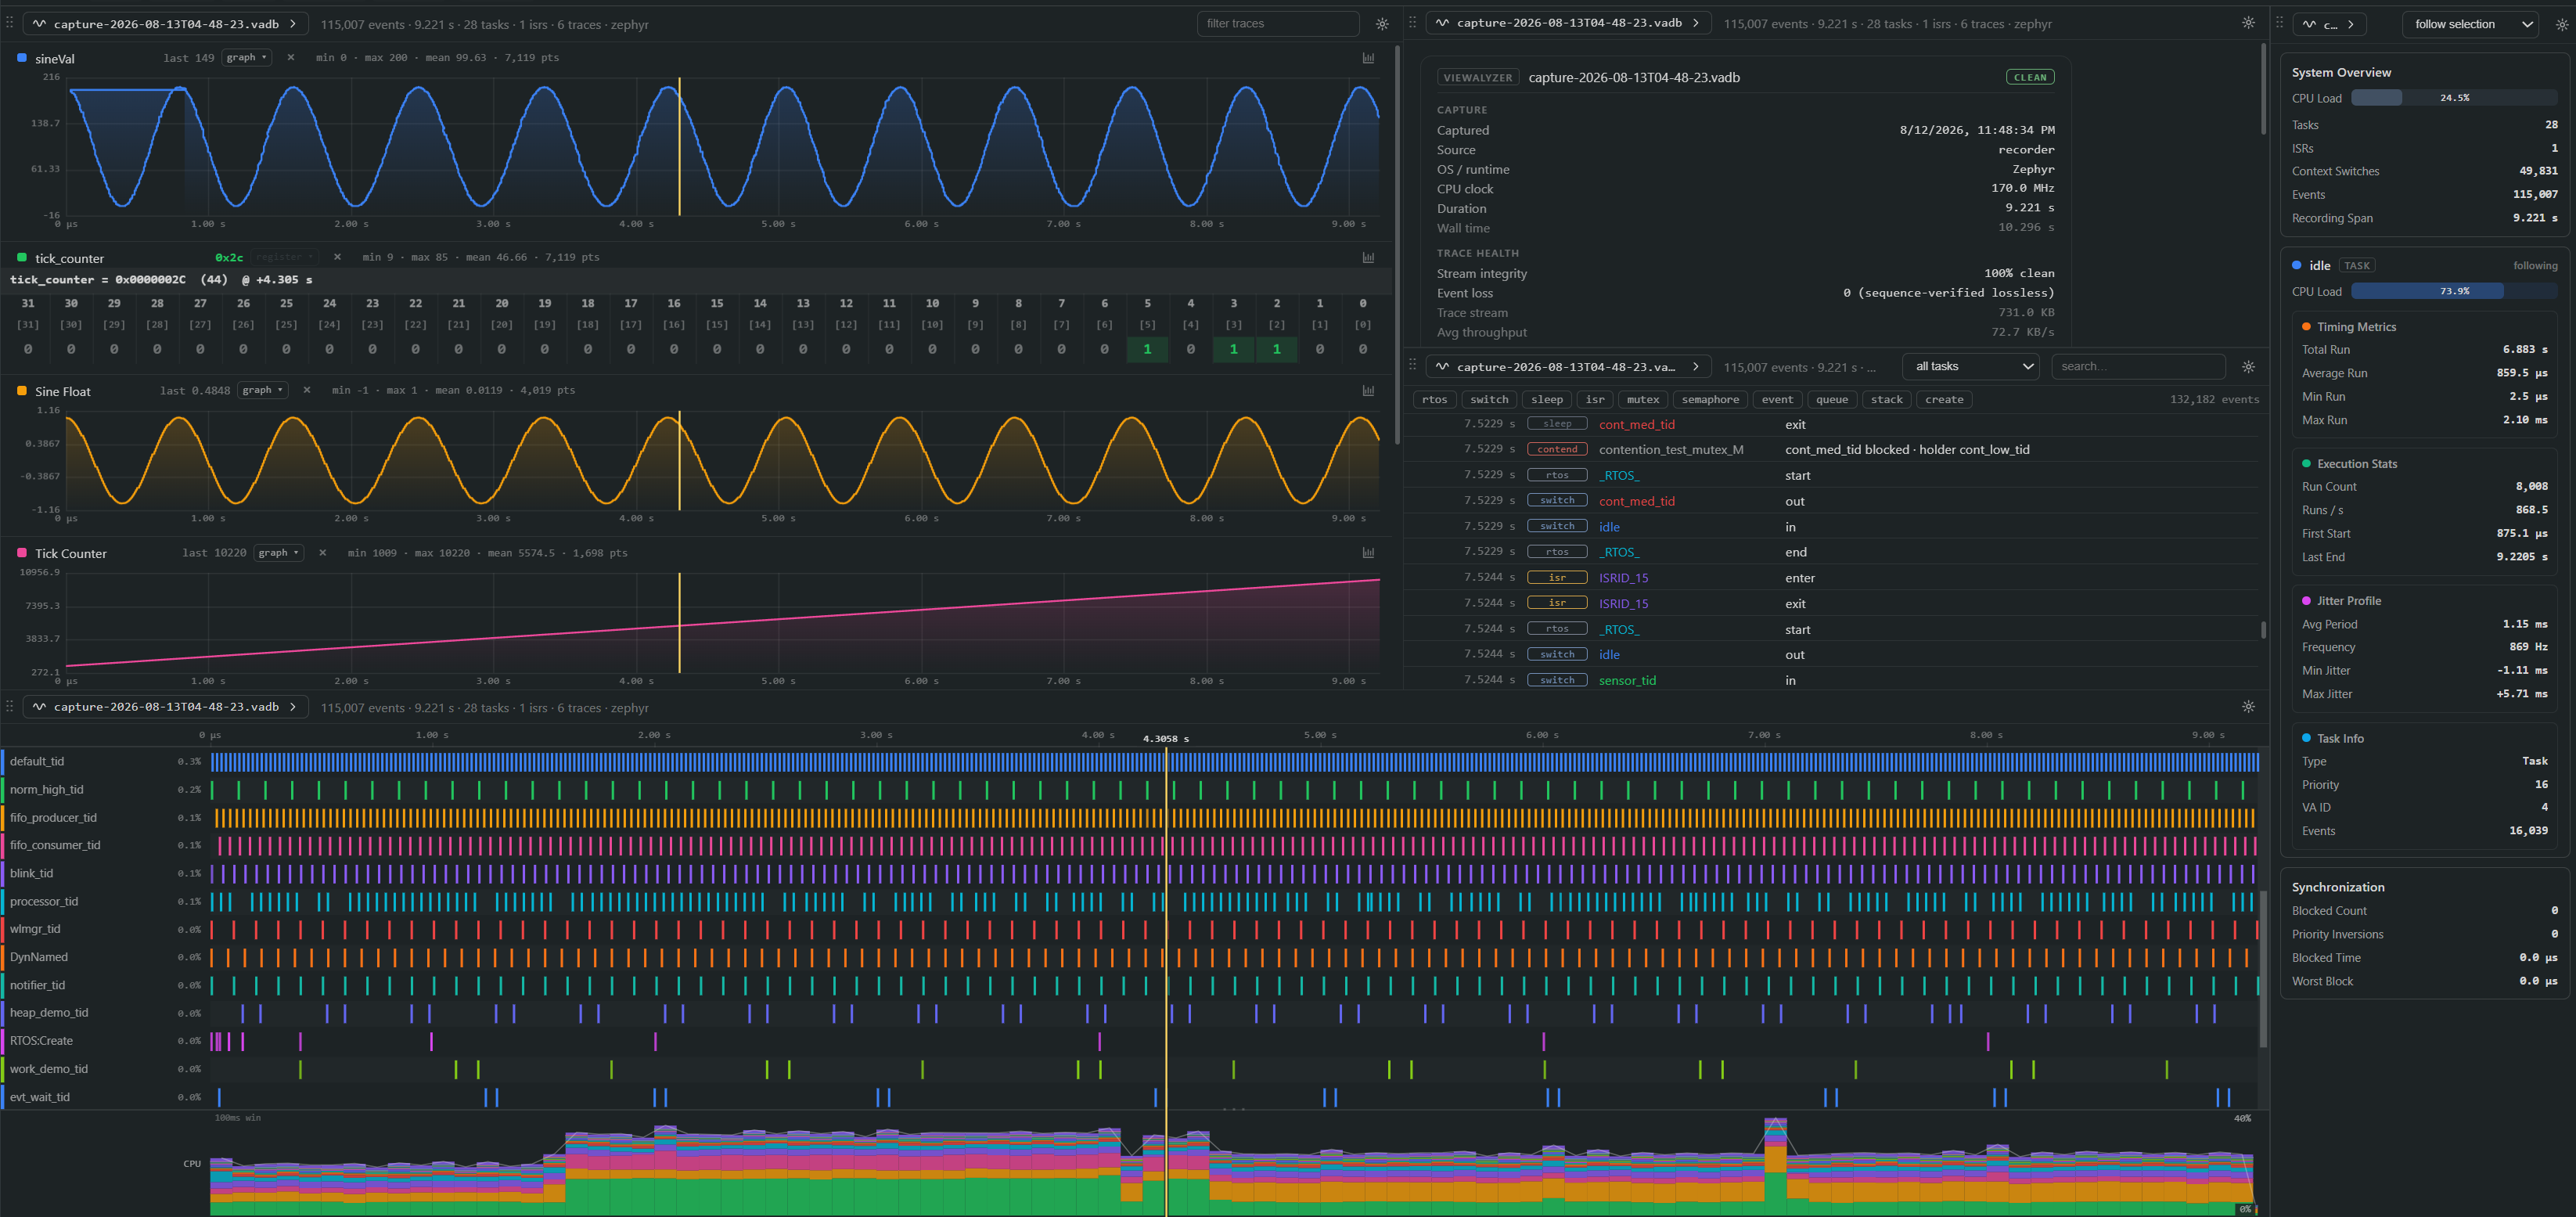
Timeline, event table, trace graphs, live register view, task details, and trace health - all inside VS Code

Record and view RTOS and embedded traces without leaving VS Code. ViewAlyzer captures scheduler activity, events, and variable traces from a live target over a J-Link or ST-LINK probe, then renders them in fast, interactive panels:

  • Timeline: per-task execution slices, context switches, and anomalies, zoomable from a whole capture down to microseconds.
  • Event table: every recorded event, searchable and filterable, with priority-inversion highlighting.
  • Trace graphs: plotted variable traces and memory polls, with zoom, pan, and cursor readouts synchronized across all open panels.

Works with FreeRTOS, Zephyr, and baremetal firmware.

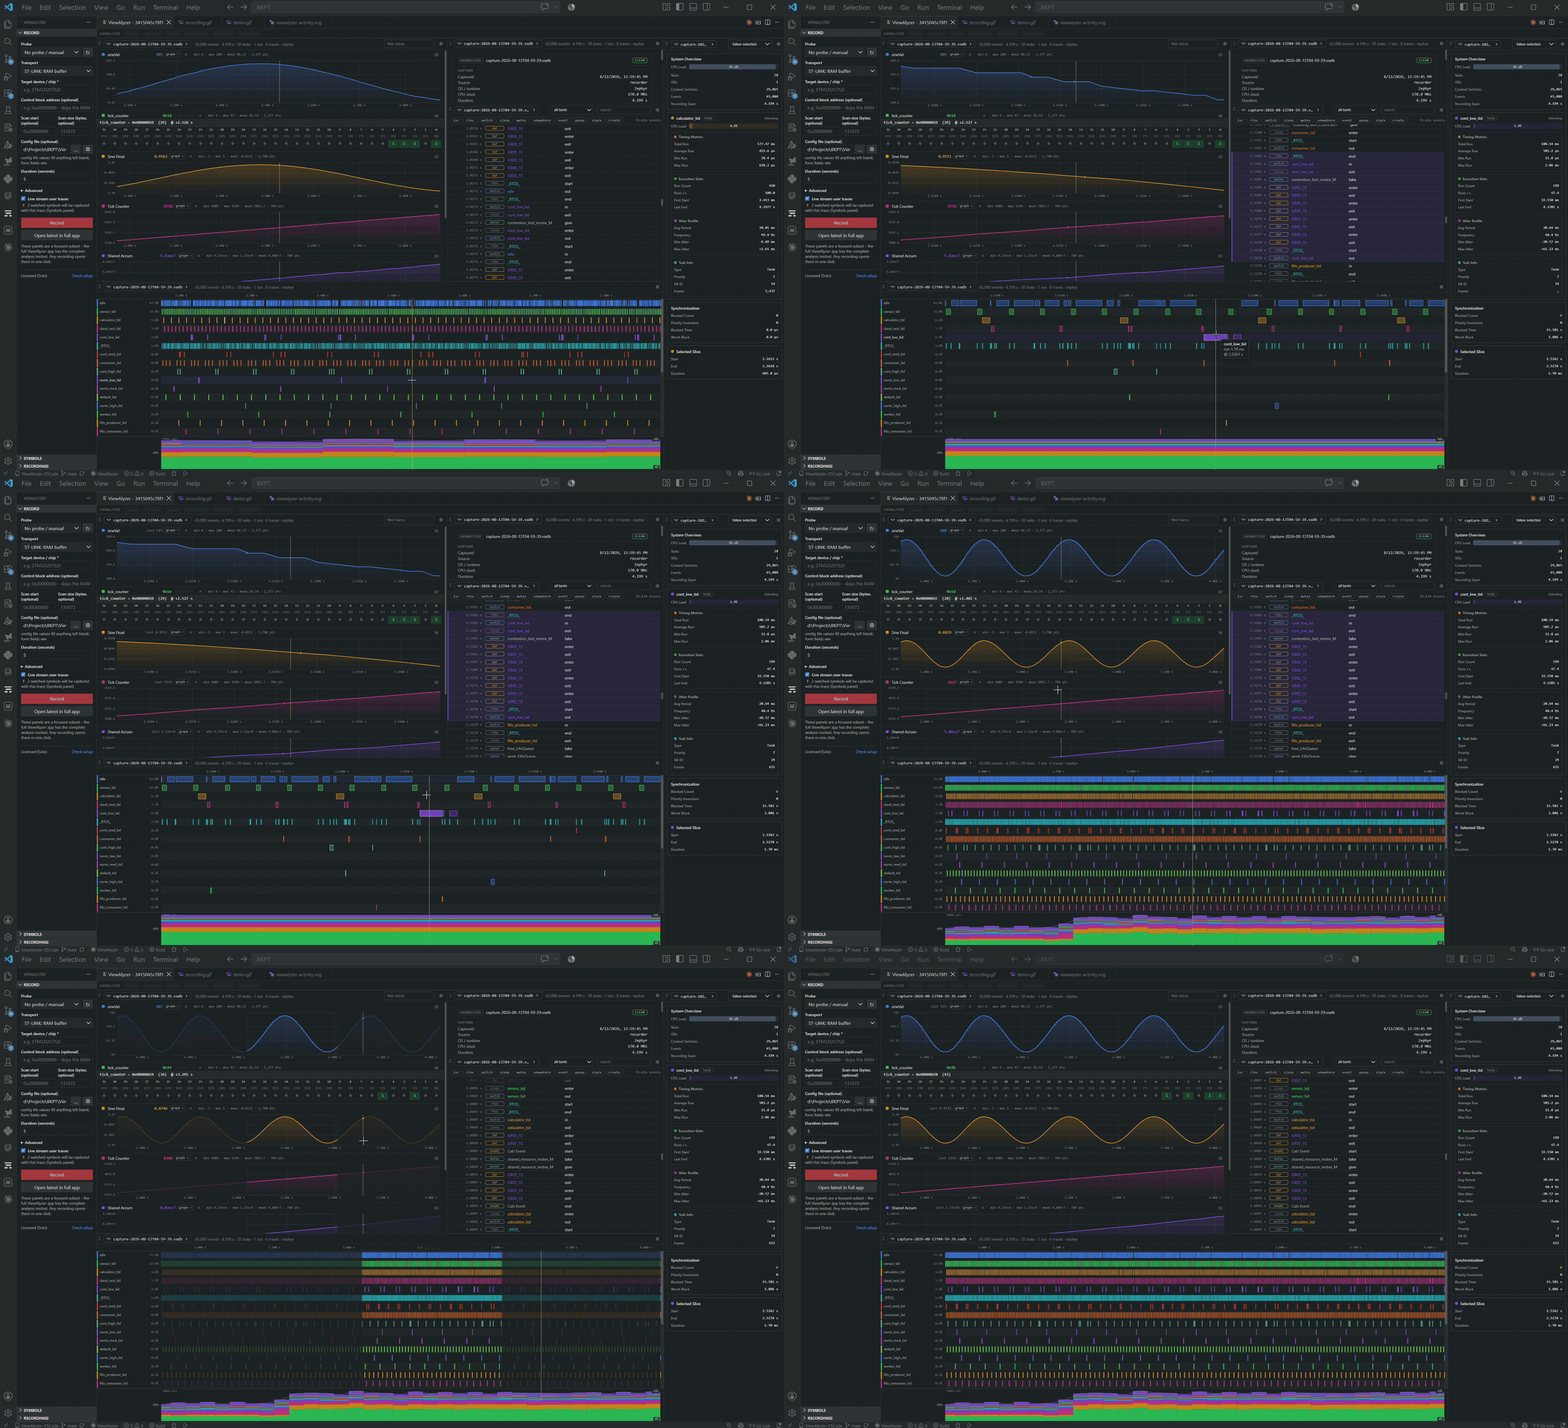
Recording a capture and exploring it live: graphs, register bits, event stream, timeline, and per-task stats

Made by BKPT Labs. The extension is free and works out of the box. The panels here are a focused subset of the full ViewAlyzer desktop app - and any recording opens there in one click (Open in Full App on a recording's row, or Open latest in full app under the Record button). Licenses and the desktop app are at bkptlabs.com.

Getting started

  1. Connect your board through a J-Link or ST-LINK probe.
  2. Click ViewAlyzer in the status bar (or run ViewAlyzer: Record Trace Capture from the Command Palette) to record a capture.
  3. The trace panels open automatically when the capture finishes. Existing recordings open any time via ViewAlyzer: Open Timeline (or Open Event Table / Open Traces Panel).

Firmware not instrumented yet? The ViewAlyzer-Examples repo has ready-to-build projects (Zephyr, FreeRTOS, and baremetal) with the recorder already wired in, plus desktop UDP senders to try the panels with no hardware at all.

Quick setup

  • ST-LINK: nothing to install - the driver is built into the bundled binary.
  • J-Link: install SEGGER's J-Link software if it is not on the machine yet. The extension finds it in the standard install locations; viewalyzer.jlinkPath in Settings points at the install directory for unusual setups.
  • Symbol watch: variable addresses come from your ELF via the Arm GNU toolchain (arm-none-eabi) or STM32CubeCLT, auto-detected from PATH and the standard install locations; viewalyzer.armGdbPath overrides.

Not sure what is missing? Run ViewAlyzer: Check Setup Health - it lists every dependency: found or not, where, and what to do about it.

Recording a capture

ViewAlyzer: Record Trace Capture walks you through it:

  • Pick how the target is connected. Detected probes are listed first (ST-LINK SWO or RAM buffer, J-Link RTT or RAM buffer), plus serial port and UDP transports. If you keep your setup in a .vacf file, pick Use config file... instead and skip the questions.
  • Answer only what the transport needs: target device name, serial port and baud rate, or UDP port. The extension remembers your target device.
  • Pick a duration and record. You can cancel mid-capture; whatever was captured so far is kept.

Recordings are saved under viewalyzer/captures/ in your workspace and open straight into the trace panels.

No instrumentation? Watch symbols live

The Symbols view works on any firmware - no recorder library, no code changes: pick your ELF, choose the variables to watch, and Start polls just those symbols over the probe (10 Hz to 10 kHz), streaming them into a live graph. The result opens in the trace panels like any recording. Once your firmware is instrumented, the same watch set rides along with every capture as extra traces.

Checking your setup

Not sure why a capture will not start? Run ViewAlyzer: Check Setup Health from the Command Palette, or click Check setup at the bottom of the Record panel. The results show, for each piece ViewAlyzer depends on (libusb, the J-Link library and GDB server, the ST-LINK GDB server, arm-none-eabi-gdb, and connected probes), whether it was found, where, and what to do if it was not.

Optional rows are fine to be missing: the J-Link entries do not matter if you capture over ST-LINK, and vice versa. Anything marked required and missing comes with a hint on how to fix it, and Copy report puts a plain-text version on the clipboard for support emails.

The check runs with the same tool paths captures use, so if you have set arm-none-eabi-gdb or J-Link paths in Settings, the report reflects exactly what a capture would see.

AI assistants (MCP)

The extension ships an MCP server that lets AI assistants record captures and query trace data: timelines, events, user traces, priority inversions, and SQL over the recording.

  • Copilot agent mode picks the server up automatically; no setup needed.
  • For other clients, run ViewAlyzer: Connect AI Assistant (also the sparkle button on the Recordings view) and pick yours: a claude mcp add one-liner for Claude Code, a one-click install link for Cursor, or a JSON config block for Claude Desktop and anything else that speaks MCP. Clients outside VS Code need Node.js 20+ installed.

Free version

The bundled binary runs unactivated, which caps capture length and the number of user traces shown, with a short cooldown between captures; the extension always tells you the exact limits in effect. Viewing recordings is unlimited.

Need longer captures, more traces, and the full desktop app? Upgrade at bkptlabs.com.

Already own ViewAlyzer?

Run ViewAlyzer: Use My Licensed ViewAlyzer. It finds your installed ViewAlyzer app (or lets you browse to it), checks its license, and switches the extension over: your limits apply, not the free version's. You can also set viewalyzer.binaryPath in Settings directly.

  • Contact us
  • Jobs
  • Privacy
  • Manage cookies
  • Terms of use
  • Trademarks
© 2026 Microsoft