BKPT DebugRead the BKPT Debug documentation →Help make BKPT Debug betterFound a bug, hit a board or probe that does not behave, or want a feature? Open an issue at github.com/BKPT-Labs/BKPT-Issues. Say which board, probe and VS Code version you used and what you expected to happen; the BKPT Debug Output channel and a screenshot of the layout usually tell the rest. Feature requests and questions are welcome there too. Setup guides, feature walkthroughs and troubleshooting on the BKPT Labs website.
Getting startedUse the controls in the top-right of the Debug Layout: 
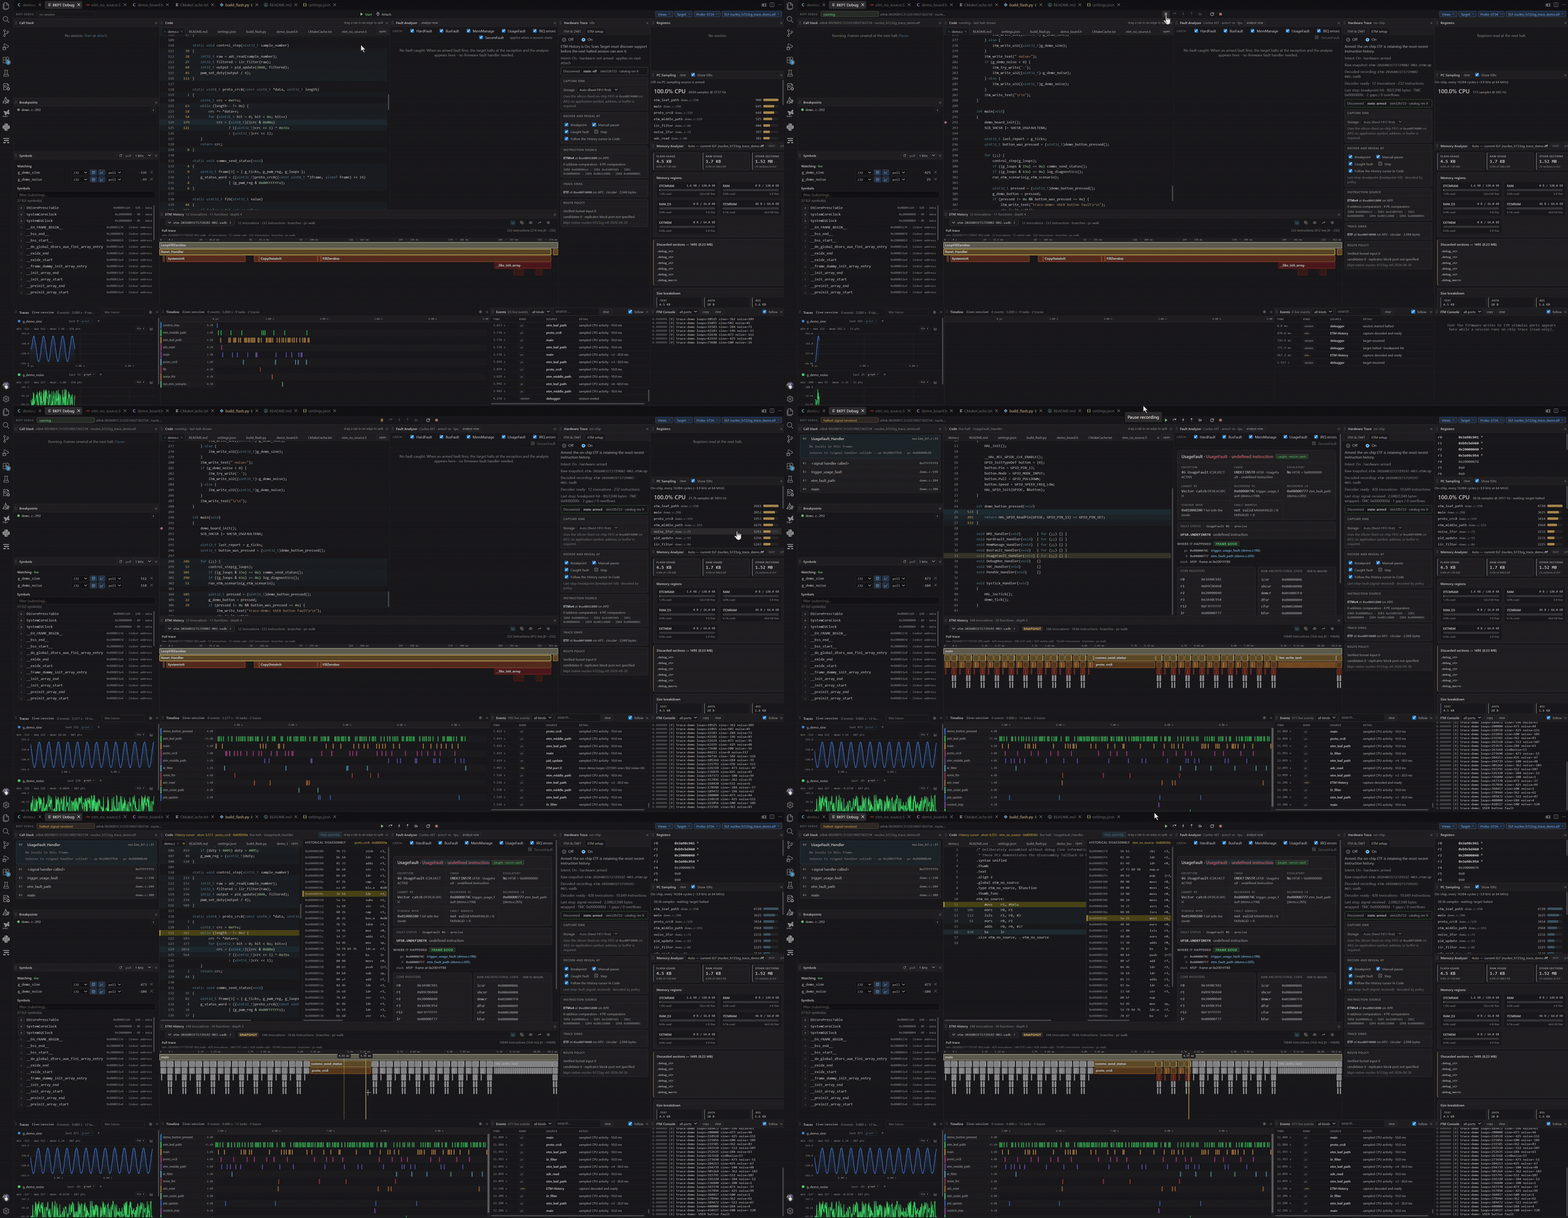
Once connected, the same toolbar shows Continue / Pause, the step controls, Reset and Stop. Hover a button for its name. Click a line number to set a breakpoint, and use Views to open the panels you need. Drag tiles to arrange them; the layout is remembered per workspace. FeaturesDebug and trace STM32 firmware in VS Code over a plain ST-LINK or J-Link. Step through code, catch and explain faults, see where the CPU spends its time, inspect ETM/SWV history, and watch variables live. No vendor GDB server, CubeProgrammer, or OpenOCD dependency.
Made by BKPT Labs. Inspecting values and instructionsSelect a Call Stack frame to see Locals / Args, Globals / Statics, and Expressions. Expand structs, unions, arrays and pointers on demand; arrays load 32 children at a time. Pointer cycles, null/unmapped pointers and optimized values show a reason. Saved expression watches retain their display format and evaluate only while halted with the view open. Formats include hex, decimal, binary, signed, float conversion and bounded strings (up to 128 bytes). The first inspection disables GDB inferior function calls for that connection, including implicit C++ operator calls. Expressions and breakpoint conditions must inspect data without calling target code. Hover a name in Code, or click a variable/register name, to inspect it. Edits require a literal value and confirmation; values refresh immediately afterward. Register and PC edits require the innermost frame. GDB thread selection shares the selected inspection scope; the experimental RTOS view provides separate FreeRTOS, ThreadX and Zephyr task inspection and live task activity through Samples or DWT events. Kernel layouts come from the matching ELF; recorder hooks are unnecessary. Zephyr currently supports single-core GNU Cortex-M supervisor contexts. G474 live-memory Samples during idle sleep have a known null-read limitation; the batch is discarded with an explanation, while halted inspection and DWT remain available. Select a blocked task to inspect its saved Call Stack and Variables while the processor stays halted in another task. Saved-task values are read-only; Return to Live core and Back to saved task switch the inspection view. Registers always shows the live core. See the task inspection and manual-layout guide for supported contexts, stack estimates and prerequisites. In Code, choose Source, Mixed, or Assembly. Select an instruction to toggle its breakpoint, run to it, set the next instruction, or copy its address and opcode. Branch targets are clickable, and missing source falls back to instructions. Instruction breakpoints last for the current session; removing a matching source breakpoint also clears its saved gutter entry. Set next asks for confirmation because it changes PC without updating stack/initialization. ETM history keeps its separate executed-instruction cursor. Closing Code or Variables stops their inspection requests while the debugger continues working. Recovering after a probe disconnectThe debug layout reports probe loss and clears stale live values. Reconnect the cable/power, then choose Reconnect and Halt in the warning or Command Palette. It uses the same probe, waits for the old server to exit, and requests no reset, flash, run-to-main or automatic resume. RAM may have been lost. Verify that the firmware matches your ELF, then choose Restore Debug Setup to restore breakpoints and watches while halted. Trace stays off; stop the session and Scan Target before using trace again. Ordinary recoverable target-access errors do not disconnect a healthy probe. What you need
LicenseFree-mode limits come from the bundled trace backend and apply consistently
to debug-session captures. In the BKPT Debug activity sidebar, use Activate
License Key… for a retail Solo or Team purchase. Use Install License
File… for a signed offline/OEM The sidebar reports the effective status and tier. Retail licenses show the
account email and updates entitlement; OEM licenses show the partner, signed
expiry, and grace date. Free mode shows the limits reported by the backend.
The adjacent Set Arm GDB Path… action opens VS Code Settings directly at
RTOS task inspection and stack scans remain free. Samples and DWT events share the backend's recording duration limit (5 seconds in free mode). Paused time and prerequisite waits do not use the allowance. At the limit, collection stops and the Timeline stays available for inspection. New task recording starts another capture and clears the previous task history. A ViewAlyzer license unlocks longer recording using the same shared license state. Fault AnalyzerRun the firmware, hit a fault, read what happened. The debugger catches HardFault, BusFault, MemManage, UsageFault and friends at the exception itself, before any handler runs, then shows:
Pick which fault classes to catch on the tile. Analyze now explains a fault on any halted target after the fact. PC samplingTurn it on and the debugger samples the program counter over the probe while the target runs. You get live CPU load, the hottest functions (interrupt handlers badged, click a row to jump), per-line sample counts in the editor gutter (amber while a line is executing), and a timeline of what the CPU was doing, one lane per function. Statistical, with zero overhead on the target. Hardware trace (SWV)The Hardware Trace tile has one switch. Sampling is the default: a rough profile with nothing to set up. The debugger scans the target and picks the source for you: on-chip PC sampling over the SWO pin when the core has the DWT and an ITM, polling over the probe otherwise. The tile always says which one is running and how fast, in one line ("On-chip, every 16384 cycles (~10.4 kHz at 170 MHz)" or "Polling over ST-LINK, ~3.1 kHz"). On-chip trace (advanced) opens everything the core has, the way Eclipse's SWV panel does: PC sampling with its interval (64 to 16384 cycles, each entry labelled with the rate it yields and its share of the SWO pin), exception trace (every interrupt's enter, exit and return), the DWT event counters (CPI, exception, sleep, LSU, fold), data watches on the DWT comparators (pick a slot in a Symbols row: the chip emits the value on every write, no probe traffic), ITM stimulus ports and timestamps. A control the core lacks is disabled with the reason, not hidden, and a load line turns red before the pin overflows. The ITM Console tile shows what the firmware prints on ITM stimulus ports (read-only), the Exceptions tile the traced exception counts. The selected sources are applied when the debugger attaches and restored when the session ends. Watch variables liveThe Symbols tile works on any firmware, no recorder library, no code changes. Pick variables from your ELF, and each one shows its live value in the row or graphs in the trace view, updating while the target runs and on every step. Each polled row has its own rate dropdown. SVD rows expose the same setting in Peripheral Registers and the Symbols watch list. Neither title bar has a polling rate: rows can run at different rates, and each shows its effective requested rate directly. Existing rows retain rates inherited from older settings; newly added symbols and registers start at 100 Hz. Each core keeps its own row settings. DWT and halt snapshots do not use polling rates. Toolkit schedules the combined watch and batches compatible entries that are due together; the extension creates no per-row timers. Choose Max + record on an individual row to collect as fast
as the probe and target allow. Slower rows keep their own periods. When any
active row uses Max, the shared per-core watch records all collected samples,
including slower rows, to a new The Events table is paged and virtualized for large traces. Clicking an event pins the shared time cursor, so Timeline and Traces move to the same point without duplicating the live wire stream in memory. |