Ashling RiscFree™ for Embedded Software Development
Develop, build and debug embedded software for Arm, RISC-V and MIPS ARC targets with Ashling RiscFree™. Debug on hardware using Ashling debug/trace probes, or on the QEMU simulator without target hardware or a license.
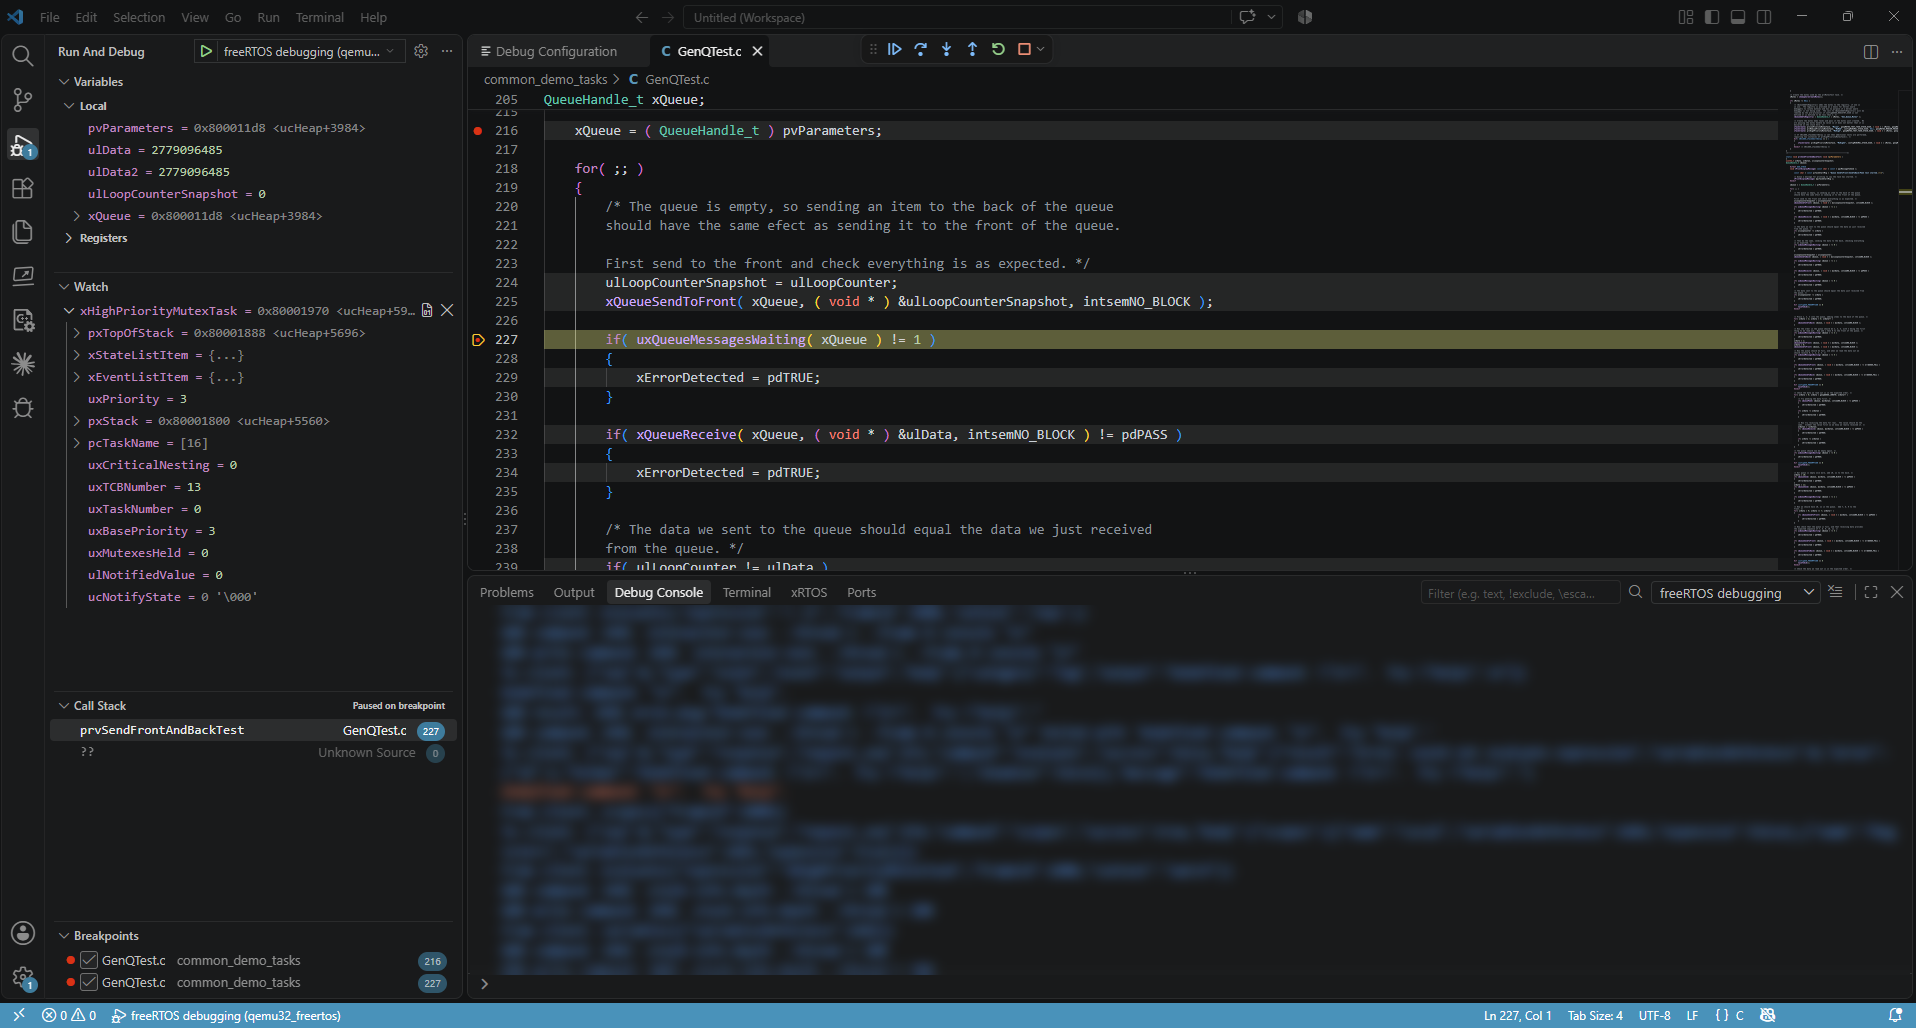
Try it free in a few minutes, with no hardware needed. Open the SDK Manager, install the Ashling SDK for RISC-V QEMU, import one of its example projects, then build and debug it on the simulator. See the Quick start below. The Get Started with RiscFree™ walkthrough on the VS Code Welcome page takes you through the same steps.
For detailed documentation, visit docs.ashling.com/vscode.
Features
- Arm, RISC-V and ARC hardware debugging: Debug applications on Arm, RISC-V, and MIPS ARC targets using Ashling Vitra-XS, Opella-XD or Opella-LD debug probes.
- RISC-V QEMU simulator debugging: Debug RISC-V applications without target hardware or a license.
- CMake and Make build support: Build CMake and Make projects directly from the Ashling Project View.
- Graphical debug configuration: Configure debug sessions through a graphical editor without manually editing
launch.json.
- RTOS-aware debug: Inspect tasks and their state while debugging FreeRTOS, Zephyr and uC/OS-II applications.
- Simultaneous heterogeneous multicore debug: Debug multiple cores of different types on the same device at the same time, each in its own debug session.
- Peripheral register inspection: Inspect and modify peripheral registers and their bit fields for supported target devices.
- SDK manager: Download, verify and manage Ashling SDKs, including GNU GCC toolchains and associated build and debug tools.
- Sample projects: Import ready-to-build example projects from installed SDKs.
At a glance
| Capability |
Support |
| Debug targets |
Arm hardware, RISC-V hardware, MIPS ARC hardware, RISC-V QEMU simulator |
| Debug probes |
Ashling Vitra-XS, Opella-XD, Opella-LD |
| Multicore debug |
Simultaneous debug of heterogeneous cores |
| Supported RTOS |
FreeRTOS, Zephyr, uC/OS-II |
| Build systems |
CMake, Make |
| Host platforms |
Windows x64, Linux x64 |
What's free and what needs a license
| Component or workflow |
License |
| Extension, SDK Manager, example projects, build |
Free, no license required |
| RISC-V QEMU simulator debugging |
Free, no license required |
| VSD (VLSI System Design) RISC-V hardware debugging |
Free, no license required |
| Arm, RISC-V and ARC hardware debugging with Ashling probes |
Ashling GDB server license. Activate it from Quick Operations → Activate Ashling GDB Server License. |
To buy a license or an Ashling probe, visit www.ashling.com or contact support@ashling.com.
Quick start
After installing the extension, follow the steps below to start your first debug session. Import an example project in step 3 or open an existing project in step 4, then continue to step 5. The circled numbers refer to the numbered markers in the screenshots.
1. Open the Ashling view
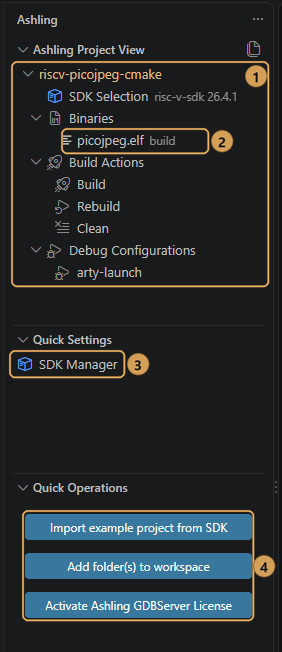
Click the Ashling icon in the activity bar. The view has three sections:
- Ashling Project View ① lists each project with its SDK, binaries, build actions and debug configurations. Binaries ② shows the
.elf and .axf files built in the project.
- Quick Settings ③ opens the SDK Manager.
- Quick Operations ④ imports example projects, adds folders to the workspace and activates your license.
2. Install an SDK
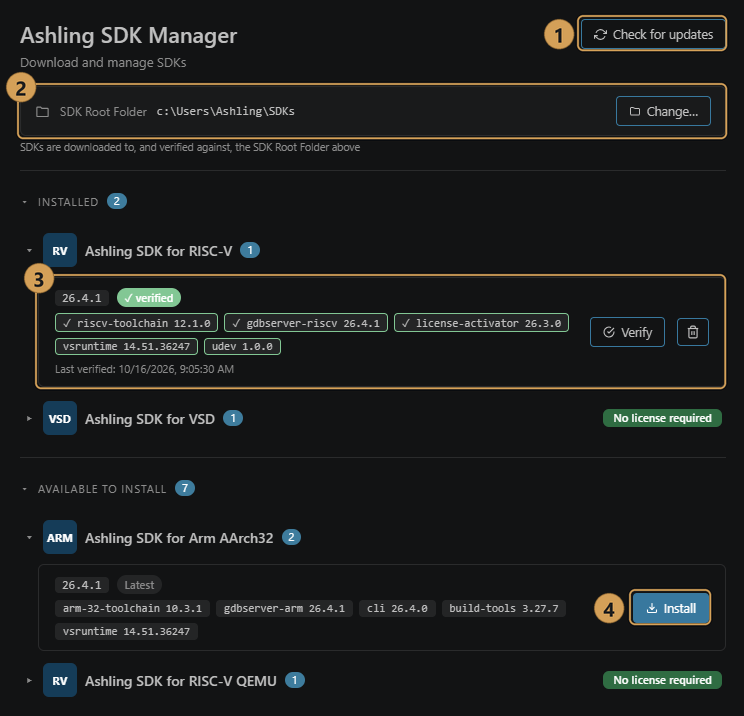
Under Quick Settings, click SDK Manager. Then:
- Click Check for updates ① to get the latest list of SDKs.
- SDKs are downloaded to the SDK Root Folder ②. Click Change… to use a different folder.
- Installed SDKs ③ show their version and components. A verified tag indicates that all SDK components passed verification. Click Verify to check again, or the bin icon to remove the SDK.
- Under Available to install, click Install ④ next to the SDK you need.
SDKs marked No license required, such as the Ashling SDK for RISC-V QEMU, work without a license.
3. Import an example project
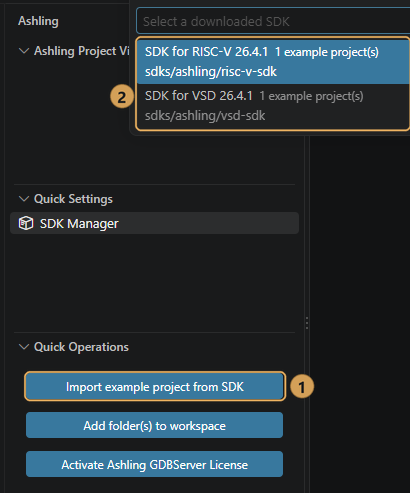
- In Quick Operations, click Import example project from SDK ①.
- Pick an SDK ②, then an example project, then the folder to import it into.
The project opens in the workspace with its SDK already selected.
4. Or open an existing project
- Choose File → Open Folder… and select your project folder. To add a project to a workspace that is already open, click Add folder(s) to workspace in Quick Operations instead.
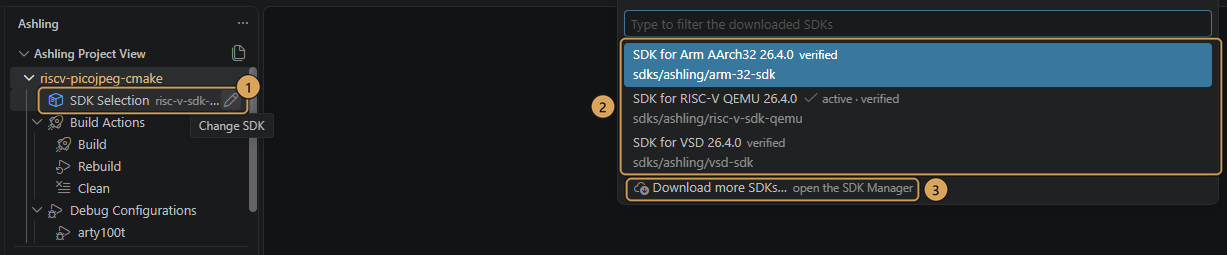
- In the Ashling Project View, click SDK Selection ① under the project.
- Pick an SDK from the list ②. If the SDK you need isn't there, click Download more SDKs… ③.
A project with a CMakeLists.txt builds with CMake. Otherwise, a project with a Makefile, makefile or GNUmakefile builds with Make.
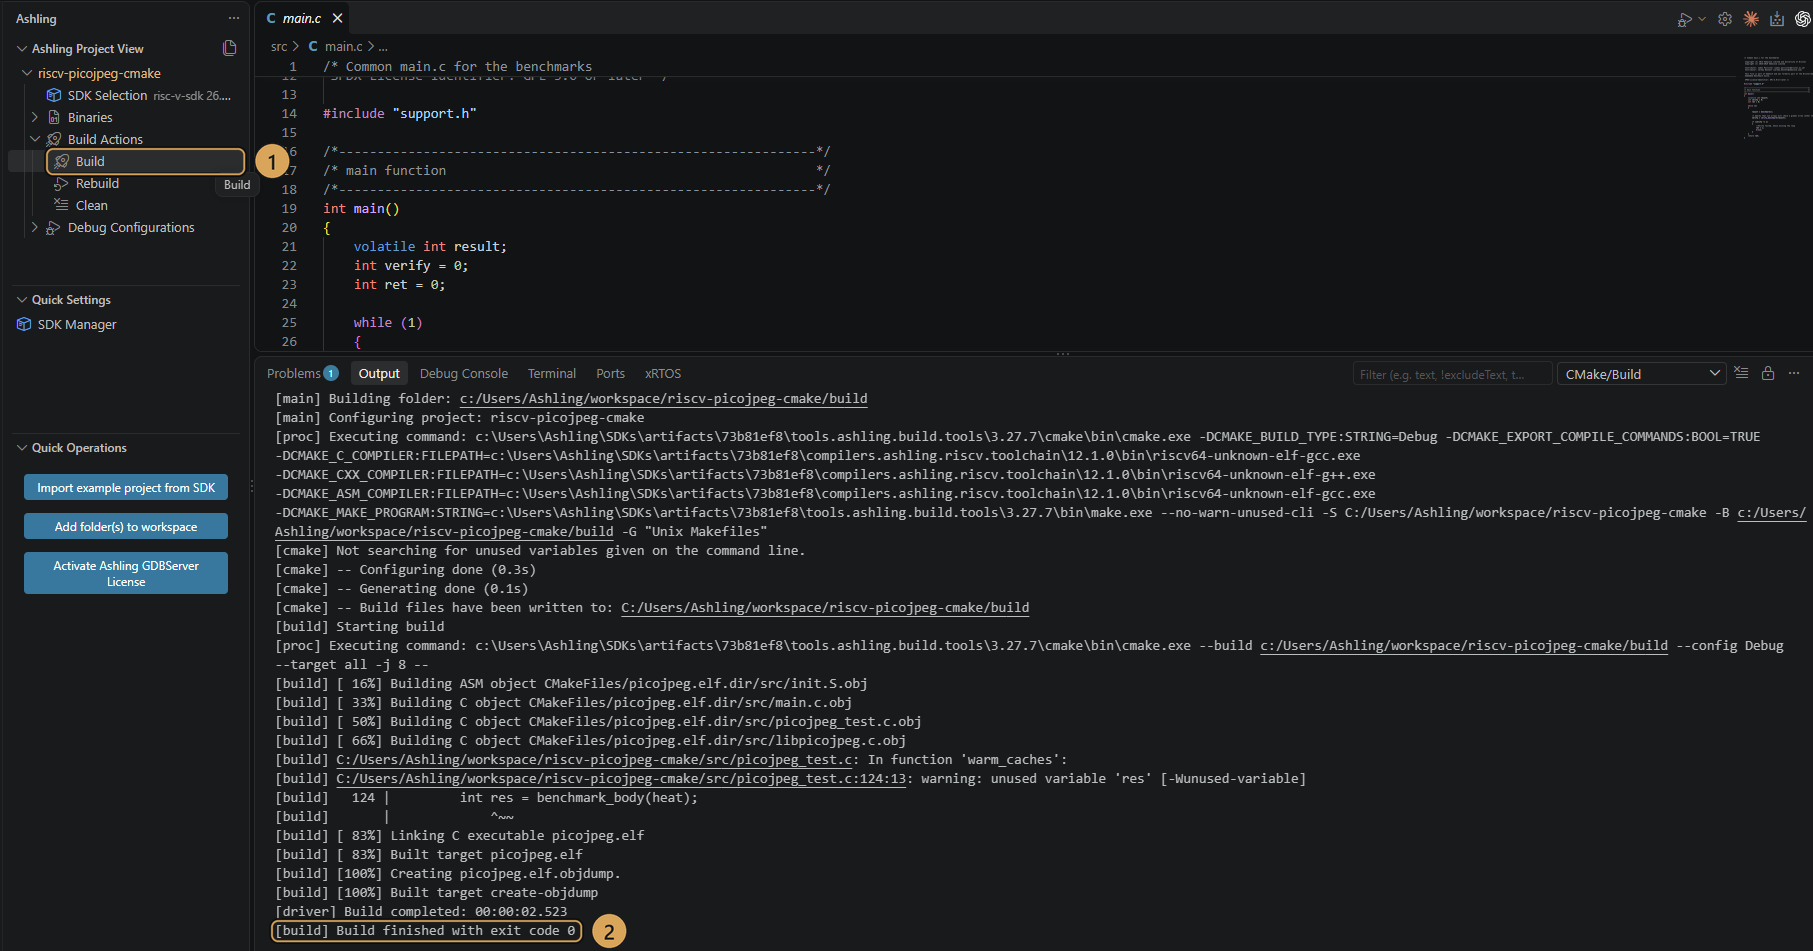
5. Build/Compile the application
Under Build Actions, click Build ①. Rebuild and Clean next to it. The result appears in the Output panel ②.
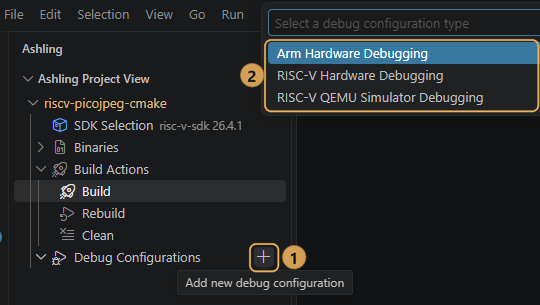
6. Create a debug configuration
- Click + next to Debug Configurations ①.
- Choose Arm Hardware Debugging, RISC-V Hardware Debugging, ARC Hardware Debugging or RISC-V QEMU Simulator Debugging ②.
- Enter a name for the configuration.
Hardware debugging needs an Ashling GDB server license. In Quick Operations, click Activate Ashling GDB Server License.
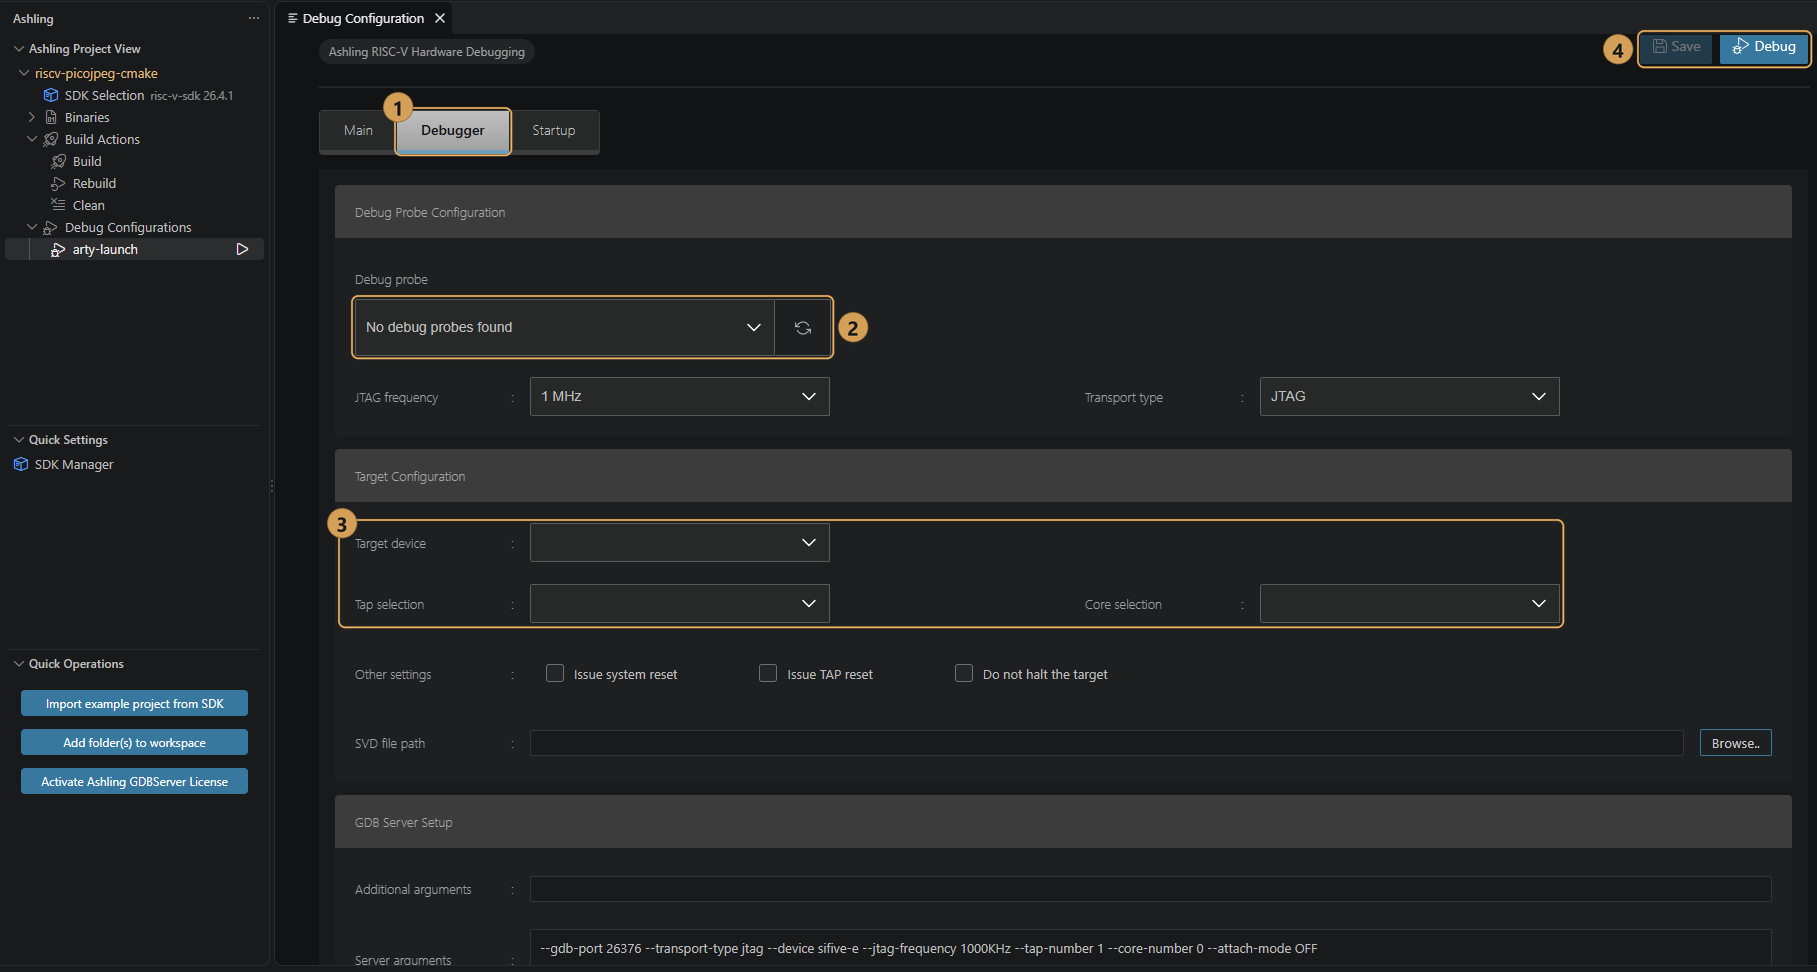
The configuration opens in the Debug Configuration editor:
- On the Main tab, choose the program to debug with Search Project.. or Browse...
- On the Debugger tab ①, pick your Debug probe ②. Click the refresh button to scan for probes again.
- Configure the target device, TAP and core settings ③ as applicable to your selected hardware target.
- On the Startup tab, set the load options and the commands to run at startup.
- Click Save to keep your changes, or Debug ④ to save and start debugging.
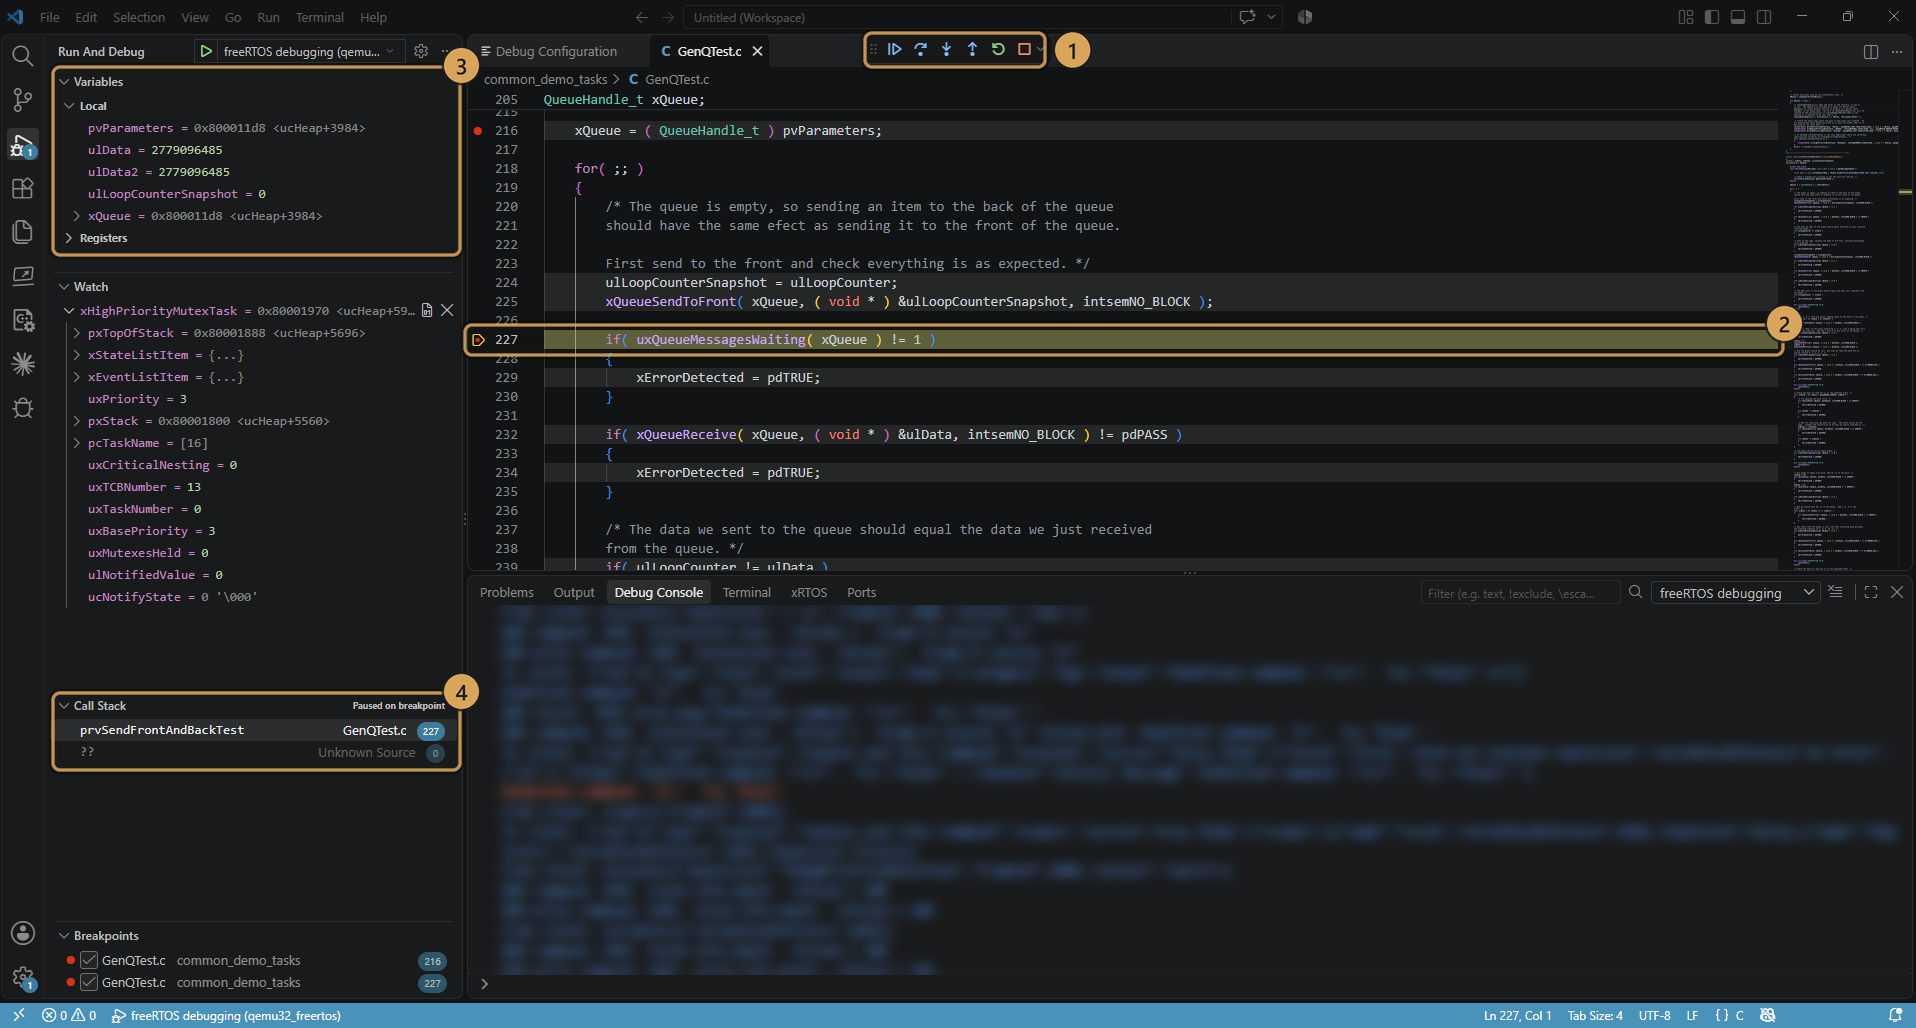
7. Download and debug the application
Start debugging from the Debug Configuration editor, or with ▶ next to the configuration in the Ashling Project View. Then:
- control execution with the debug toolbar ①;
- see where the program is paused ②;
- inspect variables ③;
- follow the call stack ④.
Documentation
For full details on SDKs, debug configuration options, probes and licensing, see docs.ashling.com/vscode.
Feedback and support
To report a bug or request a feature, open an issue on GitHub. Issues are public, so don't include license keys or confidential details.
For technical support, licensing or anything you'd rather not post in public, contact support@ashling.com. The link opens a new email with a template for the details we need.
Thank you for choosing the Ashling RiscFree™ for Embedded Software Development.

