APIScout — API Explorer & OpenAPI Readiness for VS Code
Discover REST API endpoints in Express, FastAPI, Django, Flask, and NestJS, measure documentation readiness, review source-backed findings, and export OpenAPI (Swagger) without leaving VS Code.
APIScout turns the backend project in your current workspace into a practical API inventory. Core discovery runs locally, so you can inspect a branch that has never been deployed, find documentation gaps, and trace endpoints and findings back to their handlers.
The workflow goes beyond inventory: use a weighted OpenAPI Readiness score, compare scans against a previous result or accepted baseline, review or suppress findings with reasons, and optionally generate endpoint-specific descriptions and remediation guidance with your own AI provider.
An ApyGuard account sign-in is part of the product workflow. The extension uses the normal ApyGuard browser handoff and stores its integration key with VS Code. AI remains optional; when enabled, requests are sent to the provider you configure. Documentation is uploaded to ApyGuard only when you explicitly create an asset or import documentation.
Demo
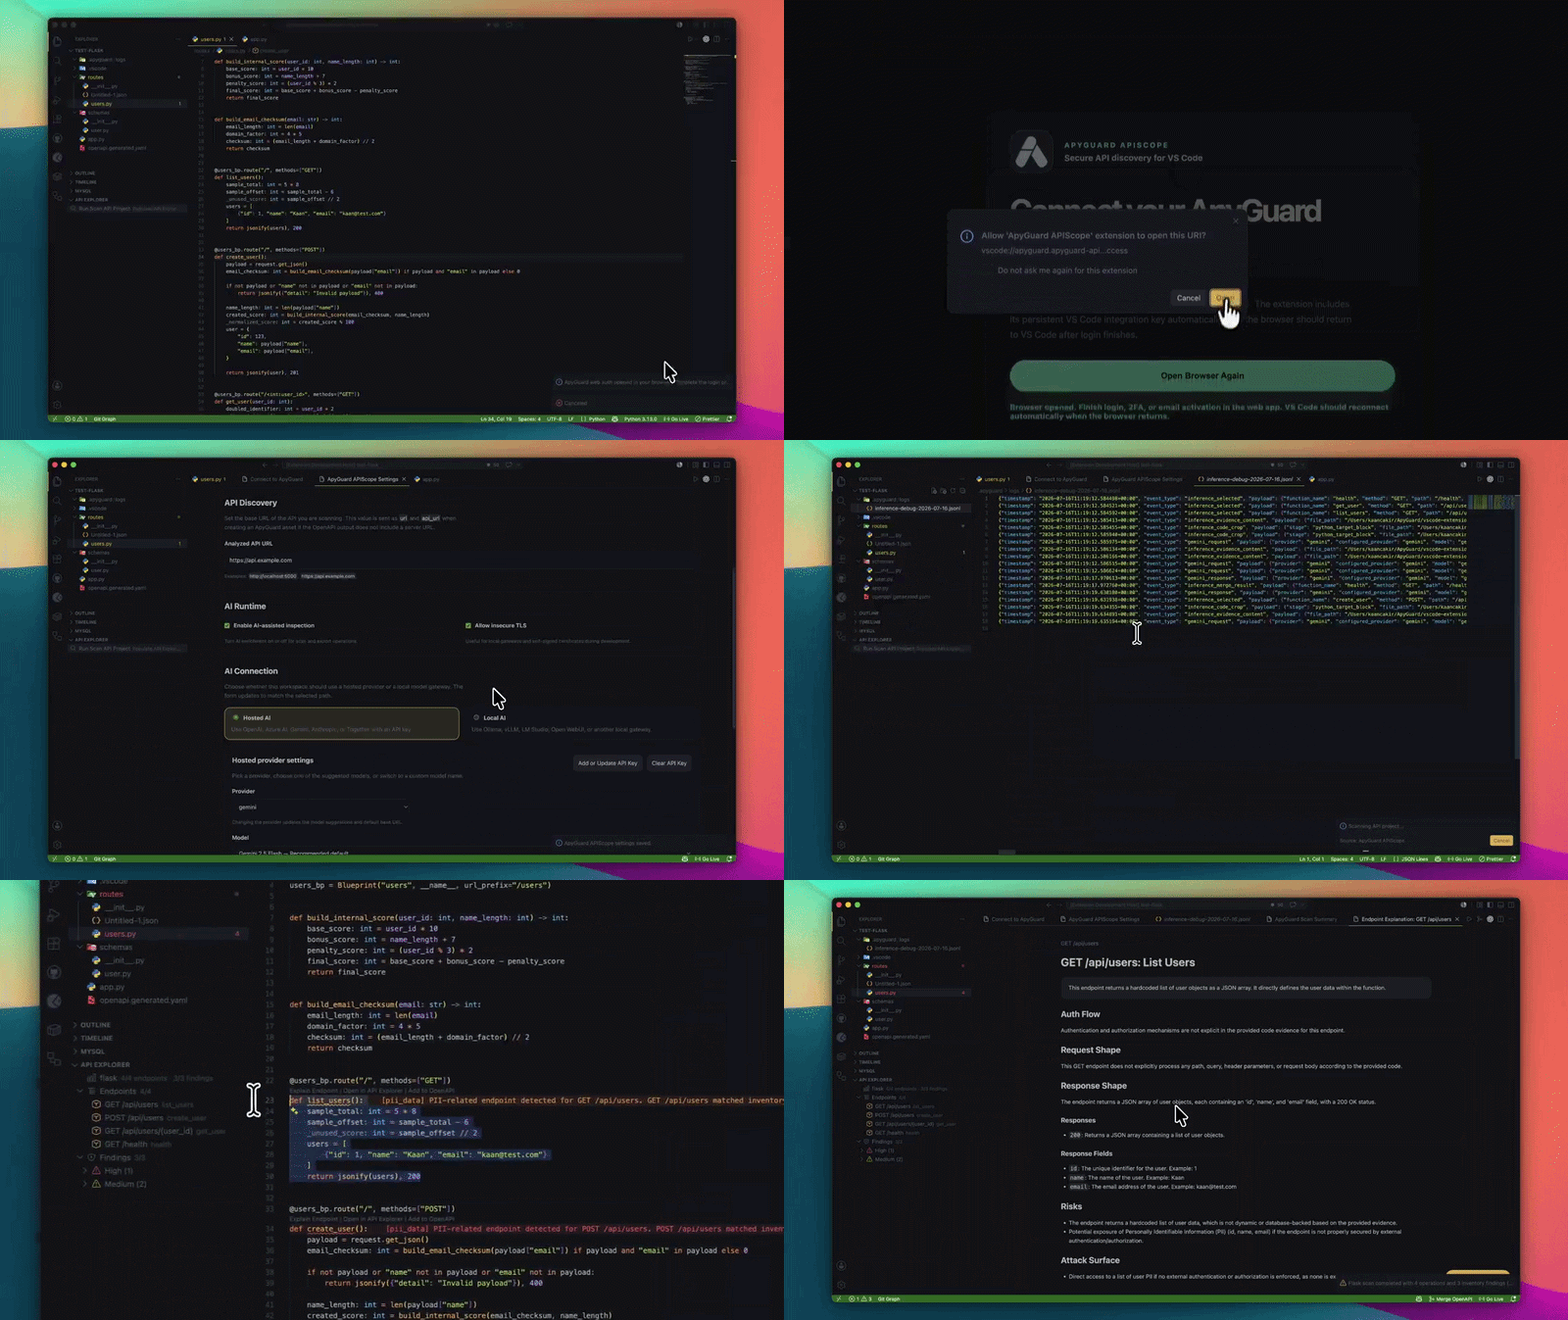
What You Can Do
- discover paths, methods, handlers, and source evidence from supported backend projects
- measure documentation completeness with a weighted OpenAPI Readiness score
- generate endpoint-specific OpenAPI descriptions and short remediation suggestions with optional AI
- add generated descriptions, suggestions, and deterministic fixes to the real handler as
TODO(APIScout) comments
- inspect finding confidence, evidence, sensitivity, and suggested fixes from Priority Finding cards
- open the real handler or controller from a finding instead of stopping at the route declaration
- mark findings reviewed, suppress them with a required reason, or reopen them later
- keep reviewed and suppressed findings visible with distinct cards, icons, badges, and suppression reasons
- filter by method, path, severity, review state, or changed endpoints and sort by path, file, or risk
- compare the latest inventory with the previous scan or an accepted API baseline
- identify added, removed, and changed endpoints and export the comparison as Markdown
- detect stale results when source files change and rescan from the Explorer
- export OpenAPI as
.yaml, .yml, or .json
- preview the latest scan with a bundled, theme-aware Swagger UI and use
Try it out
- send requests from a searchable endpoint playground with path, query, header, OpenAPI authentication, and body inputs
- validate and format JSON, inspect redirects and final URLs, review bounded responses, or copy requests as cURL
- use grouped CodeLens actions when multiple endpoints share the same source location
- explain individual endpoints and merge generated documentation into an OpenAPI file
Best For
- teams documenting existing APIs that are ahead of their specs
- engineers validating API inventory before publishing OpenAPI
- security and platform teams mapping exposed routes
- developers working locally who want a source-driven API workflow
OpenAPI Readiness
The Scan Summary presents a weighted documentation score instead of treating every gap as equally important. Checks cover:
- operation descriptions
- request parameters and request bodies where applicable
- documented responses
- authentication and security declarations
- unique operation IDs
- source confidence for routes that need manual review
Each readiness issue links to an affected endpoint. Missing descriptions can produce ready-to-use endpoint-specific text, while other gaps can request a short AI suggestion.
Finding Review Workflow
Priority Finding cards provide direct access to Open Source, Suggested Fix, and Generate AI Suggestion.
Reviewed findings stay visible with a green badge and Explorer icon.Suppressed findings stay visible with a separate icon and their required suppression reason.Reopen Finding returns either state to the active review queue.- confidence and evidence show why APIScout reported the finding.
APIScout does not apply implementation fixes. It provides guidance and lets the user explicitly add the selected text as a source comment.
Add as TODO
Generated OpenAPI descriptions, AI suggestions, and built-in suggested fixes include an Add as TODO action. APIScout resolves the real endpoint handler, inserts a language-appropriate TODO(APIScout) comment, and opens the edited file for review.
TODO insertion currently supports Python, JavaScript, and TypeScript source files. Long suggestions are wrapped for readability and duplicate TODO comments are rejected.
Scan History and API Changes
APIScout compares each scan with the previous result or an accepted baseline. The Explorer and Scan Summary surface added, removed, and changed API contract details, including potentially breaking changes. Comparisons can be exported as Markdown for pull requests and team review.
Supported Frameworks
- Django
- Express
- FastAPI
- Flask
- NestJS
The engine can also work with existing OpenAPI specification files as input.
Typical Workflow
- Open a supported API project folder in VS Code.
- Sign in to your ApyGuard account when prompted.
- Run
ApyGuard APIScout: Run Doctor.
- Run
ApyGuard APIScout: Scan API Project.
- Review OpenAPI Readiness, Priority Findings, source evidence, and API changes in the Scan Summary.
- Mark findings reviewed or suppressed, request optional AI guidance, and add useful results as TODO comments.
- Accept a baseline, export the change report, or export OpenAPI when the inventory is ready.
Guided Onboarding
The extension now contributes a built-in walkthrough:
- open
Get Started with ApyGuard APIScout from the VS Code Walkthroughs view
- open
API Explorer
- run
ApyGuard APIScout: Run Doctor
- scan the project
- export OpenAPI after reviewing endpoints and findings
Doctor Checks
ApyGuard APIScout: Run Doctor validates the local-first workflow before scan and export:
- workspace folder availability and supported framework hints
- configured Python runtime reachability
- engine path resolution and CLI boot
- AI configuration readiness, including missing API keys or insecure TLS settings
Commands
ApyGuard APIScout: Scan API ProjectApyGuard APIScout: Continue WorkflowApyGuard APIScout: Rescan Outdated ResultsApyGuard APIScout: Review FindingsApyGuard APIScout: Show Scan SummaryApyGuard APIScout: Preview OpenAPI with Swagger UIApyGuard APIScout: Open Request PlaygroundApyGuard APIScout: Accept Current API BaselineApyGuard APIScout: Export API Changes as MarkdownApyGuard APIScout: Export OpenAPIApyGuard APIScout: Run DoctorApyGuard APIScout: Explain This API EndpointApyGuard APIScout: Merge Explained Endpoint Into OpenAPIApyGuard APIScout: Configure AIApyGuard APIScout: Open SettingsFilter API ExplorerSort API ExplorerClear API Explorer FiltersApyGuard APIScout: Set AI API KeyApyGuard APIScout: Sign InApyGuard APIScout: Sign OutApyGuard APIScout: Open Login ScreenApyGuard APIScout: Configure Local AIApyGuard APIScout: Clear AI API Key
Requirements
- VS Code
1.90.0 or newer
- Python
3.9 or newer
- a workspace folder open in VS Code
The extension bundles the core-engine source code, but it still needs a working Python interpreter on your machine.
Setup
Recommended in-product setup
For most Marketplace users, the easiest way to get started is from the extension UI:
- Open the
API Explorer sidebar.
- Use the view actions to scan the project, export OpenAPI, or open the settings screen.
- Use
ApyGuard APIScout: Open Settings to manage AI and batching settings from the built-in settings screen.
- Return to the sidebar when you want to run the next scan or export.
This is the recommended day-to-day workflow because it keeps setup and execution in one place.
Python
If python3 is already available on your PATH, you can usually start scanning immediately.
If not, set:
{
  "apyguardApiScout.pythonPath": "/absolute/path/to/python"
}
AI
AI-assisted enrichment is optional.
Hosted providers currently supported:
- Gemini
- Together AI
- OpenAI
- Azure AI / Foundry
- Anthropic
Recommended setup path:
- Open the
API Explorer sidebar.
- Click the settings action or run
ApyGuard APIScout: Open Settings.
- Configure your main AI and batching preferences in the settings screen.
- Run
ApyGuard APIScout: Set AI API Key only when you need to store or update a hosted provider key.
Manual Command Palette path:
- Run
ApyGuard APIScout: Configure AI.
- Choose a provider and model.
- Run
ApyGuard APIScout: Set AI API Key.
For local AI, the recommended manual path is:
- Run
ApyGuard APIScout: Configure Local AI.
- Select the protocol adapter your local gateway exposes.
- Set the base URL for that endpoint.
After that, use ApyGuard APIScout: Open Settings if you want to adjust batching or the rest of the AI-related settings in one place.
Supported local adapters:
openaigeminianthropictogether
API keys are stored securely with the VS Code secrets API.
Hosted providers supported by the extension:
geminitogetheropenaiazureanthropic
Key Settings
You can manage these directly in VS Code settings, but Marketplace users will usually have the best experience by opening the built-in settings screen with ApyGuard APIScout: Open Settings.
apyguardApiScout.pythonPath: Python 3.9+ interpreter used to run the engineapyguardApiScout.enginePath: optional absolute override for the engine rootapyguardApiScout.outputFileName: default export filenameapyguardApiScout.authEnabled: enables or disables the browser handoff to the ApyGuard web auth flowapyguardApiScout.authLoginUrl: browser login URL for ApyGuard web authapyguardApiScout.aiEnabled: enables or disables AI-assisted scan and export enrichmentapyguardApiScout.aiProvider: provider selectionapyguardApiScout.aiBaseUrl: custom provider or local gateway URLapyguardApiScout.aiLocalAdapter: local protocol adapterapyguardApiScout.aiModel: model name overrideapyguardApiScout.aiCaBundlePath: CA bundle path for AI HTTPS requestsapyguardApiScout.aiAllowInsecureTls: disables TLS verification for local testing and defaults to falseapyguardApiScout.aiDebugEnabled: writes AI debug logsapyguardApiScout.aiDebugLogDir: workspace-relative AI debug log directoryapyguardApiScout.aiBatchSize: endpoints per AI inspection batchapyguardApiScout.aiMaxConcurrentFlows: maximum parallel AI inspection flows
Example:
{
  "apyguardApiScout.pythonPath": "/absolute/path/to/.venv/bin/python",
  "apyguardApiScout.outputFileName": "openapi.generated.yaml",
  "apyguardApiScout.aiEnabled": true,
  "apyguardApiScout.aiProvider": "azure",
  "apyguardApiScout.aiBaseUrl": "https://your-resource.services.ai.azure.com/openai/v1",
  "apyguardApiScout.aiModel": "your-deployment-name"
}
Azure base URL notes:
- Legacy Azure OpenAI:
https://your-resource.openai.azure.com
- OpenAI v1 on Azure or Foundry:
https://your-resource.openai.azure.com/openai/v1 or https://your-resource.services.ai.azure.com/openai/v1
- Foundry Models API:
https://your-resource.services.ai.azure.com/models
Explorer Filtering and Prioritization
After a scan, API Explorer can be tuned for large inventories:
- method filter for endpoints and method-aware findings
- path text filter shared across endpoints and findings
- finding severity filter for high, medium, or low sensitivity issues
- severity sub-groups with counts like
High (2) and Medium (3)
- sort modes for path, file, or risk
Local-First Behavior
APIScout runs core discovery and analysis locally inside your VS Code environment.
That means:
- source code is scanned from your current workspace
- the Python engine runs on your machine
- you can disable AI and use engine-only workflows
- optional AI requests go to the provider configured by the user
- ApyGuard asset creation or documentation import uploads data only after an explicit user action
- local development builds can point to a sibling
../core-engine
Swagger Preview and Request Playground
After a scan, run ApyGuard APIScout: Preview OpenAPI with Swagger UI to render
the latest generated document. Swagger UI is bundled with the extension and does
not load scripts or styles from a CDN. The preview follows the active VS Code light
or dark theme, resolves local OpenAPI $ref values, and uses the configured
apyguardApiScout.analyzedApiUrl as its API server. Try it out uses Swagger UI's
standard browser request flow, so the target API must explicitly allow the VS Code
webview origin through its CORS policy. Keep CORS restricted to trusted development
origins instead of enabling every origin.
Use the play action on an Explorer endpoint, or run ApyGuard APIScout: Open Request Playground, to open a searchable collection of every discovered endpoint.
Switch between endpoints from the sidebar and configure params, auth, headers, and
body in dedicated tabs. The playground fills documented parameter and JSON body
examples. Each endpoint keeps its own in-memory draft, including authentication,
additional headers, body, and redirect preference.
The Auth tab reads OpenAPI security declarations and supports Bearer and OAuth2
tokens, Basic authentication, and header, query, or cookie API keys. Django scans
map AllowAny and IsUnauthenticated permissions to unauthenticated operations and
map protected permission classes to a JWT Bearer scheme. When no security metadata
is available, the Playground keeps a manual full Authorization header field.
Global DRF DEFAULT_PERMISSION_CLASSES and ViewSet action overrides are considered;
custom permissions use an explicit unknown-auth declaration instead of assuming JWT.
JSON request bodies are validated before sending and can be formatted in place.
Operations with multiple supported request media types expose a content-type selector,
including JSON-object editing for application/x-www-form-urlencoded requests. JSON,
XML, plain text, CSV, YAML, and GraphQL can also be selected manually when the API
supports a format that is not declared by its OpenAPI operation.
JSON responses are formatted automatically, and an HTML response is flagged when
the operation documents JSON. The response panel shows status, duration, final URL,
redirects, headers, and truncation state. Redirect following is optional, limited to
five same-origin hops, and disabled by default. Requests run in the extension host,
so the Playground is not subject to browser CORS; request and response bodies are
limited to 2 MB, with oversized responses stopped while streaming.
Changing the request origin from the configured API requires explicit session
approval. In-flight requests can be cancelled. The response area keeps the latest
20 requests in session with duplicate and retry actions, provides a JSON tree, keeps
repeated headers such as Set-Cookie, and can copy or save the response body.
Troubleshooting
Swagger Try it out reports Failed to fetch
Swagger Preview sends requests from the VS Code webview and therefore follows the
browser's CORS rules. Confirm that apyguardApiScout.analyzedApiUrl points to the
running API, then allow only the required VS Code development origin in the API's
CORS configuration. Do not use an unrestricted allow-all CORS policy in production.
If changing API CORS is not appropriate, use Request Playground instead; it sends
requests through the extension host.
Python executable not found
The engine requires Python 3.9 or later. Set apyguardApiScout.pythonPath to a valid Python 3.9+ interpreter path.
Engine not found
If you are running from source and the extension cannot resolve the engine automatically, set:
{
  "apyguardApiScout.enginePath": "/absolute/path/to/core-engine"
}
Empty scan results
Common causes:
- the workspace is not a supported framework
- routes are declared dynamically
- the wrong folder is open
Run ApyGuard APIScout: Scan API Project first and inspect the raw inventory output before exporting.

