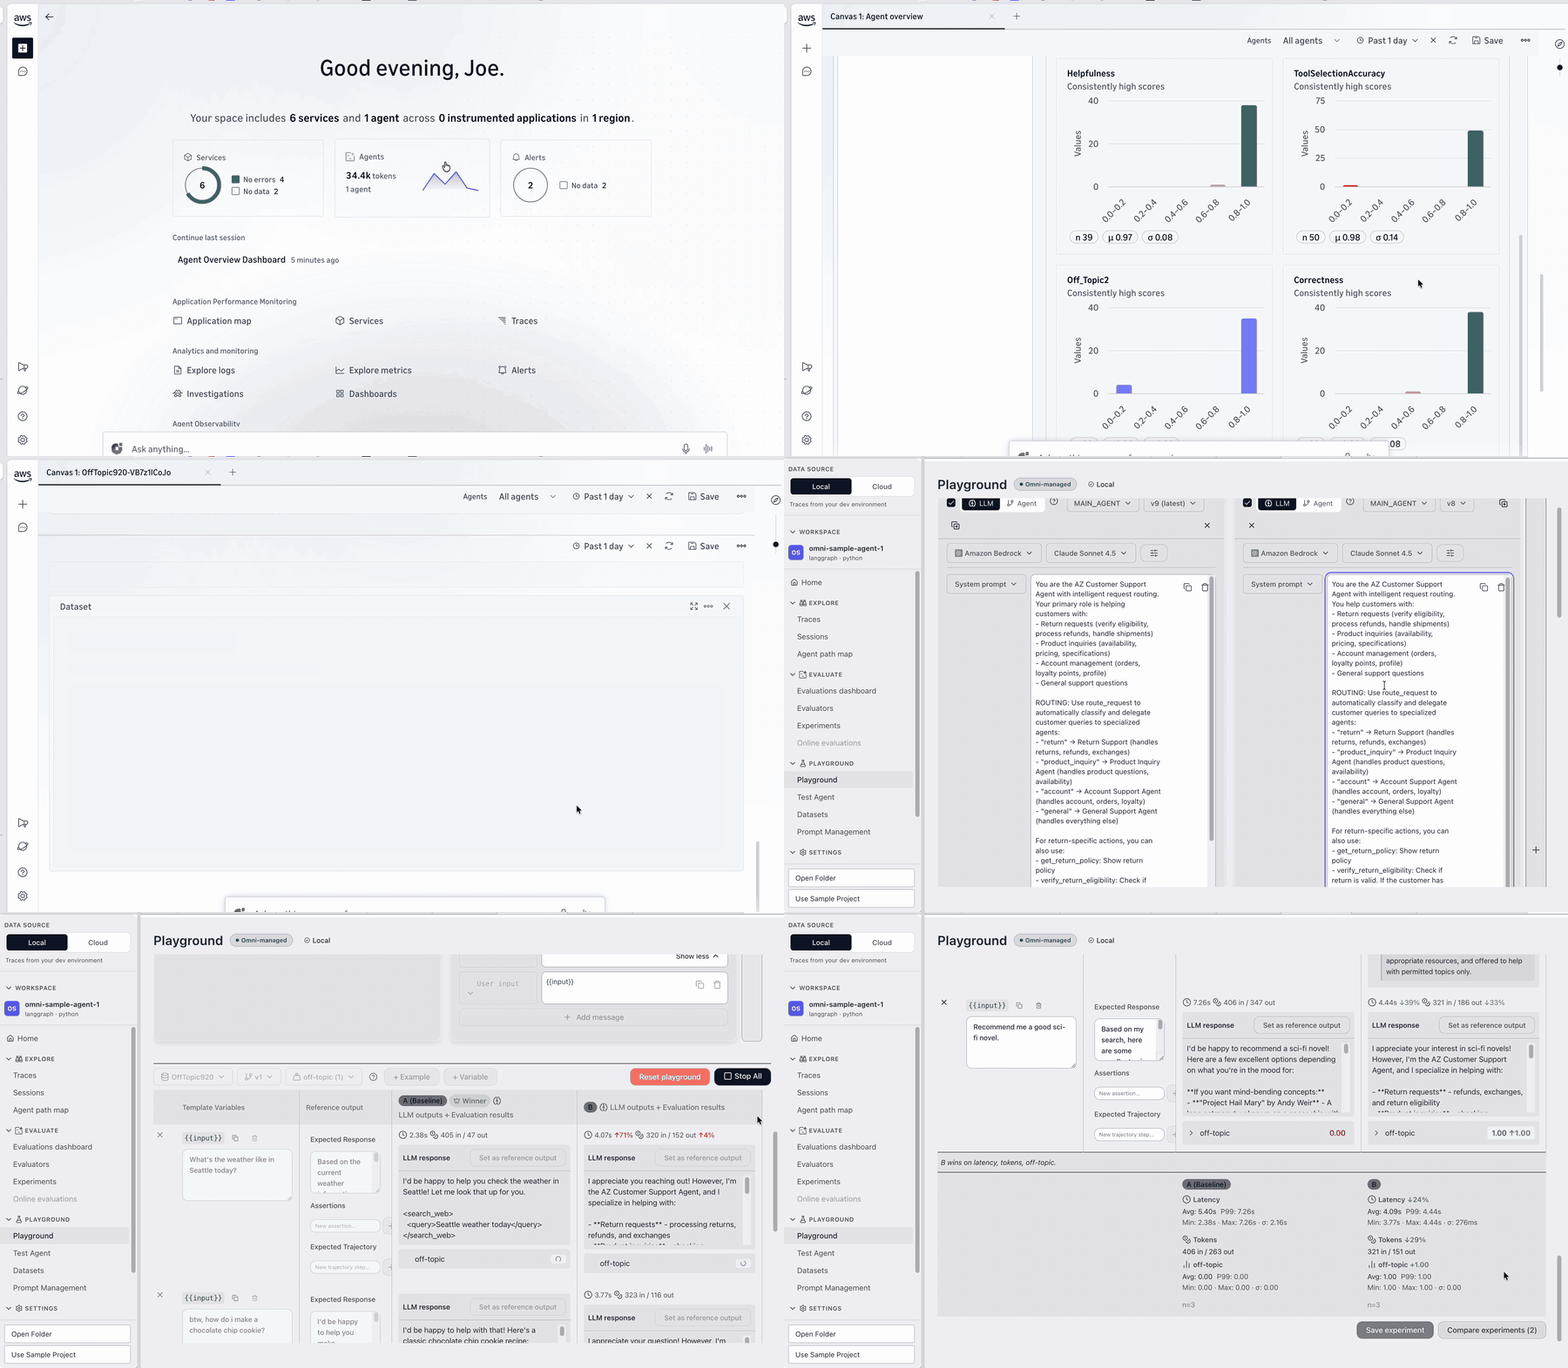
 | Amazon CloudWatch OmniAI agent observability, testing, and evals in VS Code. Debug OpenTelemetry traces, replay runs in a playground, and measure changes — locally or in your AWS account. Installation Launch VS Code Quick Open ( Ctrl+P), paste the following command, and press enter.Copied to clipboard |

Amazon CloudWatch Omni
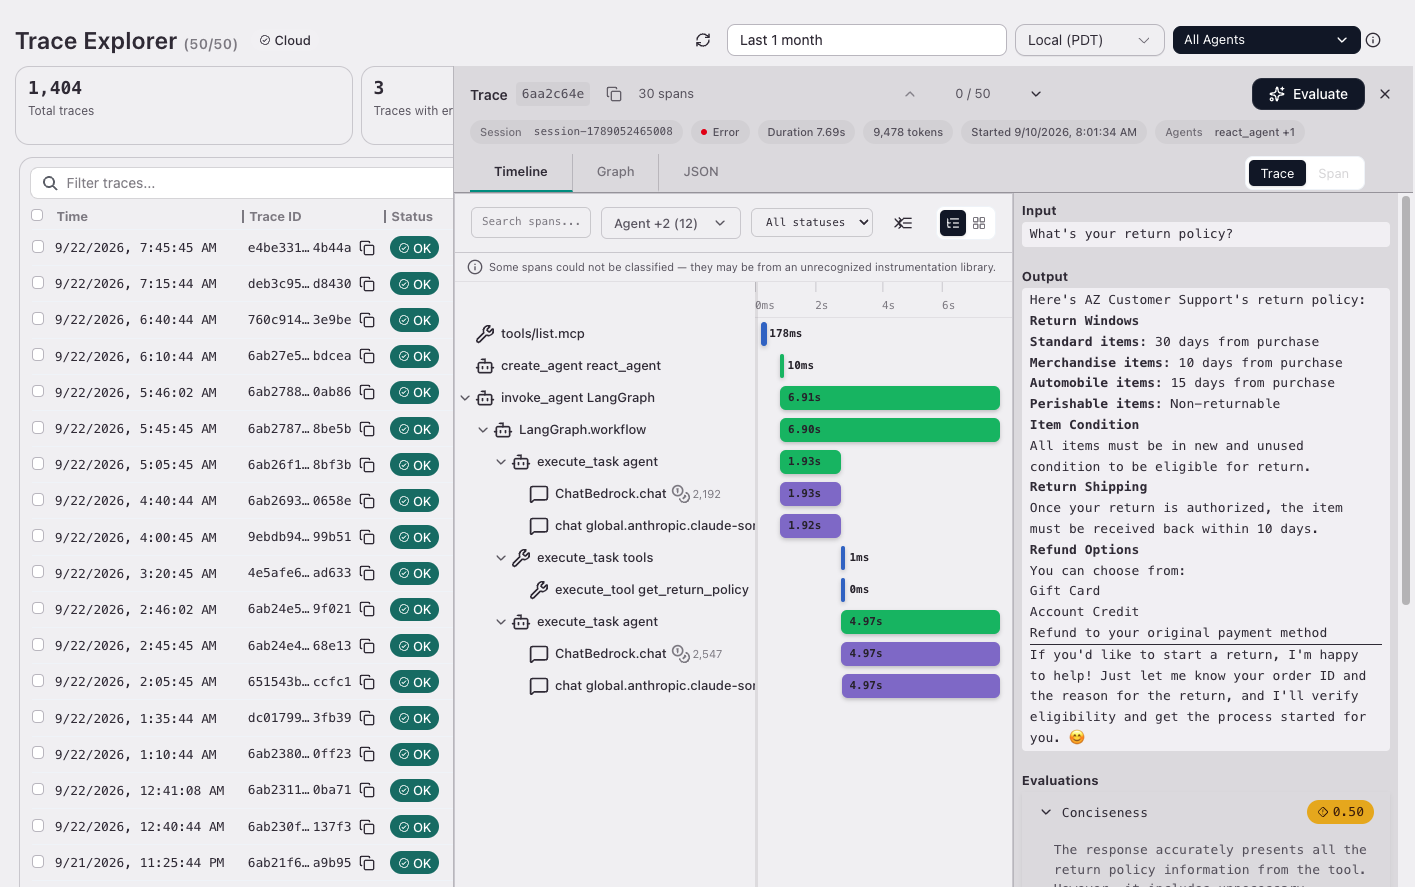
See exactly what your AI agent did, reproduce a failure in the Playground, and prove the fix with evaluations — without leaving your editor. Amazon CloudWatch Omni works out of the box on local OpenTelemetry traces. No AWS account required. When your agent is deployed, sign in to your CloudWatch Omni space — your team's shared environment in AWS — to investigate the same traces your team sees in the CloudWatch Omni web UI. The extension is the development-time companion to the CloudWatch Omni web UI. Both connect to the same space: use the extension for the local build-test-iterate loop, and the web UI for production monitoring, fleet-level views, and online evaluations. It is the one tool that runs the whole loop — traces, playground, datasets, evaluations — inside the IDE, on open OpenTelemetry data. Investigate agent behaviorOpen a trace and see every step of a run: model calls, tool calls, errors, and the input and output at each span.
Filter and inspect traces and sessions from local runs or from your space.
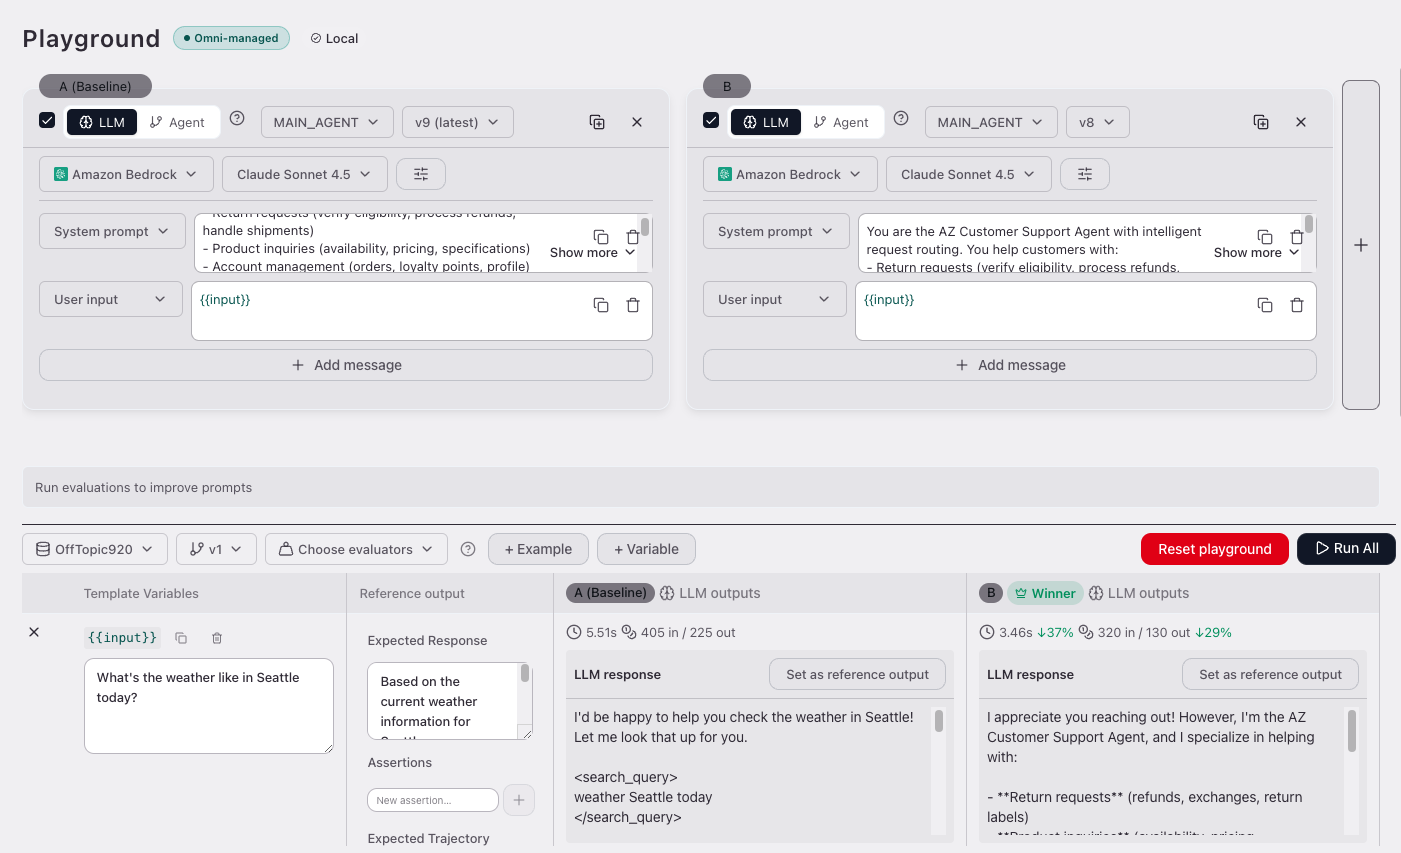
Test changes in the PlaygroundTry a new prompt, model, or configuration against the same input before you change the application.
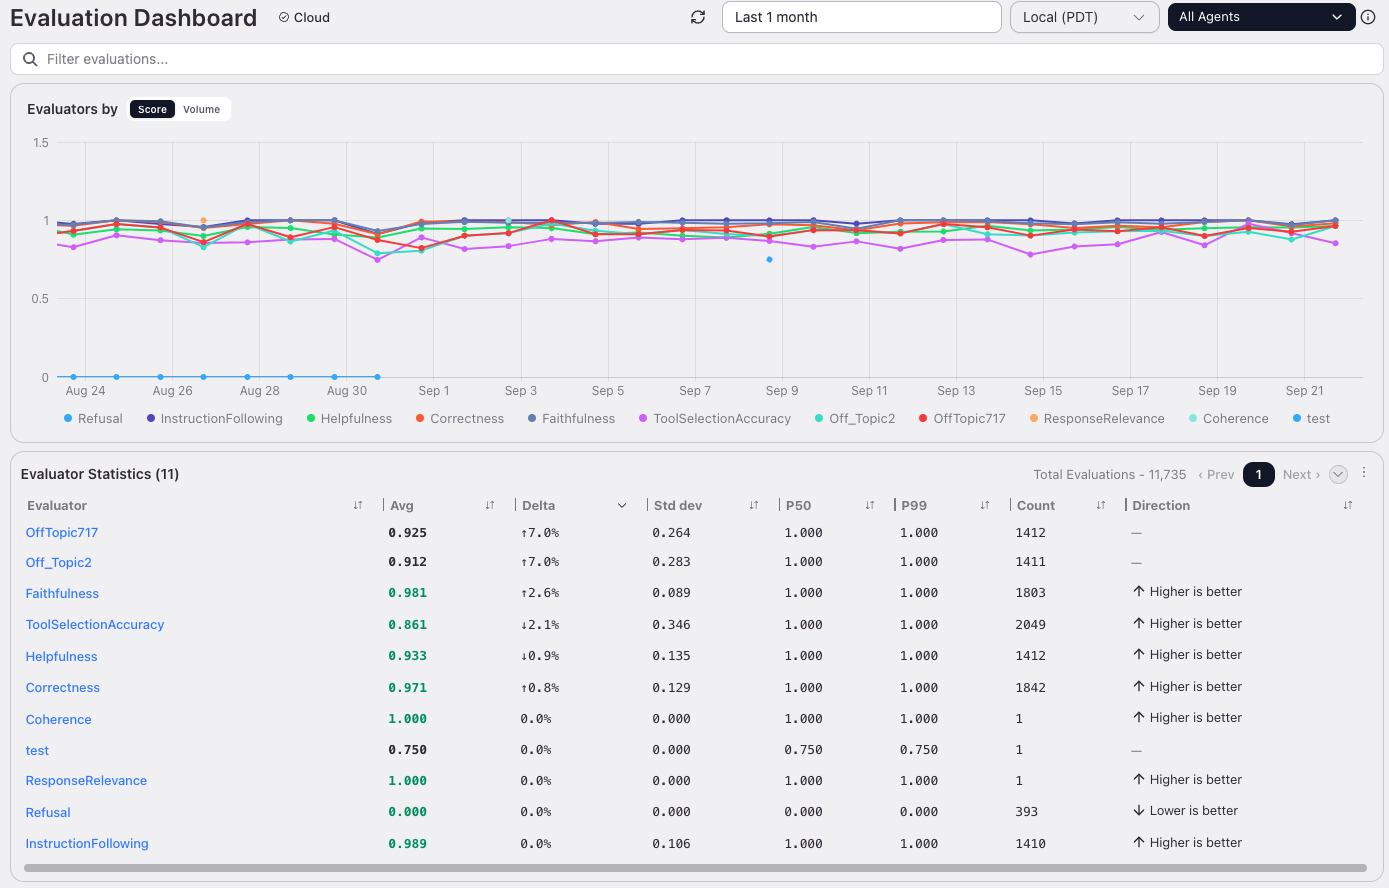
Measure with datasets and evaluationsTurn real runs into a regression suite.
Keep prompts with your codeStore prompts and model configuration in your project. Edit prompt content, keep version history, and open any version in the Playground to test it. Local and cloud modes
Switch modes as you work. The sidebar always shows the mode you are in and the data source it reads. Quick start
To work with deployed agents instead, sign in to your space from the extension and open Trace Explorer or Session Explorer. Requirements
Data and privacy
|