Apex Doctor
Diagnose Salesforce Apex debug logs in seconds. AI root-cause analysis, live log streaming, performance insights, trace-flag setup, and one-click navigation to Apex source — all inside VS Code.
✨ What it does
Paste any Salesforce Apex debug log into VS Code, right-click, and get an instant, structured breakdown:
- 📜 Execution-path diff — when you compare two logs, see an event-by-event diff (additions / removals / changed) so you can spot which branches ran differently, not just the summary deltas.
- 🧪 Anonymous Apex playground — write Apex, click "Run with Apex Doctor" in the status bar; the extension executes it via
sf apex run, fetches the resulting log, and analyses it in one click.
- 🔎 SOQL Query Plan — every SOQL row has a "Plan" button. One click runs Salesforce's Query Plan tool, surfaces selectivity, and warns about full table scans.
- 🧪 Test coverage overlay — when a
.cls is open, see covered / uncovered lines directly in the gutter, with a status-bar % for the class.
- 💬 Ask the Log (natural language) — "show me SOQL that returned > 500 rows", "methods after the exception", "debugs from AccountHandler". LLM picks the right array; we hydrate the matched rows locally so nothing is fabricated.
- 🔧 Suggest fix — one-click refactor with diff preview — for SOQL-in-loop, missing LIMIT, and more. Templated transforms when a pattern matches; AI fallback otherwise. Always preview-then-apply via VS Code's diff view.
- 🗺️ Order-of-Execution map — the canonical Salesforce save order reconstructed from your real transaction: which steps fired, in what order, and whether a workflow field update made the triggers re-fire.
- 🧵 User-journey stitching — one click in Salesforce produces several disconnected logs; Apex Doctor stitches them back into the single action the user performed, as a clickable strip.
- 🔥 CPU Profiler — self-time attribution, hot path, single-bottleneck callout. The first Apex tool that tells you where the CPU actually went, not just which method took longest.
- 🧠 Heap / memory profiler —
HEAP_ALLOCATE bytes attributed to the method that allocated them, biggest-allocator callout, and peak-heap-vs-limit pressure warnings. The memory twin of the CPU profiler.
- 🌊 Flow / Process Builder analysis — per-flow element timeline with timing, DB-bearing element markers, and "Flow element in loop" detection.
- 🛠️ Editor quick-fixes — lightbulb fixes right on your
.cls files for issues from the latest analysis (SOQL-in-loop → bulkify, etc.).
- 🩺 Activity-bar sidebar — a dedicated Apex Doctor icon with Current Analysis, Recent Logs, and Recurring Issues views.
- 🔁 Recurring patterns — "this NullPointerException has appeared 4 times this week". Cross-log analytics on your saved analyses.
- ⚡ Async tracer — stitches together parent and child logs for
@future / Queueable / Batch / Schedulable, so you can see the full async chain.
- 🪝 Trigger order visualiser — order of execution per sObject + DML phase, slowest-trigger callout, recursion detection.
- 🎚️ Debug-level recommendations — tells you to raise / lower specific categories based on what events actually appeared.
- 💡 Performance Insights — plain-English summary of where time went
- 🛑 Issues & errors — fatal errors, exceptions, SOQL-in-loop, governor-limit violations
- 🛠️ Inline diagnostics — issues become red squiggles directly in the log file (Problems pane integration)
- 🔗 Stack-trace parsing — exception frames render as clickable class links
- 📈 Activity Timeline — stacked area chart showing when SOQL / DML / methods / callouts ran
- 📊 Code units — every trigger, workflow, and execution entry point with timing
- 🐌 Slowest methods — top 50 methods ranked by duration, clickable to jump to source
- 🗃️ SOQL queries — every query, row count, and execution time, with per-table search
- ✏️ DML operations — inserts, updates, deletes with row counts
- 🐞 Debug statements — all
System.debug() output, filterable
- 📊 Parsed governor limits — colored progress bars (green <50%, amber 50–80%, red ≥80%)
- 🧪 Apex test results —
TEST_PASS / TEST_FAIL events surface as a dedicated panel
- 🎯 Trace Flag Manager — set up debug logs for any user from VS Code (no Setup-UI trip)
- 🔴 Live streaming — watch logs arrive from your org in real time
- 🔀 Compare two logs — side-by-side diff for before / after optimisations
- 🗂️ Recent analyses — last 10 analyses persisted per workspace, one click to reopen
- 🤖 AI root-cause + follow-up chat — OpenRouter, Anthropic, OpenAI, Google Gemini, or 🛡️ Salesforce Einstein (keeps all data inside your org's Trust Layer)
📜 Execution-path diff (line-level)
New in v0.8.0 — the Compare Two Logs view now shows an event-by-event diff of the two runs. Where the summary tells you "comparison is 34% faster", this tells you why:
  ▼ AccountTrigger on Account trigger event AfterUpdate    ← unchanged
  → AccountHandler.processAccounts()                       ← unchanged
+ → AccountHandler.bulkifyContractLookup()                 ← new in comparison
- SOQL: SELECT Id FROM Contract WHERE AccountId = :a.Id    ← removed (was in baseline)
  SOQL: SELECT Id FROM Contract WHERE AccountId IN :ids    ← unchanged
~ DML: Op:Update                              — Rows: 50 → 200
Backed by an LCS diff over a fingerprinted event stream — line numbers and record IDs are normalised so two runs match even when they touched different records. Renders inside the existing 📊 Log Comparison panel after the SOQL pattern table.
🧪 Anonymous Apex playground
New in v0.8.0 — write ad-hoc Apex inside VS Code and analyse the resulting log in one click:
- Run
Apex Doctor: Open Anonymous Apex Editor — opens a scratch .apex file with a starter snippet
- Edit the code
- Click ▶ Run with Apex Doctor in the status bar (or run
Apex Doctor: Run This Anonymous Apex)
- Apex Doctor saves the file → executes it via
sf apex run → polls the org for the new log → downloads it → analyses it — all in one progress dialog
Pair it with the Trace Flag Manager so the running user has logging enabled. Works as a quick perf-experiment loop without leaving VS Code or opening Developer Console.
🔎 SOQL Query Plan integration
New in v0.7.0 — every SOQL row in the Tables tab now has a 🔎 Plan button. One click and Apex Doctor runs the query through Salesforce's Query Plan tool (/services/data/vN/query/?explain=) and shows a dedicated panel:
- Verdict banner — 🟢 selective / 🟡 marginal / 🔴 full-table scan
- Leading plan — the one Salesforce will actually use, with relative cost, cardinality, fields used, and the indexed sObject
- Alternative plans — every plan Salesforce considered, sorted by cost
- Notes from Salesforce — e.g. "WHERE field is not selective", "no relevant index", etc.
Until now you had to manually paste each query into the Setup → Query Plan Tool. Apex Doctor already had every SOQL — running the plan automatically per query is one click.
You can also run an ad-hoc query at any time via Apex Doctor: Run SOQL Query Plan… from the Command Palette.
🧪 Test coverage overlay (gutter)
New in v0.7.0 — open any .cls or .trigger file and Apex Doctor renders the org's actual test coverage directly in the gutter:
- 🟢 Green — line is covered by at least one test class
- 🔴 Red — line is uncovered
- Status bar — shows the per-class coverage percentage (click to toggle the overlay)
Sourced from ApexCodeCoverageAggregate in your default org. Run Apex Doctor: Refresh Test Coverage once and the data is cached in workspace state — overlays apply automatically as you open files. Toggle visibility any time via Apex Doctor: Toggle Coverage Overlay or by clicking the status-bar item.
Unlike Salesforce's built-in coverage report, this is inline in the editor — exactly where you're writing the code.
💬 Ask the Log — natural-language query
New in v0.6.0 — type a question into the new input box at the top of the Overview tab and Apex Doctor returns the matching rows from the parsed log:
- "SOQL queries that returned more than 500 rows" → a filtered SOQL table
- "methods that ran after the exception was thrown" → a filtered methods table
- "all debug statements from AccountHandler" → a filtered debug list
- "errors with a NullPointerException" → a filtered issues list
How it works:
- Apex Doctor sends the question + a compact summary of the analysis to your configured LLM (OpenRouter / Anthropic / OpenAI / Gemini).
- The LLM responds with the matched indices into one of the analysis arrays (
soql, dml, methods, debugs, issues, code_units).
- We hydrate those indices locally — the LLM never returns row data, so it can't fabricate results.
- Anything ambiguous → no false matches; the result is just empty with a 1-line explanation.
🔧 Suggest fix — one-click refactor with diff preview
New in v0.6.0 — every issue card has a 🔧 Suggest fix button. Apex Doctor:
- Resolves the source
.cls file from the issue's class hint or stack trace
- Tries a templated transform first — deterministic, instant, no API call
- Falls back to the LLM for the long tail
- Opens a VS Code diff view comparing the original to the suggested rewrite
- Asks "Apply fix?" with explicit modal confirmation. Nothing auto-applies.
- SOQL-in-loop → bulkified — collects the loop variable's
.Id into a Set<Id>, runs a single query before the loop, replaces the inline query with a Map lookup. Conservative match: only fires when the WHERE clause references the loop variable directly.
- Large Query Result → adds LIMIT 200 — drops a
LIMIT 200 onto a SELECT that doesn't already have one.
AI fallback
For any issue without a matching template, Apex Doctor sends the full file + a 40-line window around the flagged line + the issue context to your configured LLM and asks for the rewritten file. The result still goes through the diff-preview-then-apply flow — you always see what's about to change.
🔥 CPU Profiler with hotspot attribution
New in v0.5.0 — the Profiler tab gives you what no other Apex tool does: self-time attribution.
Every existing Apex tool tells you a method took 1,200 ms total. Apex Doctor tells you why:
AccountHandler.processAccounts     → 1,200ms total | 45ms self
  ↳ ContractValidator.validate     → 890ms total   | 12ms self
      ↳ SOQL (Contract query)      → 878ms self   ← THIS IS THE BOTTLENECK
Self time = duration the method spent directly executing, excluding child calls. It's how Chrome DevTools attributes CPU for JavaScript; Apex Doctor is the first to bring it to Apex.
The profiler tab shows:
- Bottleneck callout — a single line surfaced at the top: the descendant with the highest self time, with click-through to the source.
- Hot path — the chain of methods from root → bottleneck, marked step by step.
- Hottest by self time — methods ranked by exclusive CPU work. The "real CPU hogs."
- Hottest by total time — methods ranked by inclusive CPU work. Useful for high-level orchestration hotspots.
- Each row shows call count, % of transaction, and a visual bar.
Set APEX_PROFILING to FINE or higher in your debug level for the profiler to have full timing data.
🔁 Recurring patterns — "this always breaks"
New in v0.5.0 — across the analyses you've already run, Apex Doctor now detects:
- 🔁 Issues that recur — "NullPointerException in
AccountHandler.processAccounts (line 42) — seen 5 times this week"
- 📈 Trends — "Average SOQL count: 12 → 18 → 31 over your last 10 logs"
- 🗃️ SOQL patterns — "This query has appeared in 6 of your last 10 logs"
Two surfaces:
- Banner on every analysis — top-3 recurring issues shown above the summary so you know immediately if you're hitting an old problem
- "Apex Doctor: Recurring Issues" tree view in the Explorer sidebar — full breakdown grouped by issue / SOQL / trends, color-coded by severity (info → warning → critical based on occurrence count)
No external storage — it mines the saved Recent Analyses workspace state. Window defaults to 7 days, threshold to 3 occurrences.
⚡ Async operation tracer
New in v0.5.0 — Apex async logs from @future, Queueable, Batch, and Schedulable jobs are usually disconnected. Apex Doctor now stitches them together.
For the current log:
- Detects async invocations from
ASYNC_OPERATION_TRIGGERED, FUTURE_METHOD_INVOCATION, QUEUEABLE_PENDING, and ENQUEUE_JOB events
- Identifies whether this very log is itself the body of an async job (Queueable / Batch / @future / Schedulable) — surfaced as an "Async entry" callout
Cross-log linking:
- Matches each parent invocation against your saved Recent Analyses
- Same class name + child started within 10 minutes of the parent → linked, with a confidence score
- See "This Queueable enqueued at line 45 completed in
07L... 2.3s later" without manually piecing it together
🪝 Trigger order visualiser
New in v0.5.0 — when multiple triggers fire on the same sObject, Apex Doctor shows the full execution order, grouped by DML phase.
Account · BeforeInsert (3 triggers)
  1. AccountTrigger          (45ms)
  2. AccountTeamTrigger      (12ms)
  3. TerritoryTrigger        (890ms)  ← slowest
- Groups by sObject + phase (
BeforeInsert, AfterUpdate, etc.)
- Highlights the slowest trigger in each phase
- Marks recursive triggers (same trigger appearing twice in one phase)
Salesforce devs spend a lot of time guessing trigger order — now you can just look.
🎚️ Debug-level recommendations
New in v0.5.0 — Apex Doctor compares your trace flag's debug levels against the events that actually appeared in the log:
- Raise — "DB is off but you have SOQL. Set DB to FINEST to see row counts."
- Lower — "APEX_CODE is at FINEST but only 3 of 8,000 events used it. Drop to FINE to reduce log size by ~60%."
- Covers
APEX_CODE, APEX_PROFILING, DB, CALLOUT, SYSTEM, WORKFLOW, VALIDATION, VISUALFORCE.
Saves you hunting through the Setup UI or guessing at debug-level names.
🎯 Trace Flag Manager
New in v0.4.0 — capture debug logs for any user in the org without leaving VS Code or visiting Salesforce Setup.
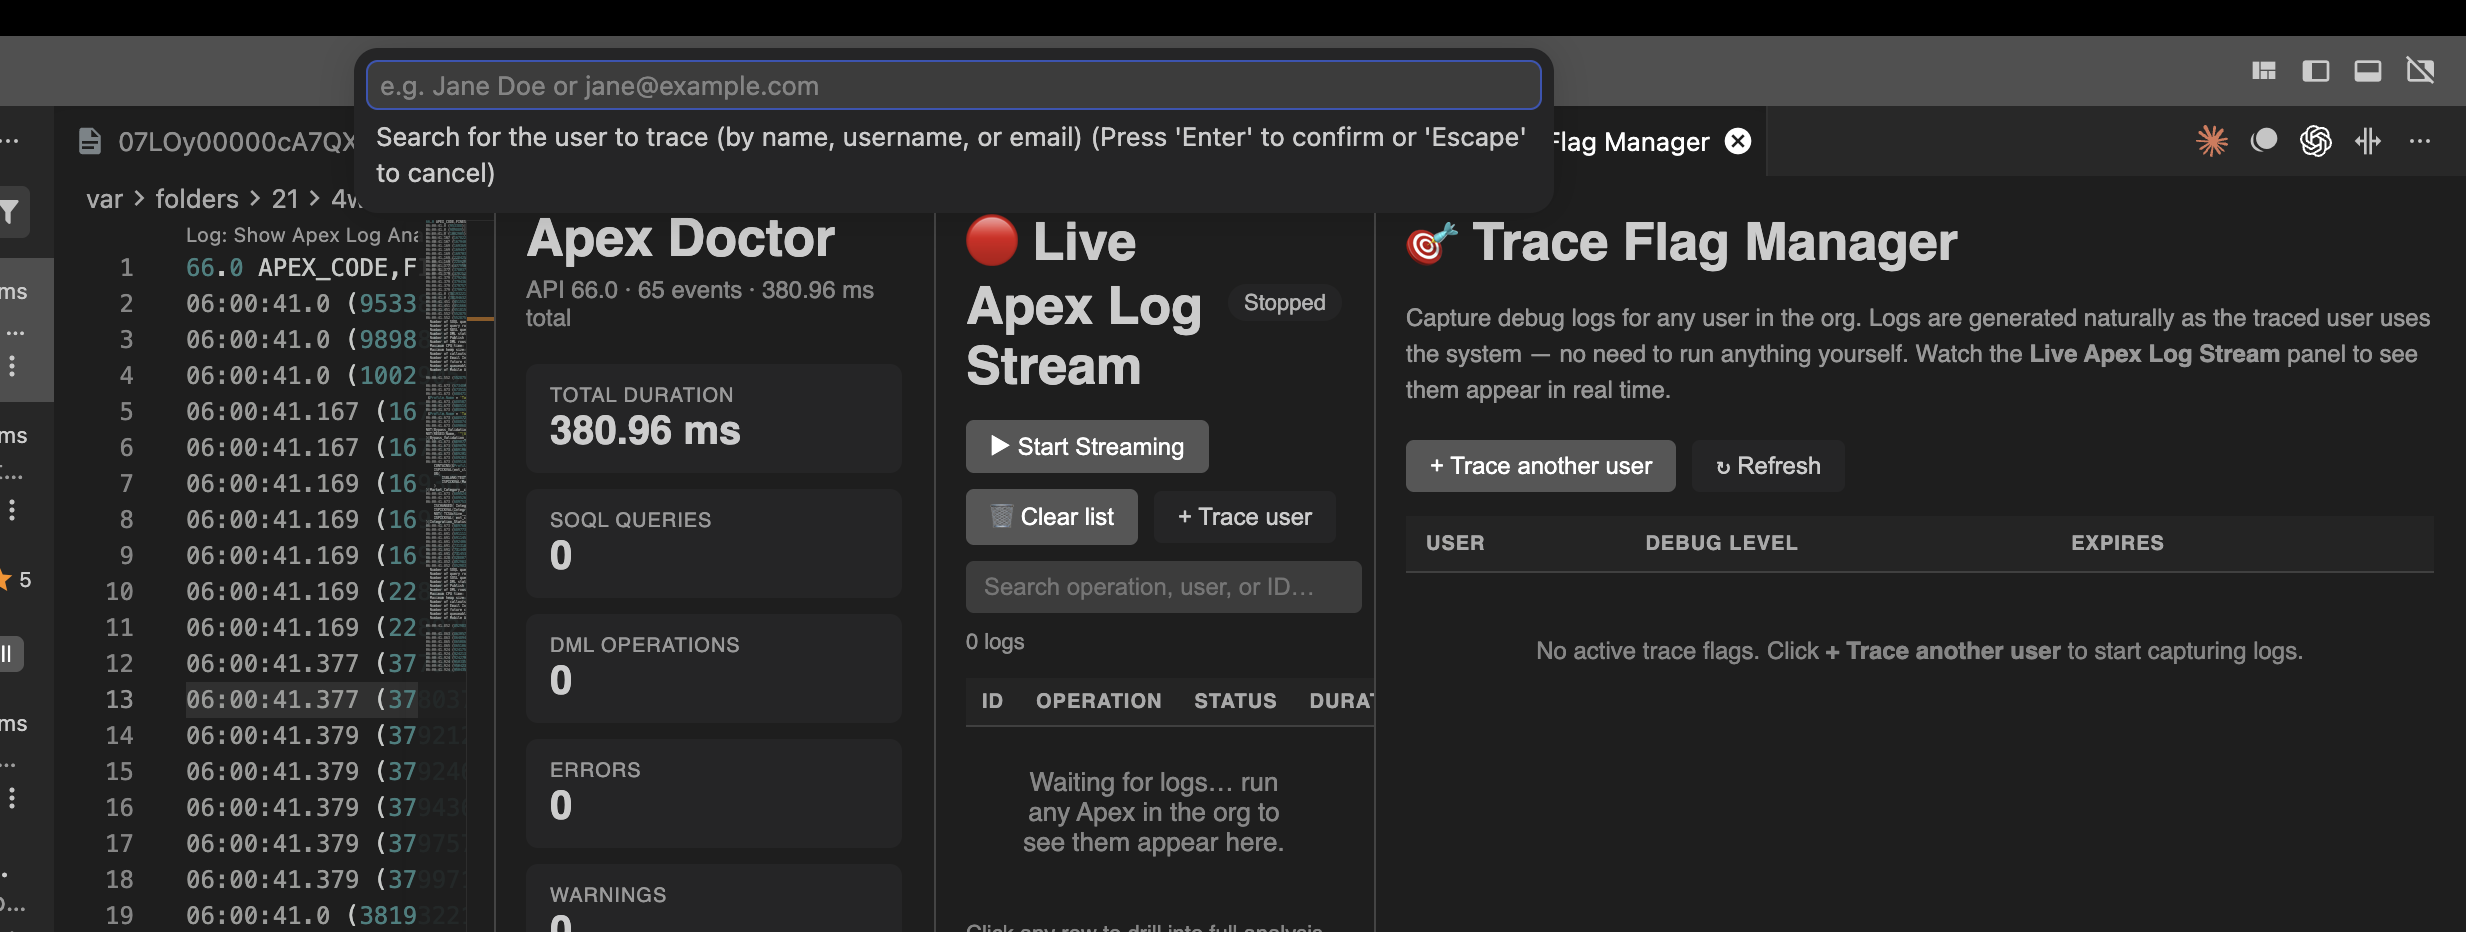
Run "Apex Doctor: Manage Trace Flags" from the Command Palette (or click + Trace user in the Live Stream panel) to:
- See every active
TraceFlag record (user, debug level, expiration)
- + Trace another user — search active users by name, username, or email; pick a debug level (
SFDC_DevConsole, your own custom levels, etc.); pick a duration up to 24 hours
- Extend or delete flags inline with one click
- Get smart conflict handling — if the user already has an active flag, Apex Doctor offers to extend it instead
Pair it with Live Apex Log Stream to watch the traced user's logs arrive in real time, then click any row for a full analysis. Backed by the Tooling API via the sf CLI — no extra setup needed beyond a logged-in default org.
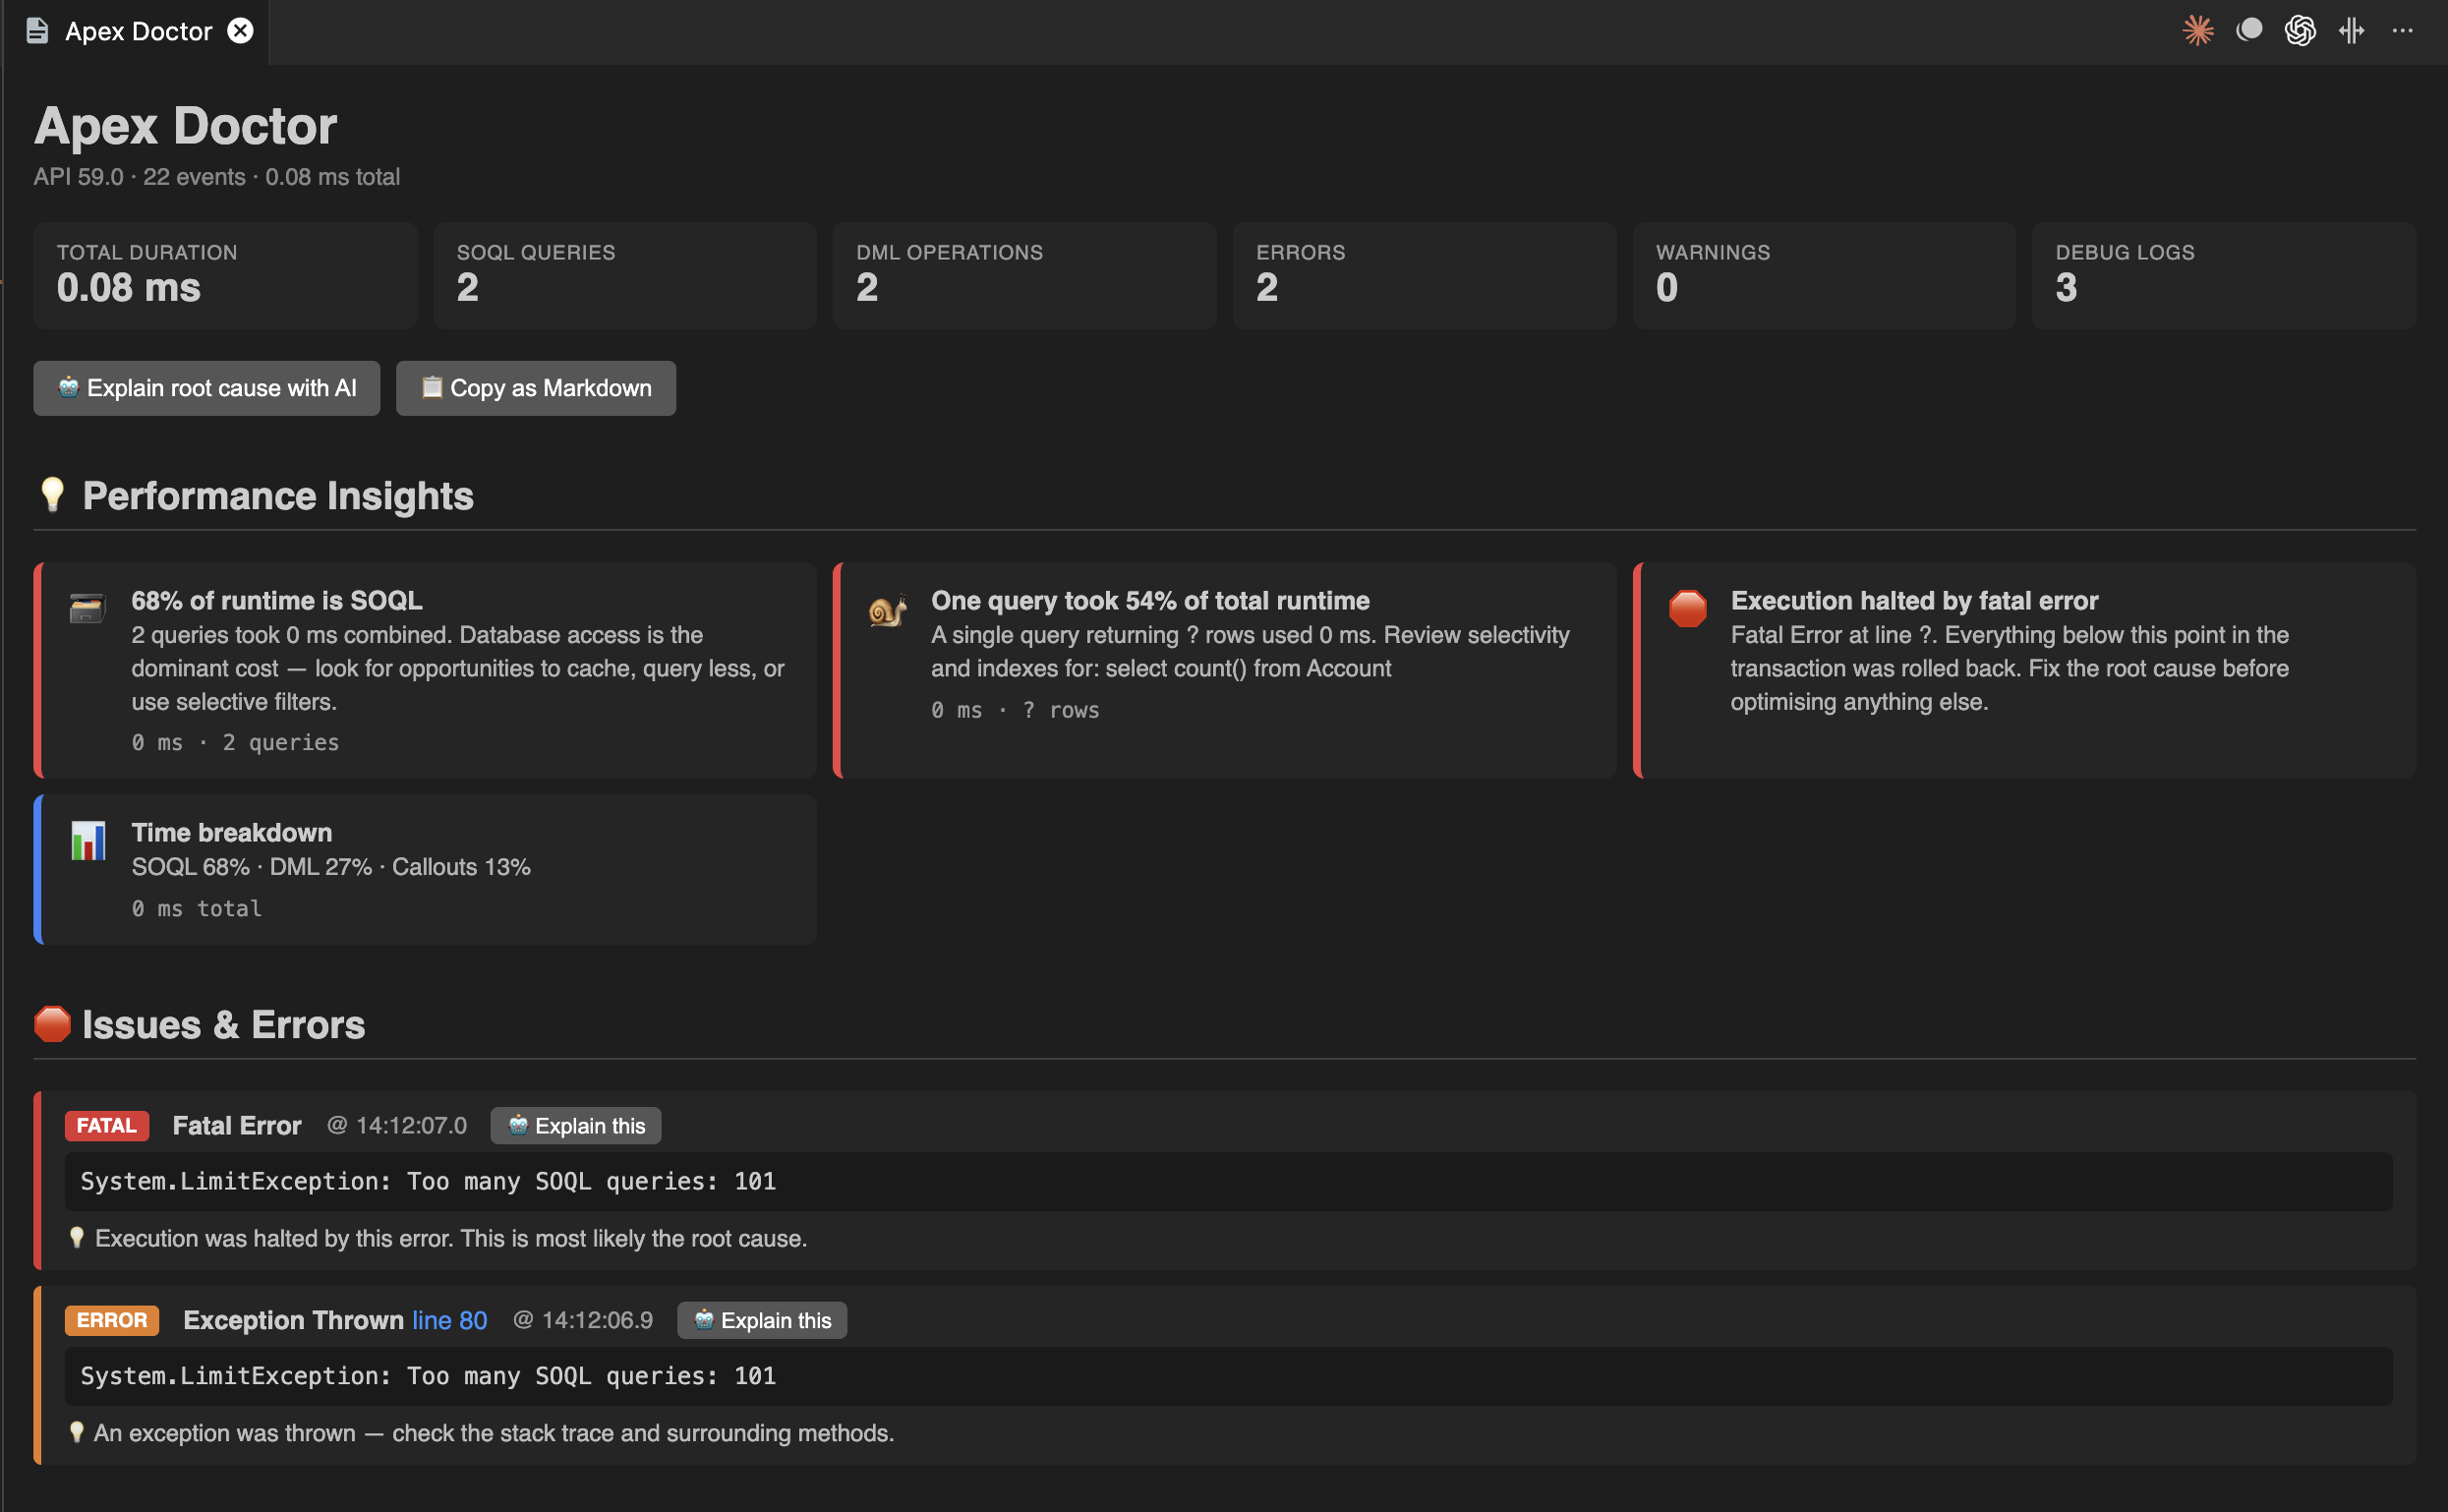
At the top of every analysis, plain-English insights highlight exactly where time went and what's wrong — followed by a structured list of every detected issue with severity and line numbers.
Examples:
- "🗃️ 62% of runtime is SOQL — 14 queries took 1,150 ms combined"
- "🔁 SOQL-in-loop detected — same query executed 8 times"
- "🐌 One query took 30% of total runtime — 4,562 rows"
- "🛑 Execution halted by fatal error — NullPointerException at line 230"
All deterministic rules — no API calls needed. Free, instant, on every analysis.
Inline diagnostics in the log file
Detected issues also appear as red squiggles in the open log file, with full integration into VS Code's Problems pane. Press F8 to step through them. Toggle via the apexDoctor.enableInlineDiagnostics setting.
Clickable stack traces
Fatal errors and exceptions are parsed into structured stack frames. Each frame is a clickable link that opens the relevant .cls file at the right line — even retrieving the class from the org if it's not in your workspace.
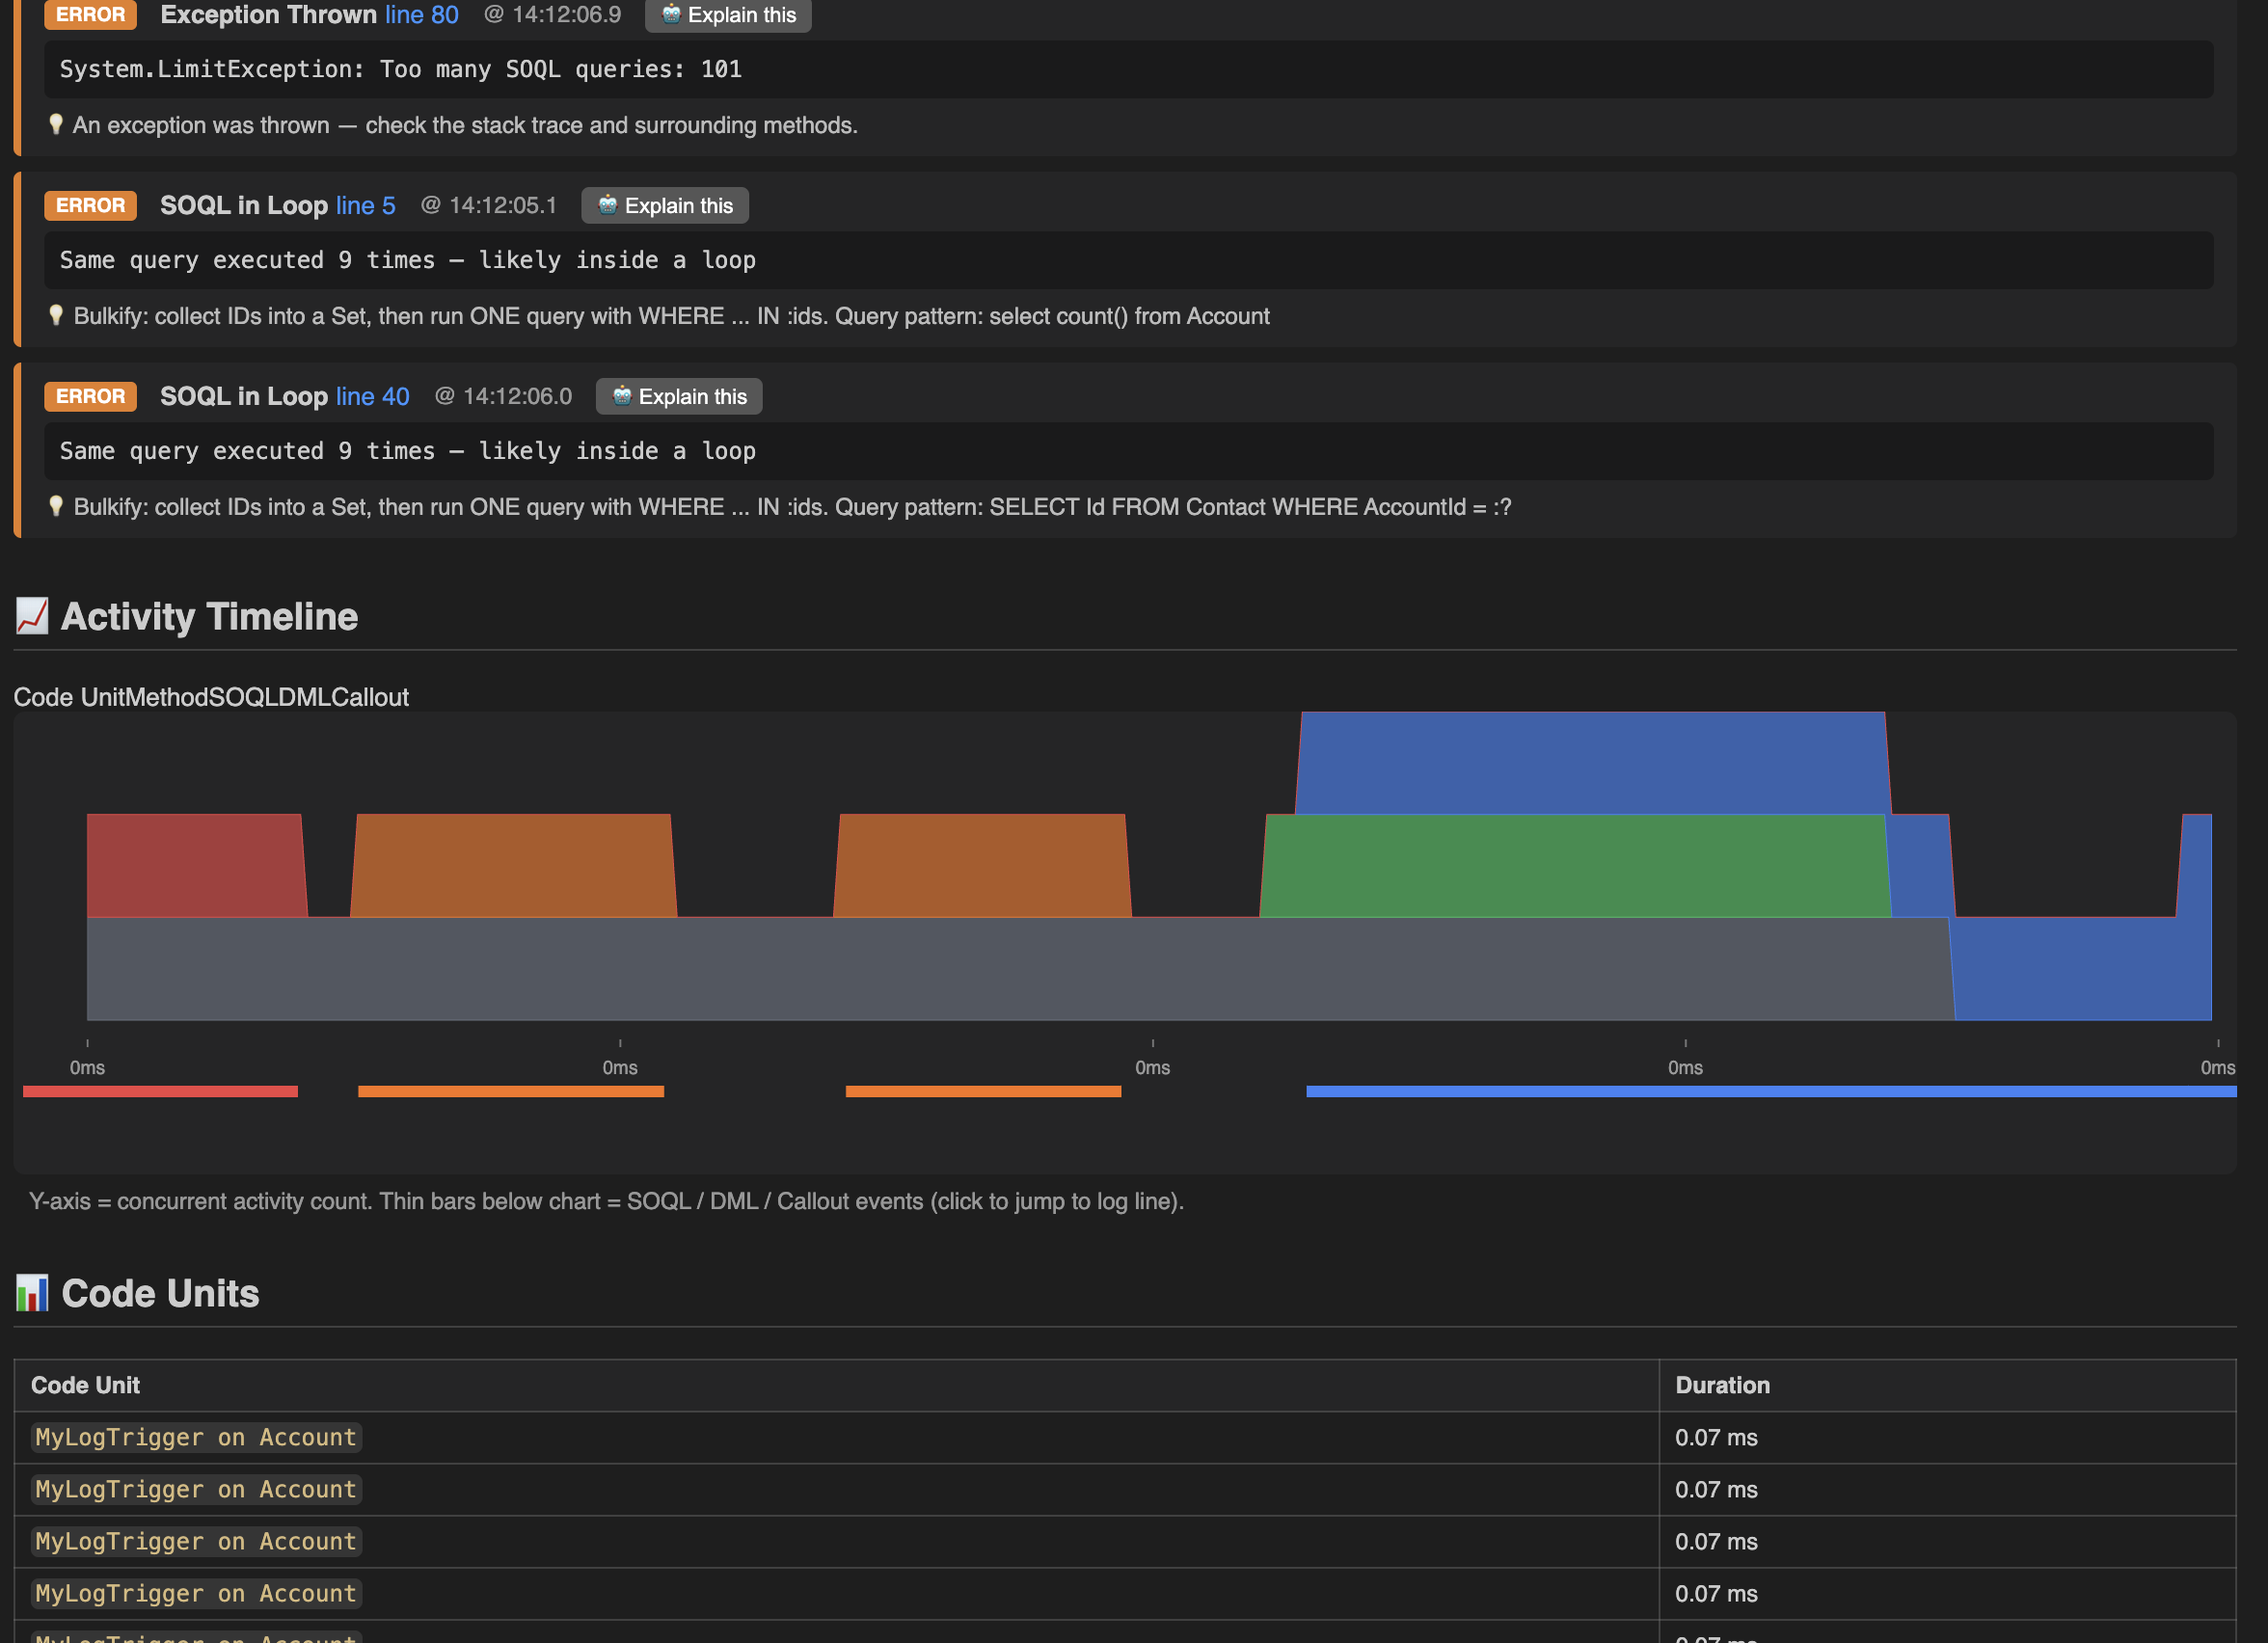
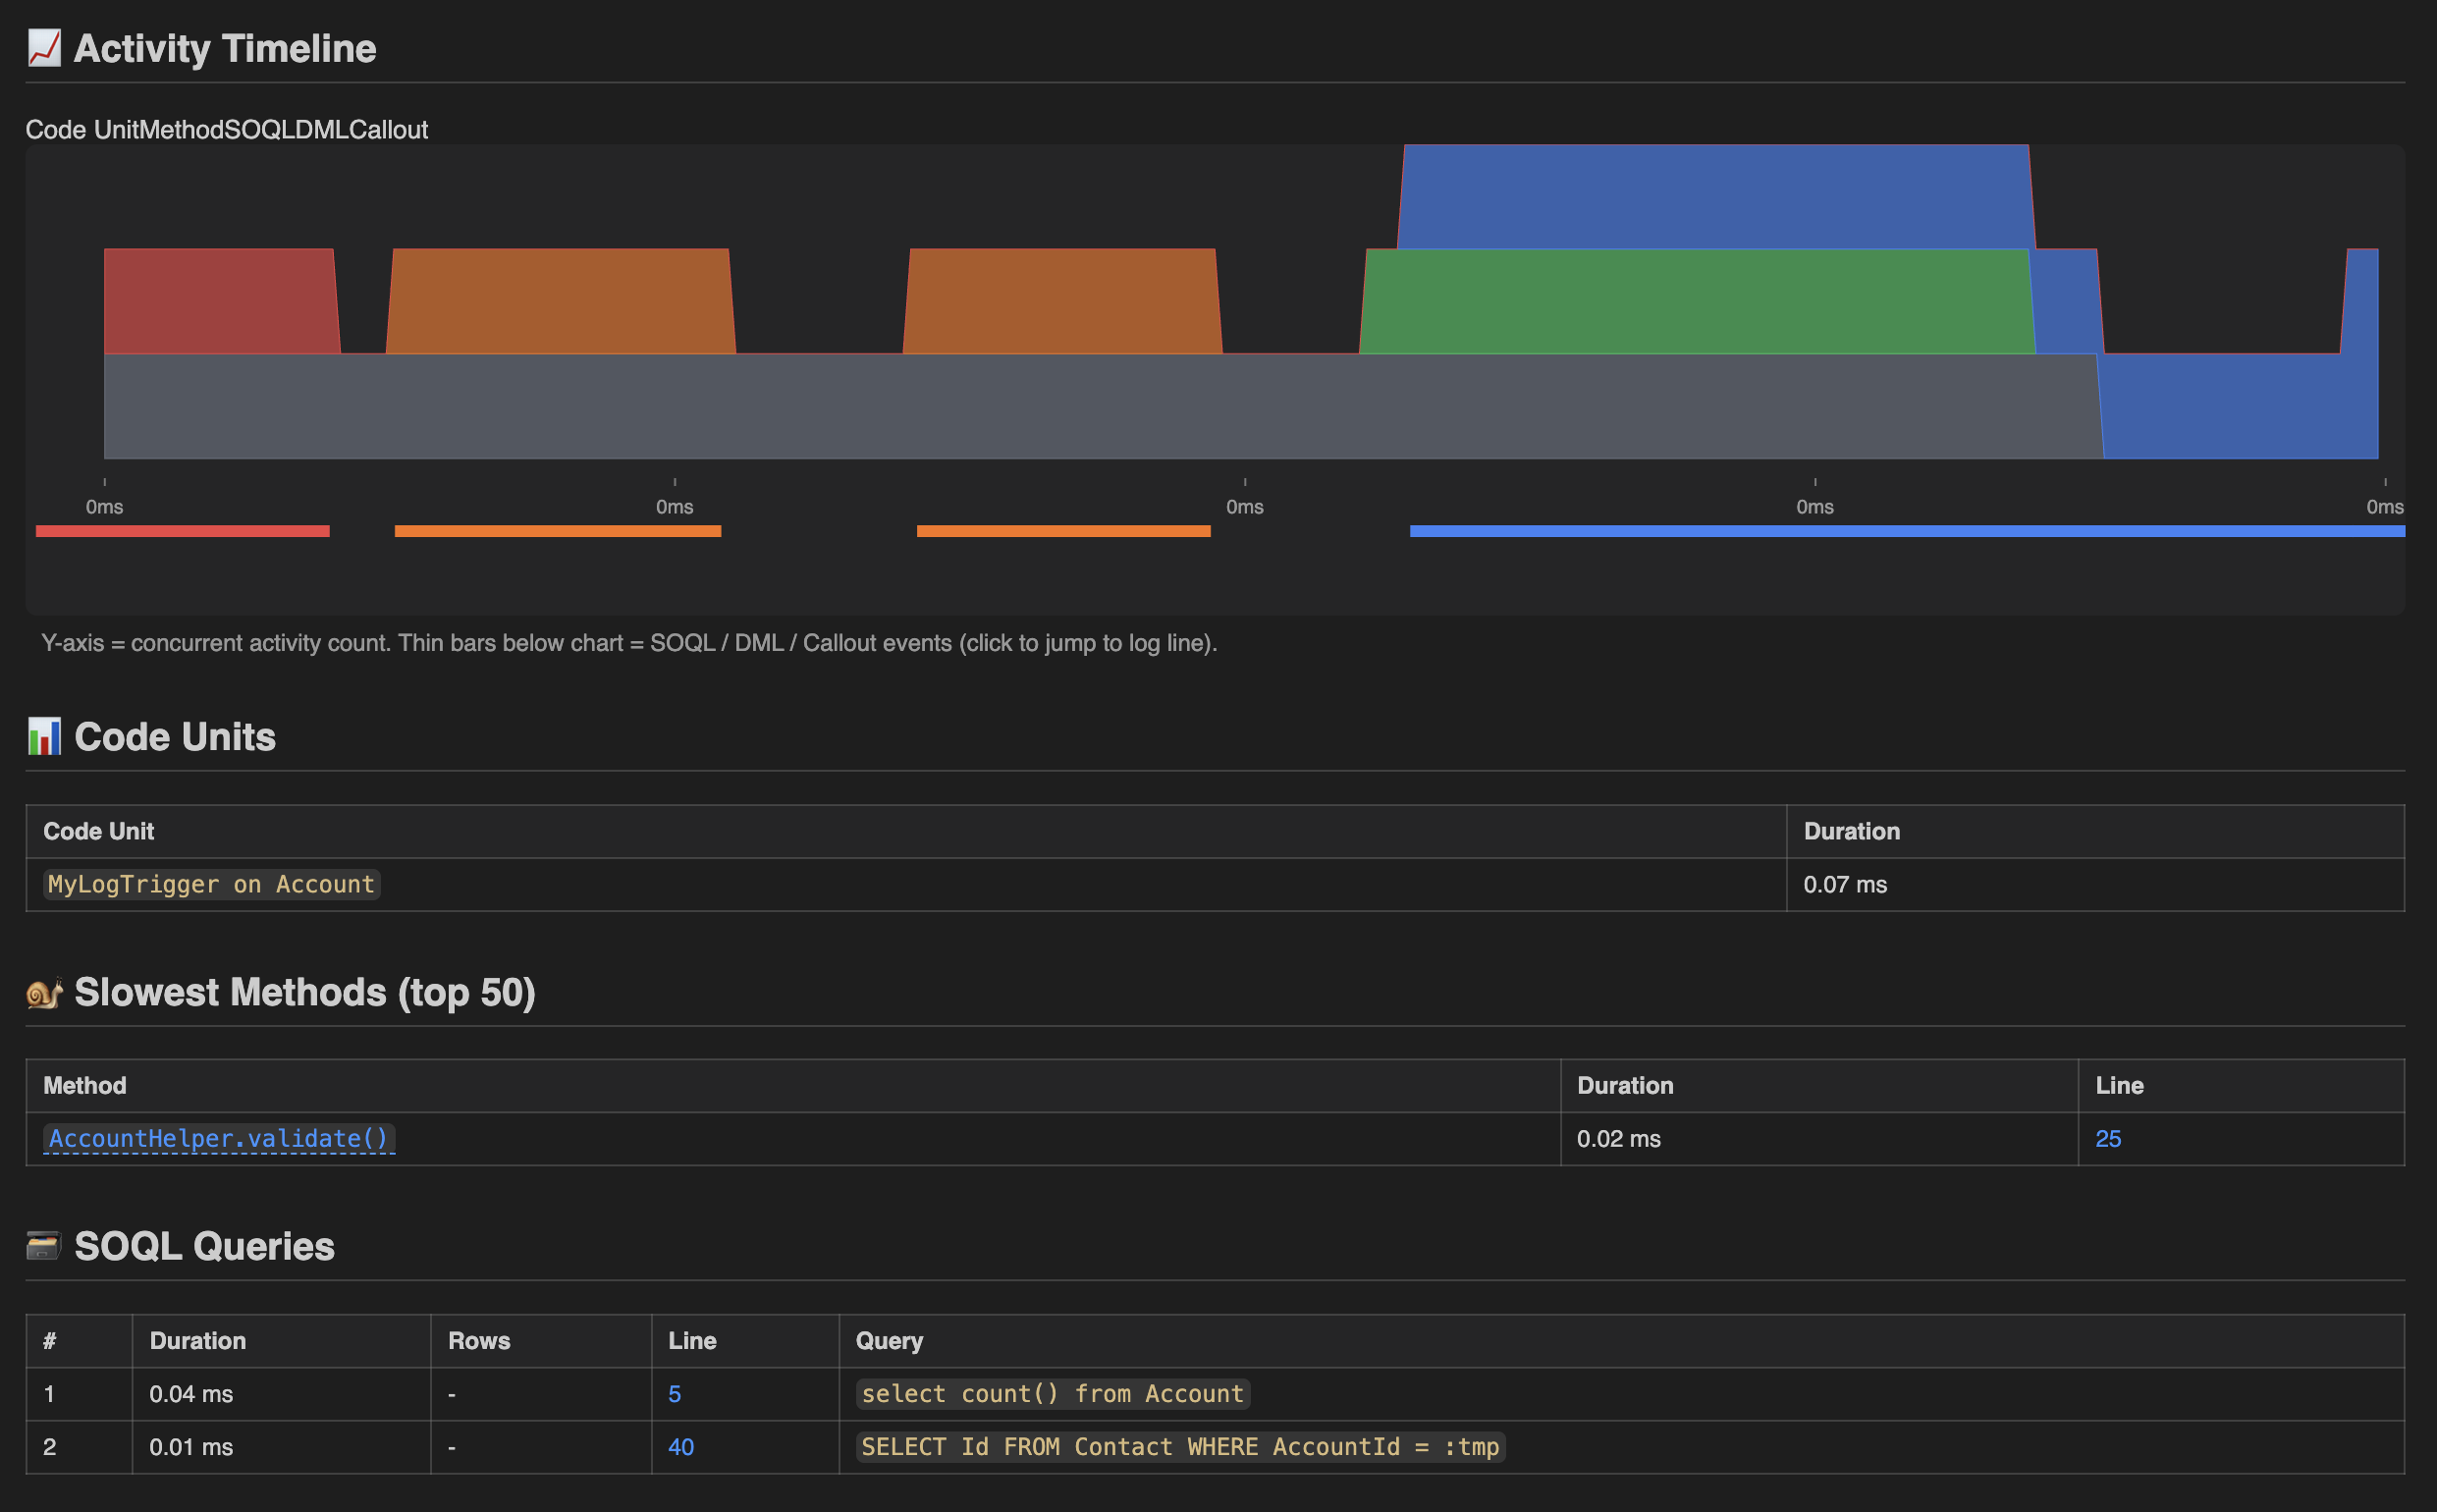
📈 Activity Timeline & Code Units
A stacked-area chart visualises exactly when SOQL, DML, methods, and callouts ran across the log — so you can spot bottlenecks at a glance. Below it, every code unit (trigger, workflow, execution entry point) is listed with timing.
🔗 Navigate directly to your Apex source
In the "Slowest Methods" table, method names like AccountHandler.processAccounts are clickable. Click once → opens AccountHandler.cls at the exact line number in the editor.
Works with any SFDX project — Apex Doctor reads sfdx-project.json and finds the class under your packageDirectories.
Class not in your workspace? No problem — you'll get a prompt offering to retrieve it from the org via sf project retrieve. Approve once, and the class is pulled down and opened automatically.
🗃️ Full data at a glance
Every SOQL query, DML operation, debug statement, and governor-limit snapshot — laid out in sortable tables with per-table search so nothing gets missed even on huge logs.
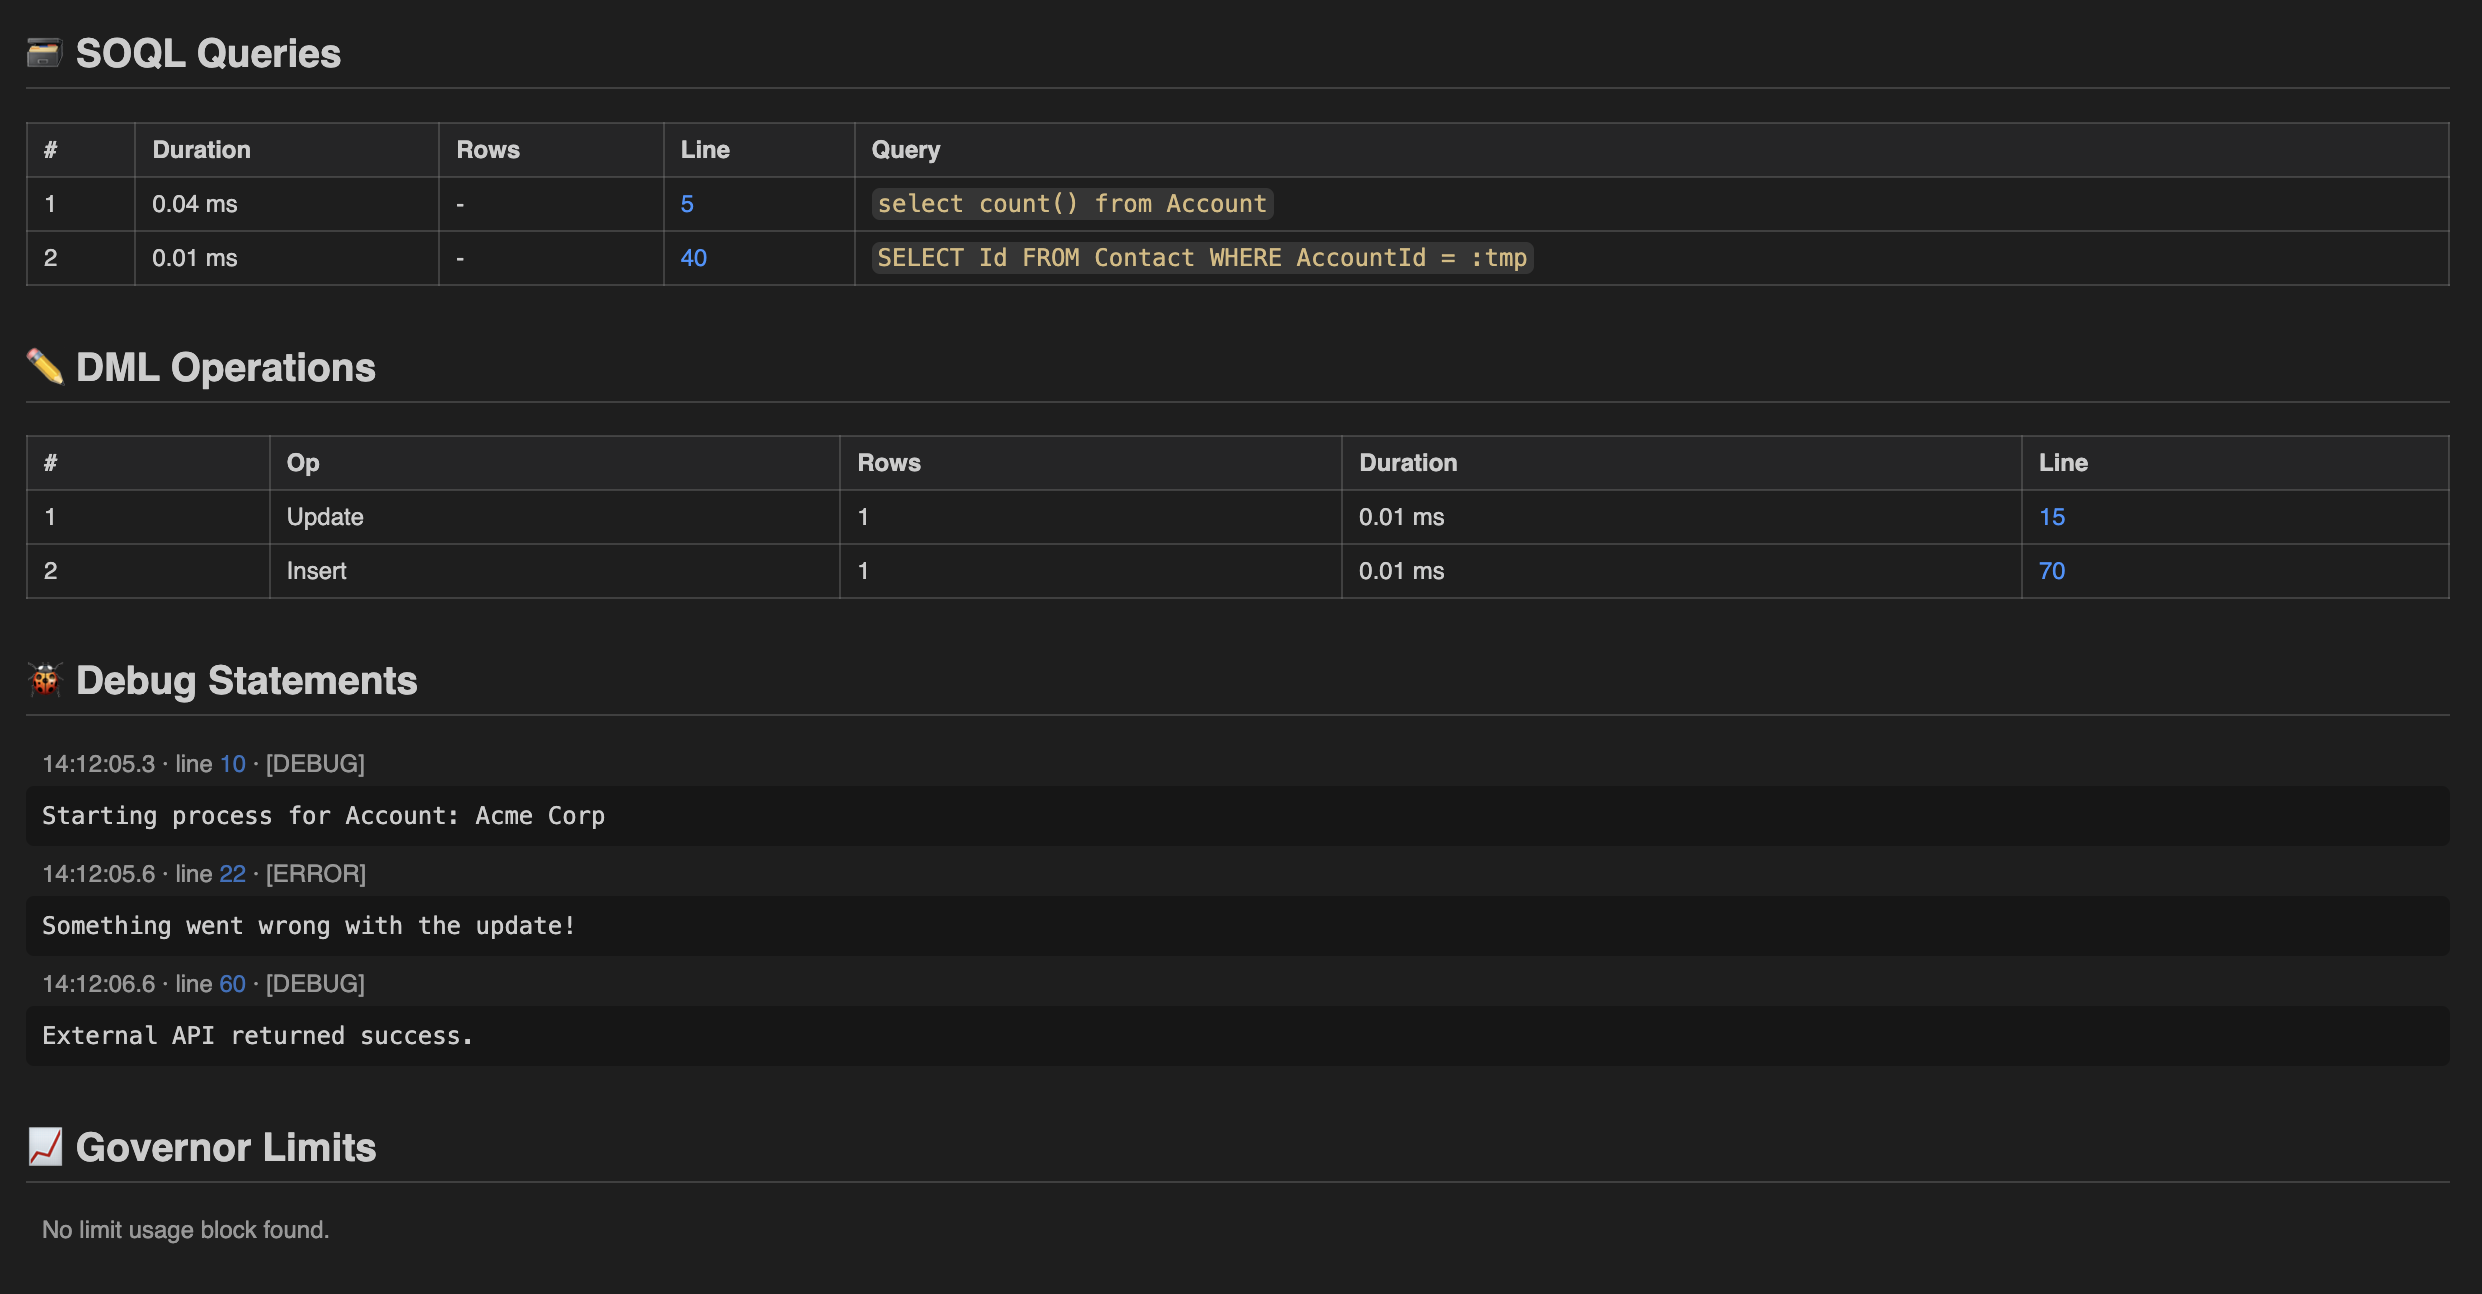
Parsed governor limits
LIMIT_USAGE_FOR_NS blocks are no longer dumped as raw text — every metric (SOQL, DML, CPU, heap, callouts, future calls, etc.) is parsed into a colored progress bar:
- 🟢 Green under 50%
- 🟡 Amber 50–80%
- 🔴 Red at or above 80%
You'll spot governor-limit pressure long before it actually exceeds.
🔴 Live Log Streaming
Debug in real time. Click the "⏺ Stream Apex Logs" button in the status bar (or run "Start Log Streaming" from the Command Palette) and a dedicated panel opens showing incoming logs as they happen.
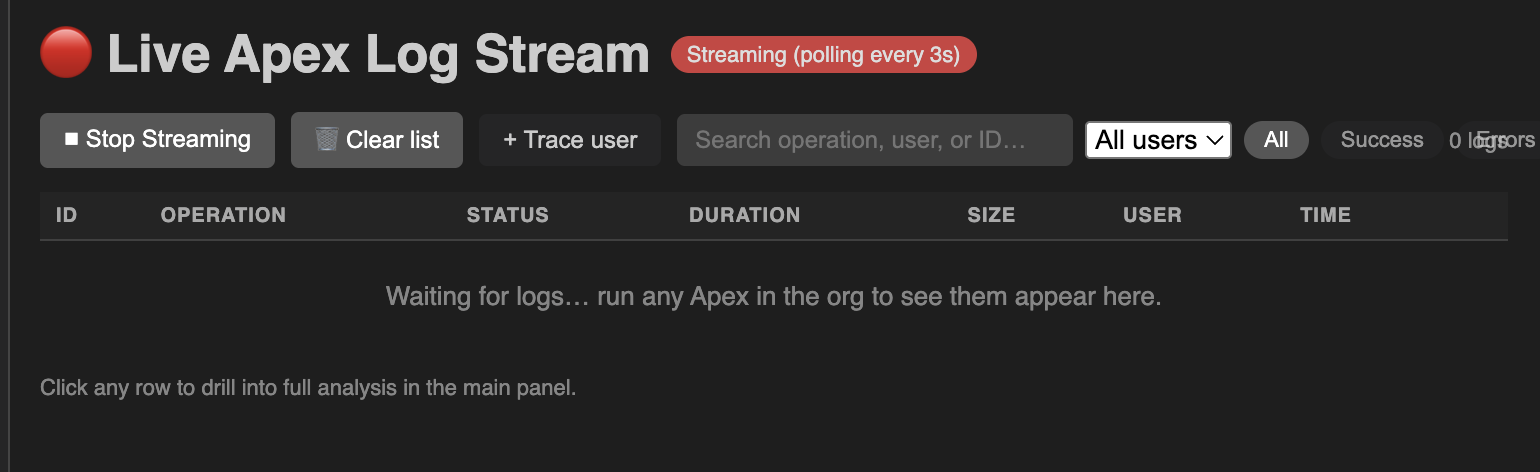
- Each new log appears in a table with operation, status, duration, size, user, and timestamp
- + Trace user button right in the panel — opens the Trace Flag Manager flow
- Search by operation, user, or ID; filter by status or specific user
- Click any row → full analysis of that log in the main panel
- Status bar shows a red "⏺ Streaming" indicator while active
- Polls every 3 seconds — typical latency between log completion and appearance is < 6 seconds
🤖 AI-assisted root-cause analysis & follow-up chat
One click and the AI explains exactly what went wrong, where it broke, and how to fix it — in plain English, with working Apex code suggestions.
The initial response is structured into four sections:
- Root Cause — what actually went wrong, in plain English
- Where it broke — the class, method, and line number
- Likely Fix — concrete recommendation with an Apex code snippet
- Prevention — practices to prevent this class of issue recurring
Then keep the conversation going. Ask follow-ups like "what if we made this query selective?" or "show me a bulkified version" — the AI keeps the analysis context loaded across turns. Conversation history persists across webview reloads.
Per-issue focus: click "Explain this" next to any detected issue to get focused analysis of just that problem.
Choose your AI provider
Apex Doctor supports five providers — pick one in settings (apexDoctor.provider):
| Provider |
Default model |
Free tier? |
Data leaves your org? |
| OpenRouter |
google/gemma-4-31b-it:free (free, auto-fallback to other free models) |
✅ Yes |
Yes — external |
| Anthropic Claude |
claude-sonnet-4-5 |
❌ Paid |
Yes — external |
| OpenAI ChatGPT |
gpt-4o-mini |
❌ Paid |
Yes — external |
| Google Gemini |
gemini-3.5-flash |
✅ Yes |
Yes — external |
| 🛡️ Salesforce Einstein |
sfdc_ai__DefaultGPT4OmniMini |
Uses your org's allocation |
No — stays in the Trust Layer |
API keys are stored in VS Code's encrypted SecretStorage — never written to disk in plaintext. Regardless of provider, Apex Doctor only ever sends a distilled summary of the log (issues, top SOQL, slowest methods, governor metrics), never the raw log.
🛡️ Salesforce Einstein — keep data in the Trust Layer
New in v0.12.0 — for teams whose security policy forbids sending org data to external AI, Apex Doctor can route every AI feature (root-cause, follow-up chat, Ask the Log, Suggest Fix) through your org's own Einstein Models API. The prompt stays inside the Einstein Trust Layer — zero data retention, PII masking, and no third-party model training — and uses your org's existing LLM allocation instead of an external API key.
One-time setup
- Create an External Client App in your org (Setup → App Manager / External Client Apps) with OAuth enabled and the
sfap_api scope (plus api, refresh_token). Enable the client-credentials flow and assign a run-as user. Copy the consumer key and consumer secret.
- In VS Code settings:
apexDoctor.provider → einsteinapexDoctor.einsteinDomain → your My Domain host, e.g. mycompany.my.salesforce.com (no https://)apexDoctor.einsteinConsumerKey → the app's consumer key- (optional)
apexDoctor.model → any sfdc_ai__* model your org exposes
- Run "Apex Doctor: Set LLM API Key" and paste the consumer secret (stored encrypted).
That's it — the AI features now run through Einstein. Requires an org entitled for Einstein generative AI / Agentforce.
🧪 Apex test results
Logs from sf apex run test --json (or any test execution) automatically surface a 🧪 Test Results section above the issues view, with pass/fail pills, the assertion message for failures, and clickable links to the test class.
Failed tests also appear as Test Failed entries in the issues list, ready for AI explanation.
🗂️ Recent analyses
Apex Doctor remembers the last 10 analyses per workspace. Open the Explorer sidebar and look for the "Apex Doctor: Recent Logs" view — every prior analysis is one click away to reopen, complete with the issues, SOQL, methods, and AI conversation context restored.
Each entry shows total duration, SOQL count, and a red/yellow/green health icon based on whether errors / warnings were detected.
🔀 Compare Two Logs
Before and after an optimisation? Run "Compare Two Apex Logs" from the Command Palette, pick your baseline and your comparison log, and Apex Doctor renders a diff panel:
- Summary deltas (duration, SOQL, DML, errors) with % change
- Verdict banner — "Comparison is 34% faster" or "Comparison regressed — 2 new errors"
- Method performance table — total time per method (sum across all calls) with call count delta
- SOQL pattern changes grouped by normalised query
- New vs resolved issues
- One-click export of the comparison as Markdown for Jira / Slack
⚙️ Custom heuristics
Tune Apex Doctor's deterministic rules to your team's perf budget via VS Code settings:
| Setting |
Default |
Description |
apexDoctor.soqlInLoopThreshold |
5 |
Flag SOQL-in-loop when the same query repeats this many times |
apexDoctor.largeQueryThreshold |
1000 |
Flag a query as "large" when it returns this many rows |
apexDoctor.slowSoqlThresholdMs |
1000 |
Flag a SOQL query as "slow" above this duration |
apexDoctor.slowMethodThresholdMs |
0 |
Flag any method slower than this (set 0 to disable) |
apexDoctor.flagSoqlOnObjects |
[] |
List of sObjects (e.g. ["Account", "Opportunity"]) — warn whenever a query touches one |
apexDoctor.enableInlineDiagnostics |
true |
Show issues as red squiggles in the open log file |
apexDoctor.streamDebugLevel |
"" |
Optional --debug-level for sf apex tail log |
🚀 Getting started
Install from the VS Code Marketplace
Search for "Apex Doctor" in the Extensions panel (Cmd+Shift+X / Ctrl+Shift+X) and click Install.
Install from VSIX (latest pre-release)
Download the latest apex-doctor-*.vsix from the Releases page, then in VS Code:
- Open the Extensions panel (
Cmd+Shift+X)
- Click the
… menu (top-right) → Install from VSIX…
- Pick the downloaded file → reload when prompted
Install on Cursor / VSCodium / Gitpod (Open VSX)
If you're not on official VS Code, the same VSIX works — use the "Install from VSIX…" flow above.
Prerequisites
- Salesforce CLI (
sf) logged into a default org — install via npm install --global @salesforce/cli and authenticate with sf org login web. Required for log fetching, streaming, trace-flag management, and class retrieval.
- An LLM API key if you want AI explanations — set it via the "Apex Doctor: Set LLM API Key" command. Free options: OpenRouter, Google Gemini.
Quick start
- Open any
.log file containing Apex debug output → right-click → Analyse this Apex Log
- Or run "Fetch Log from Salesforce" to pick from your org's recent logs
- Or run "Manage Trace Flags" to set up debug logging for a teammate, then "Start Log Streaming" to watch logs arrive live
📋 Commands
All commands live under the Apex Doctor category in the Command Palette:
| Command |
What it does |
| Analyse this Apex Log |
Right-click on any open log file |
| Fetch Log from Salesforce |
Pick from the 20 most recent logs in your default org |
| Manage Trace Flags |
Open the Trace Flag Manager panel |
| Start / Stop Log Streaming |
Live tail of the org's Apex logs |
| Compare Two Apex Logs |
Side-by-side diff of two analyses |
| Export Analysis as Markdown |
Copy the current analysis to clipboard |
| Set / Clear LLM API Key |
Configure the AI provider |
| Clear Recent Analyses |
Wipe the saved history |
🔒 Privacy
- API keys live in VS Code's encrypted SecretStorage — never written to disk in plaintext.
- The AI is sent a distilled summary of your log (issue list, top SOQL, slowest methods, governor-limit metrics) — never the raw debug log. You control which provider it goes to.
- All deterministic rules (insights, SOQL-in-loop detection, governor-limit parsing) run entirely locally with no network calls.
🐛 Found a bug?
Open an issue at github.com/amanparate/apex-doctor/issues — please include the relevant snippet of the Apex log if you can.
📜 License
MIT — see LICENSE.
