⚡ CardanoVSC Debugger 🚀
✨ Features
CardanoVSC Debugger (vscode extension) is a lightweight yet powerful Visual Studio Code extension tailored for debugging Haskell and Plutus smart contracts. Whether you're developing for the Cardano blockchain or experimenting with Plutus scripts, this extension provides:
- 🔍 Seamless debugging support for
.hs (Haskell) files.
- showing
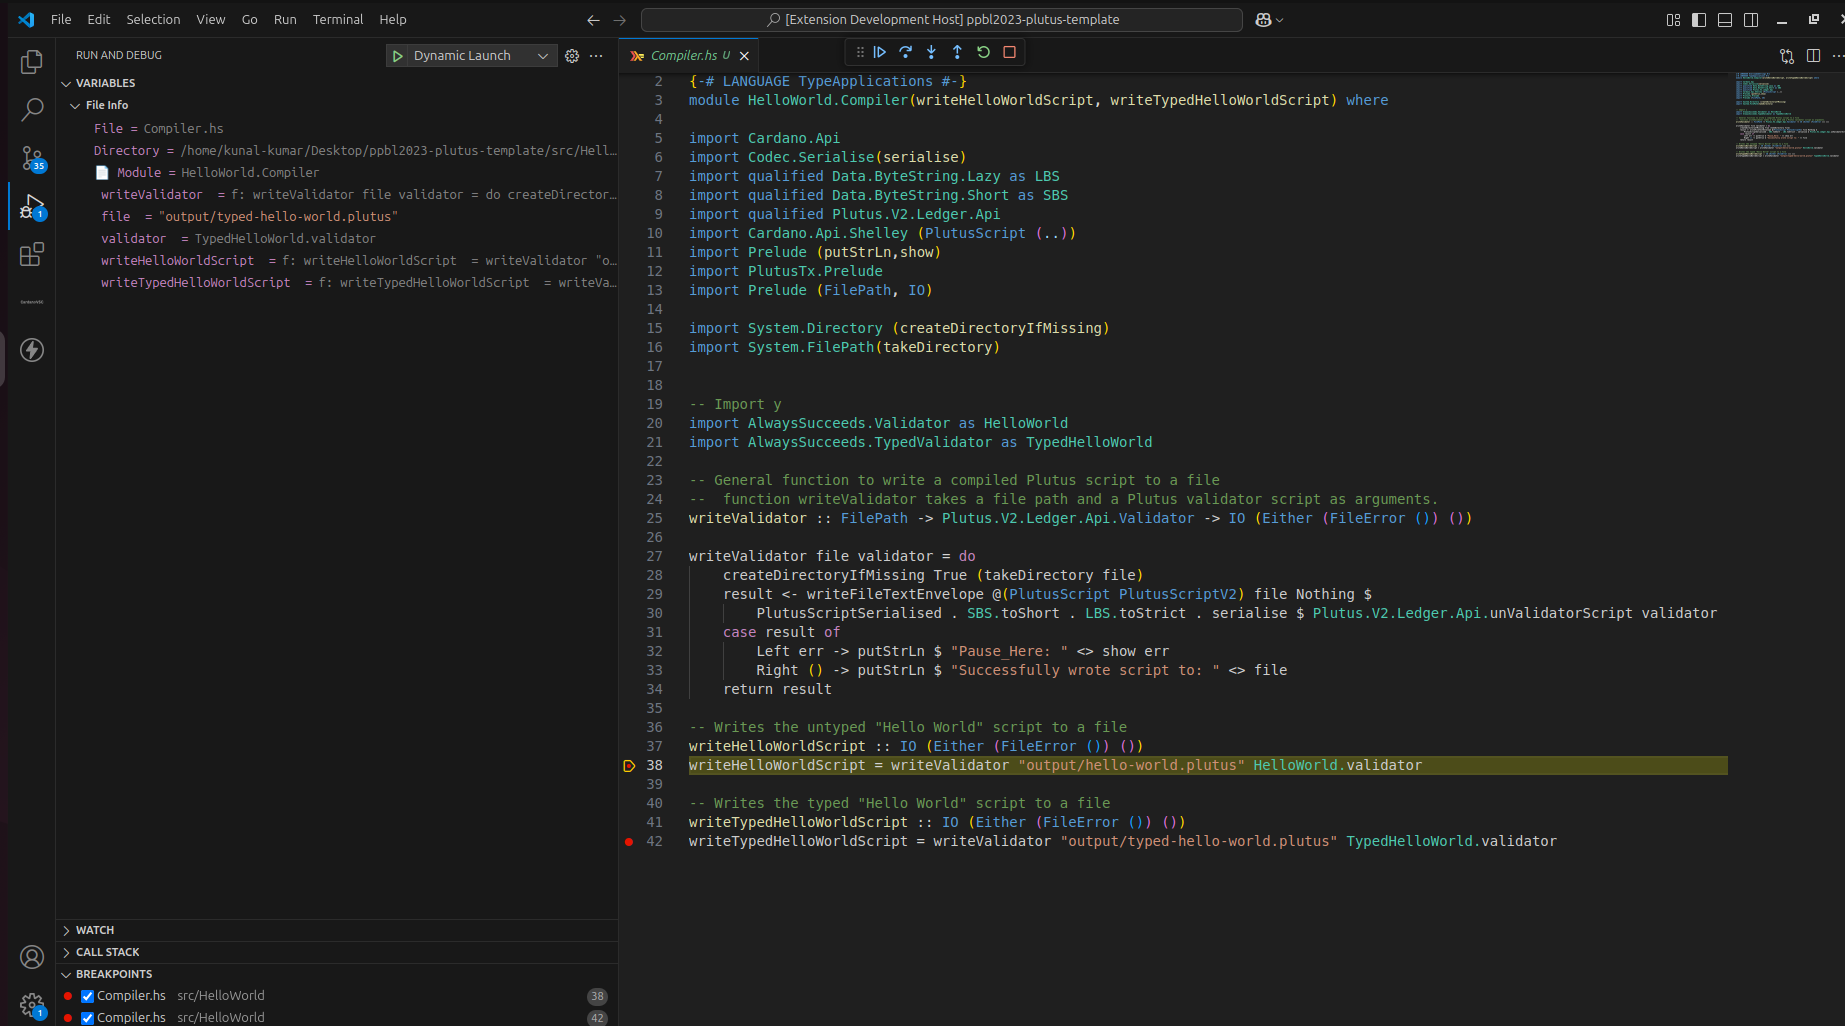
module_name , file_name , argument value , functions in debug variable section .
- 📂 Integrated with VS Code Debug Adapter Protocol.
- 🚀 Real-time error checking and suggestion
- and also register command to get latest utxo of script after locking transaction. that is
Get Latest UTXO Details
Perfect for developers working with Cardano’s Plutus smart contracts, CardanoVSC Debugger brings precision debugging right inside VS Code.
🚀 Getting Started
To start debugging Haskell or Plutus smart contracts with cardanovsc_debugger, follow the instructions below to set up your development environment and extension.
📥 Installation
- Clone the repository:
git clone https://github.com/AIQUANT-Tech/CardanoVSC.git
cd CardanoVSC/cardanovsc-debugger/
- Install dependencies:
npm install
- Debug the extension by clicking the VS Code debug icon.
OR, you can also do like this :
Go to the Visual Studio Marketplace.
Click Install or use the Extensions view in VS Code (Ctrl+Shift+X) and search for CardanoVSC Debugger.
Upon installation, a notification will prompt you to install the cardanovsc extension as it is a required dependency for cardanovsc_debugger.
Once installed, the extension will activate automatically when you open .hs files in vscode.
Upon installation, a notification will prompt you to install the cardanovsc extension as it is a required dependency for cardanovsc_debugger.
🏗️ Development
✅ Running Tests
To run tests:
npm run test
📂 FOLDER STRUCTURE
└── 📁cardanovsc_debugger
    └── 📁__mocks__
        └── vscode.js
    └── 📁.vscode
        └── extensions.json
        └── launch.json
        └── settings.json
        └── tasks.json
    └── 📁media
        └── cardanovscdebugger.png
        └── cardanovscdebugger.svg
    └── 📁scripts
    └── 📁src
        └── debugAdapter.ts
        └── diagnostics.ts
        └── extension.ts
        └── importData.ts
        └── 📁utils
            └── extractHaskellFunctions.ts
            └── webview.ts
        └── 📁test
            └── extension.test.ts
            └── diagnostic.test.ts
            └── debugAdapter.test.ts
    └── 📁test
        └── 📁app
            └── Main.hs
            └── CHANGELOG.md
            └── LICENSE
            └── test.cabal
    └── .gitignore
    └── .vscode-test.mjs
    └── .vscodeignore
    └── CHANGELOG.md
    └── eslint.config.mjs
    └── package-lock.json
    └── package.json
    └── README.md
    └── tsconfig.json
    └── jest.config.js
    └── vsc-extension-quickstart.md
🛠️ Usage
Installation
cabal
For Linux, macOS, FreeBSD or Windows Subsystem 2 for Linux, run this in a terminal:
curl --proto '=https' --tlsv1.2 -sSf https://get-ghcup.haskell.org | sh

ghcup tui
ghcid
$ cabal update
$ cabal install ghcid
Run
1. Create a project
Cabal project
$ mkdir project_name
$ cd project_name
$ cabal init
- Open a
.hs (Haskell) file in your VS Code workspace.
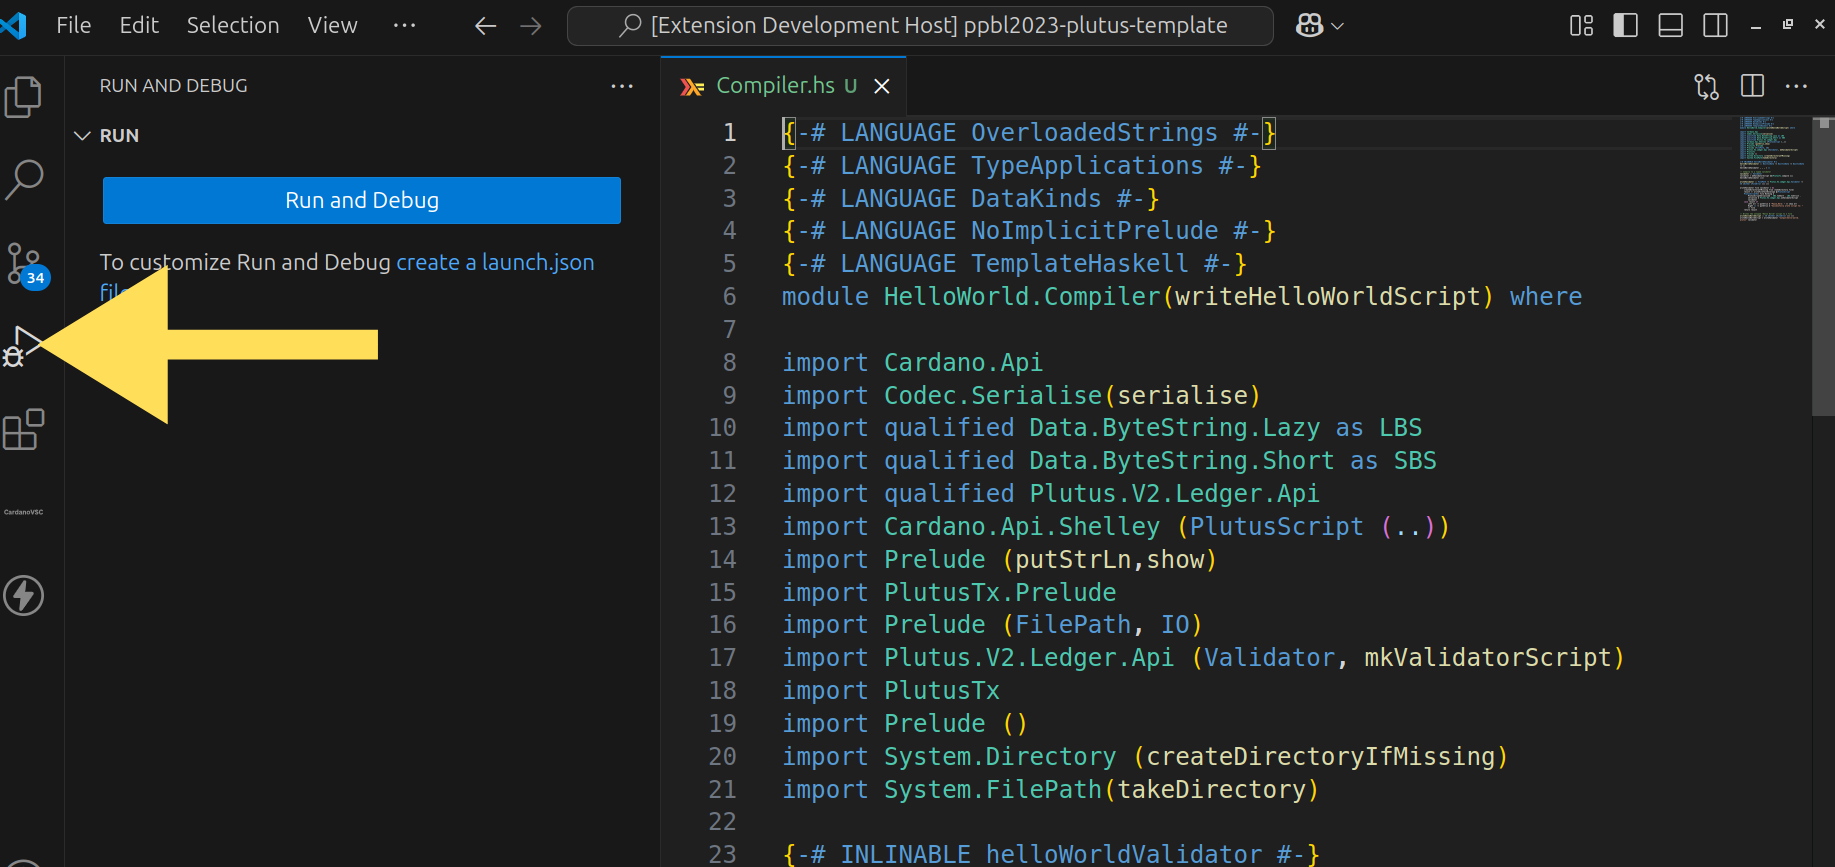
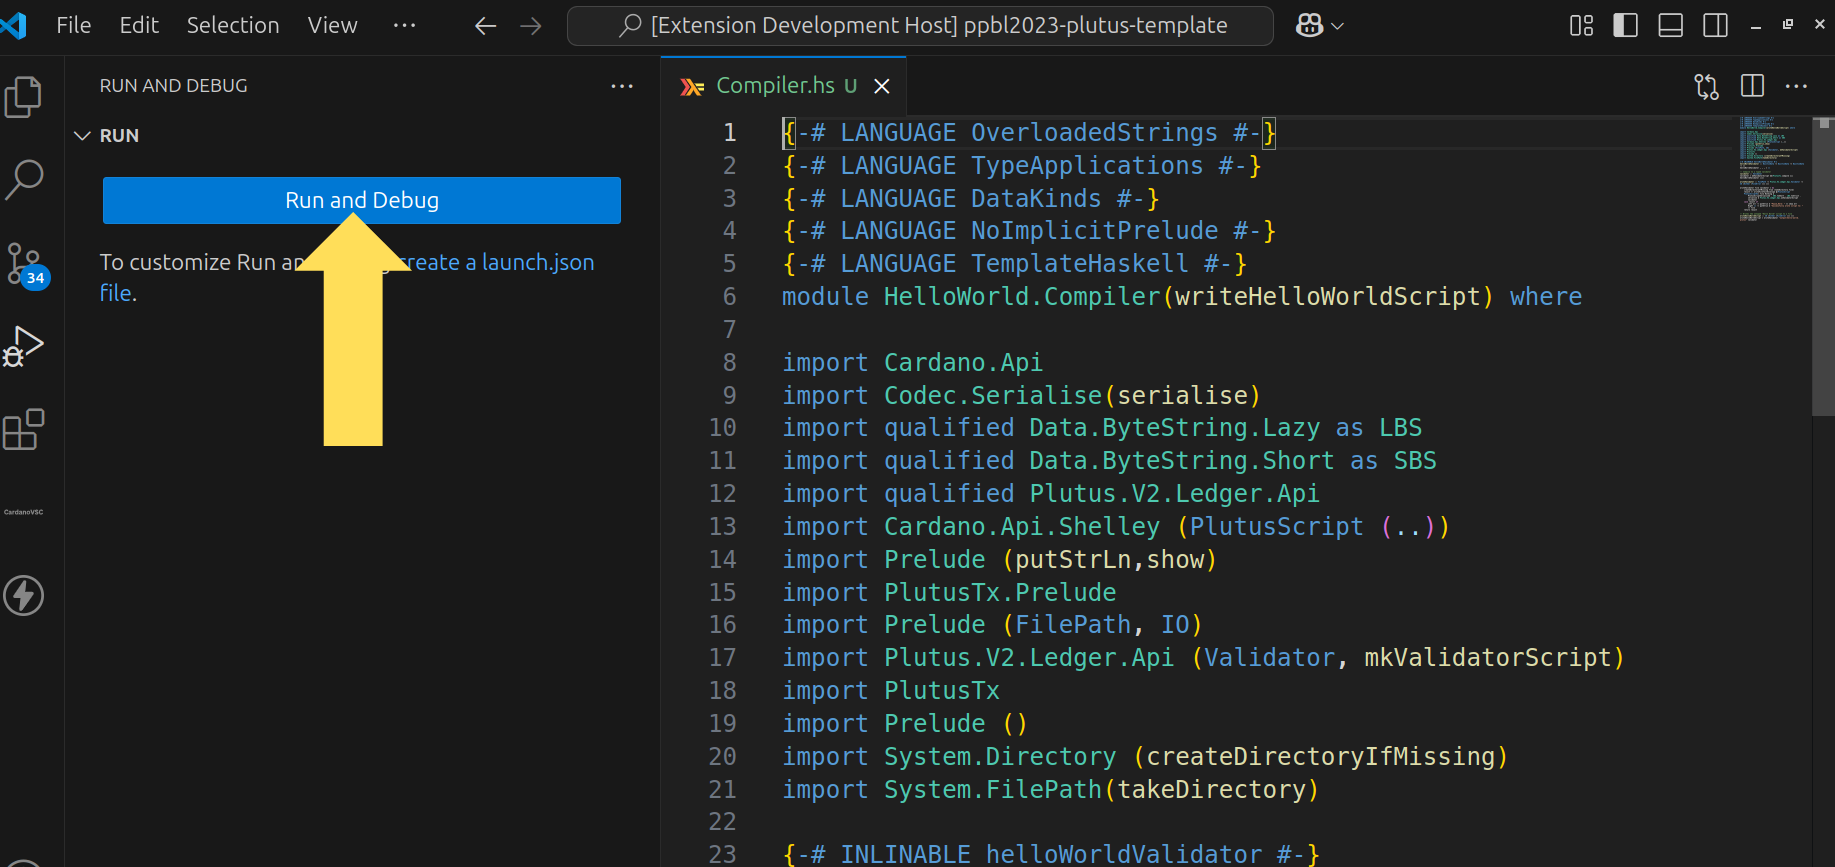
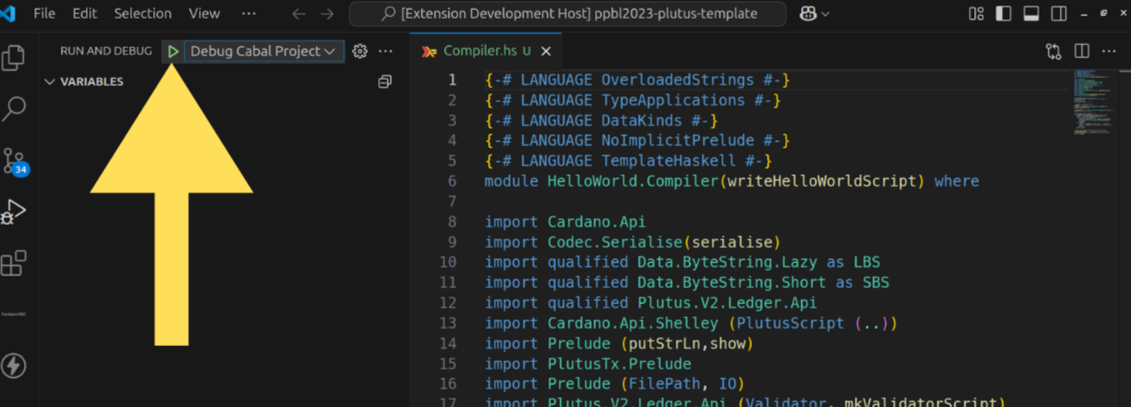
- Press
ctrl+shift+D or go to the Run and Debug sidebar and select debug cabal project.
- 🚀 Automatic Debug Configuration 🚀 : When you open a Haskell file and start debugging, CardanoVSC Debugger intelligently creates a default debug configuration without requiring manual setup.
It checks if the file is a valid Haskell source.
If valid, it auto-generates a configuration like the following:
{
  "type": "haskell",
  "name": "debug cabal project",
  "request": "launch",
  "program": "cabal repl --repl-no-load",
  "activeFile": "${file}",
  "showIO": true,
  "cwd": "${workspaceFolder}"
}
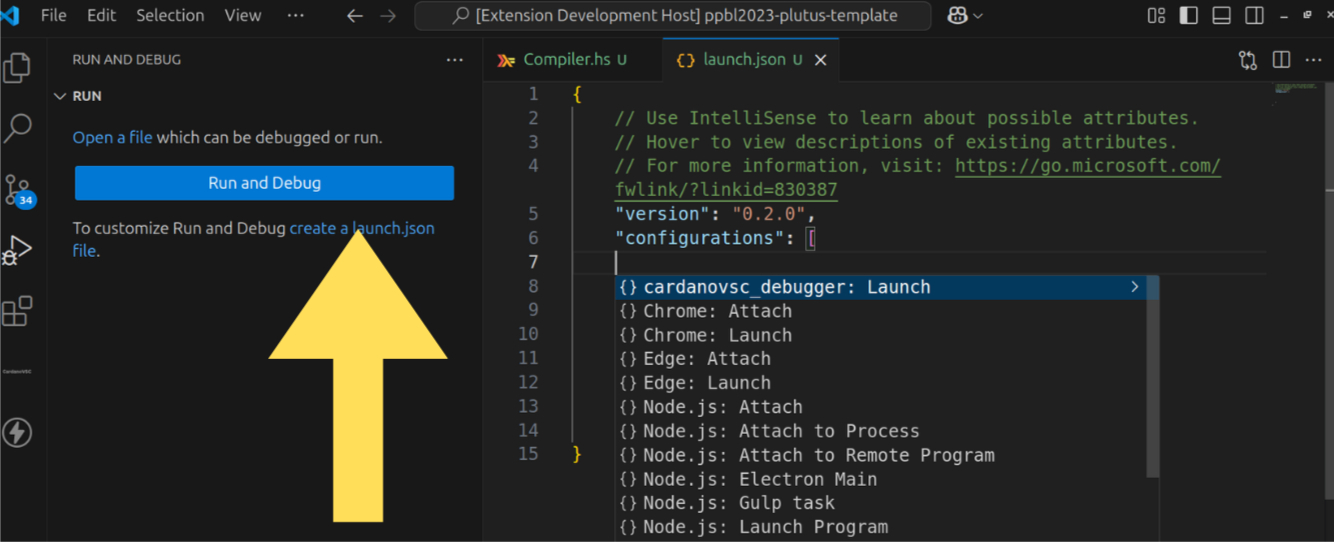
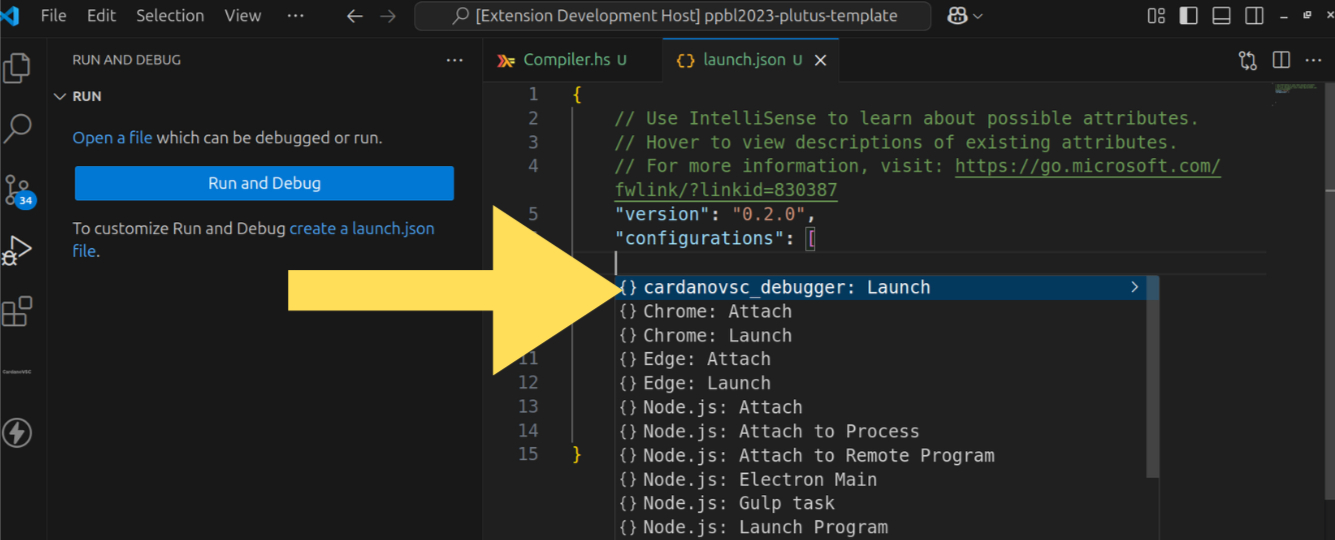
🧩 Manual Setup (Optional)
If you prefer manual configuration, create or update .vscode/launch.json with the following json:
{
  "version": "0.2.0",
  "configurations": [
    {
      "type": "haskell",
      "request": "launch",
      "name": "Debug Cabal Project",
      "program": "cabal repl --repl-no-load",
      "activeFile": "${file}",
      "showIO": true,
      "cwd": "${workspaceFolder}"
    }
  ]
}
Debug a single .hs file which is loaded in . cabal file containing a single contract
- Make sure that a single folder or workspace is opened in VSCode, and that it is a valid Cabal project.
- Keep the .hs file that contains the smart contract open and in focus (debugging multiple files is not supported).
- Do not set breakpoints in any file other than the one currently open.
🧠 Debug Process
There are two ways :-
first method
Second method
🧩 Debug Demo
- When the VSCode debug button is clicked, any errors in the program are displayed in both the Debug Console and directly within the code editor.
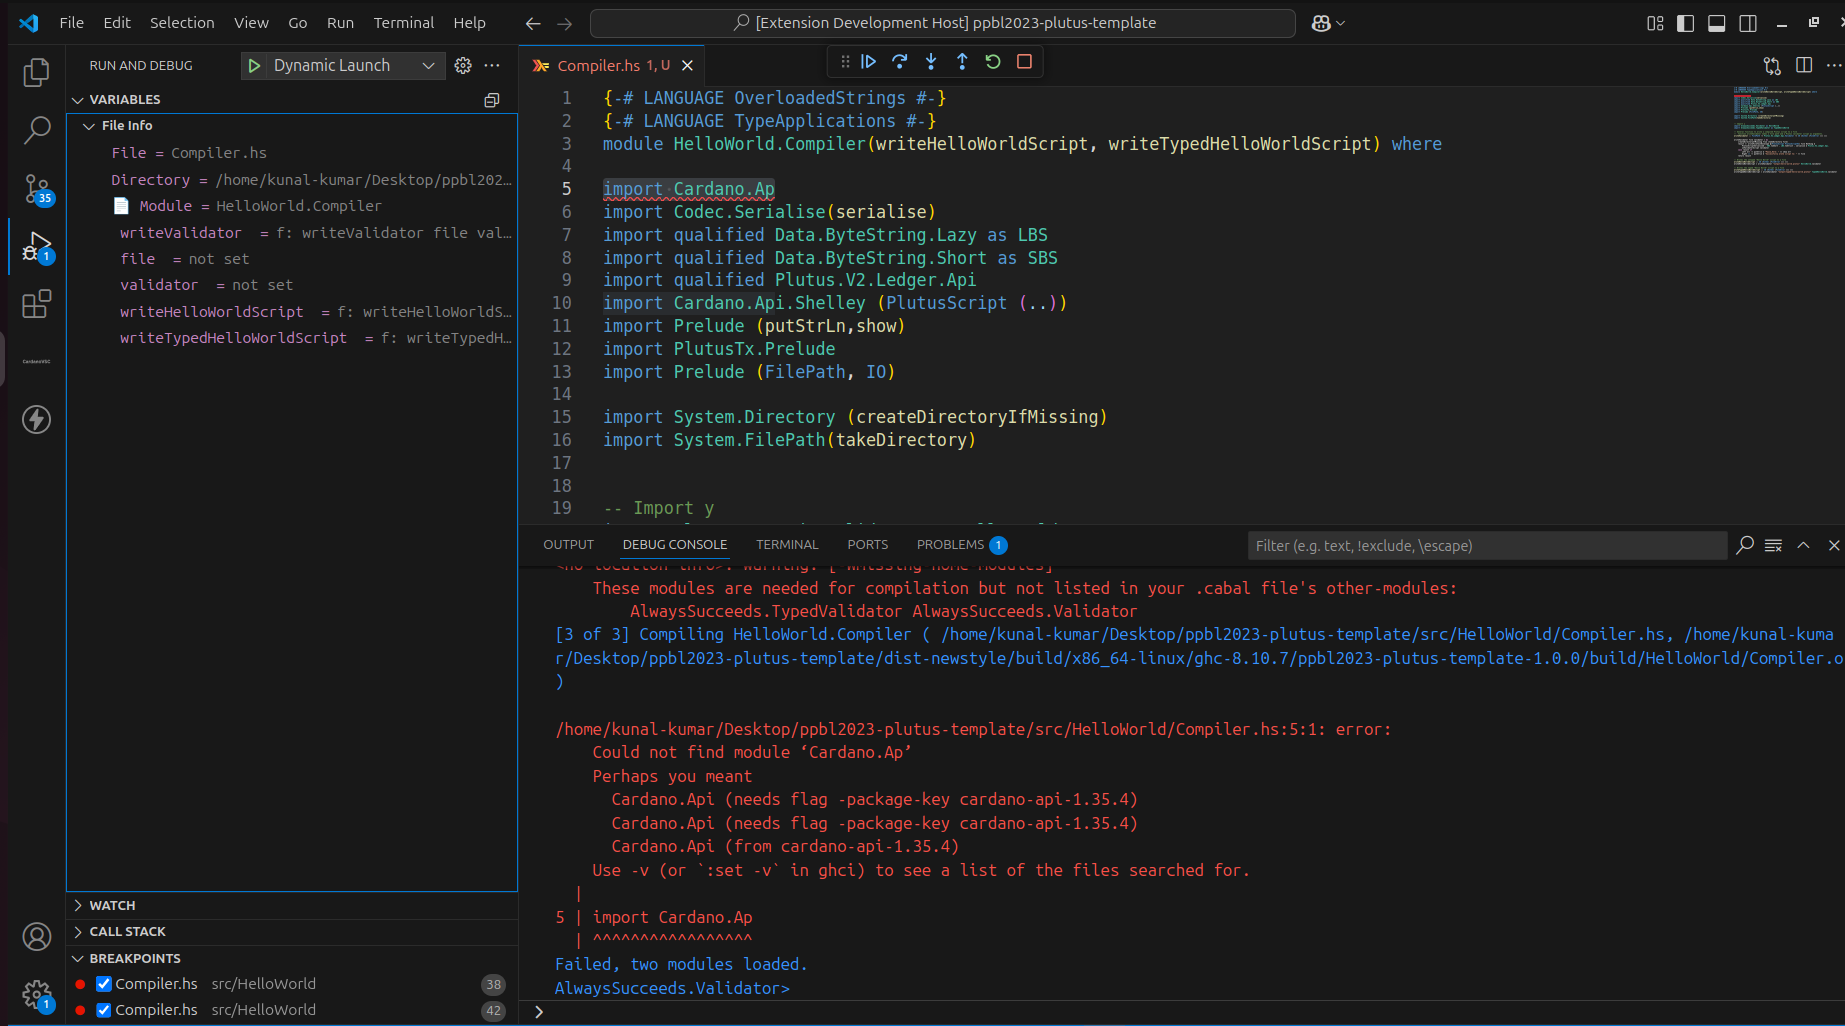
- During debugging, the file data appears in the Variables section of VSCode. Argument values are updated dynamically as you step into functions.
🧩Command - Get latest UTXO Details
The command is used to fetch and visualize the latest UTXO (Unspent Transaction Output) of a Cardano script address using the Blockfrost API.
⚙️ Prerequisite
Before using this command, ensure the CardanoVSC extension is installed and configured:
Install the CardanoVSC Extension.
Go to the CardanoVSC sidebar webview and click cardano node connection
If the network configuration is missing, the command will not execute and will display the following error:
❌ No config.network configuration found. Please configure your config.network first through cardanovsc extension.
🚀 How to Use
Open the Command Palette in VS Code (Ctrl + Shift + P ).
Run CardanoVSC Debugger: Get UTXO Details.
Enter the Cardano script address (e.g., addr1...).
🧪 Troubleshooting
🤝 Contributing
Contributions are welcome! Please open an issue or pull request on GitHub.
📜 License
This project is licensed under the MIT License.
📌Scope and Design Documentation
