Data Viewer
Simple syntax/Copy Excel➔ Markdown table➔ live data workbench — sort, filter, chart, and export to PNG/TSV, without ever leaving your editor.
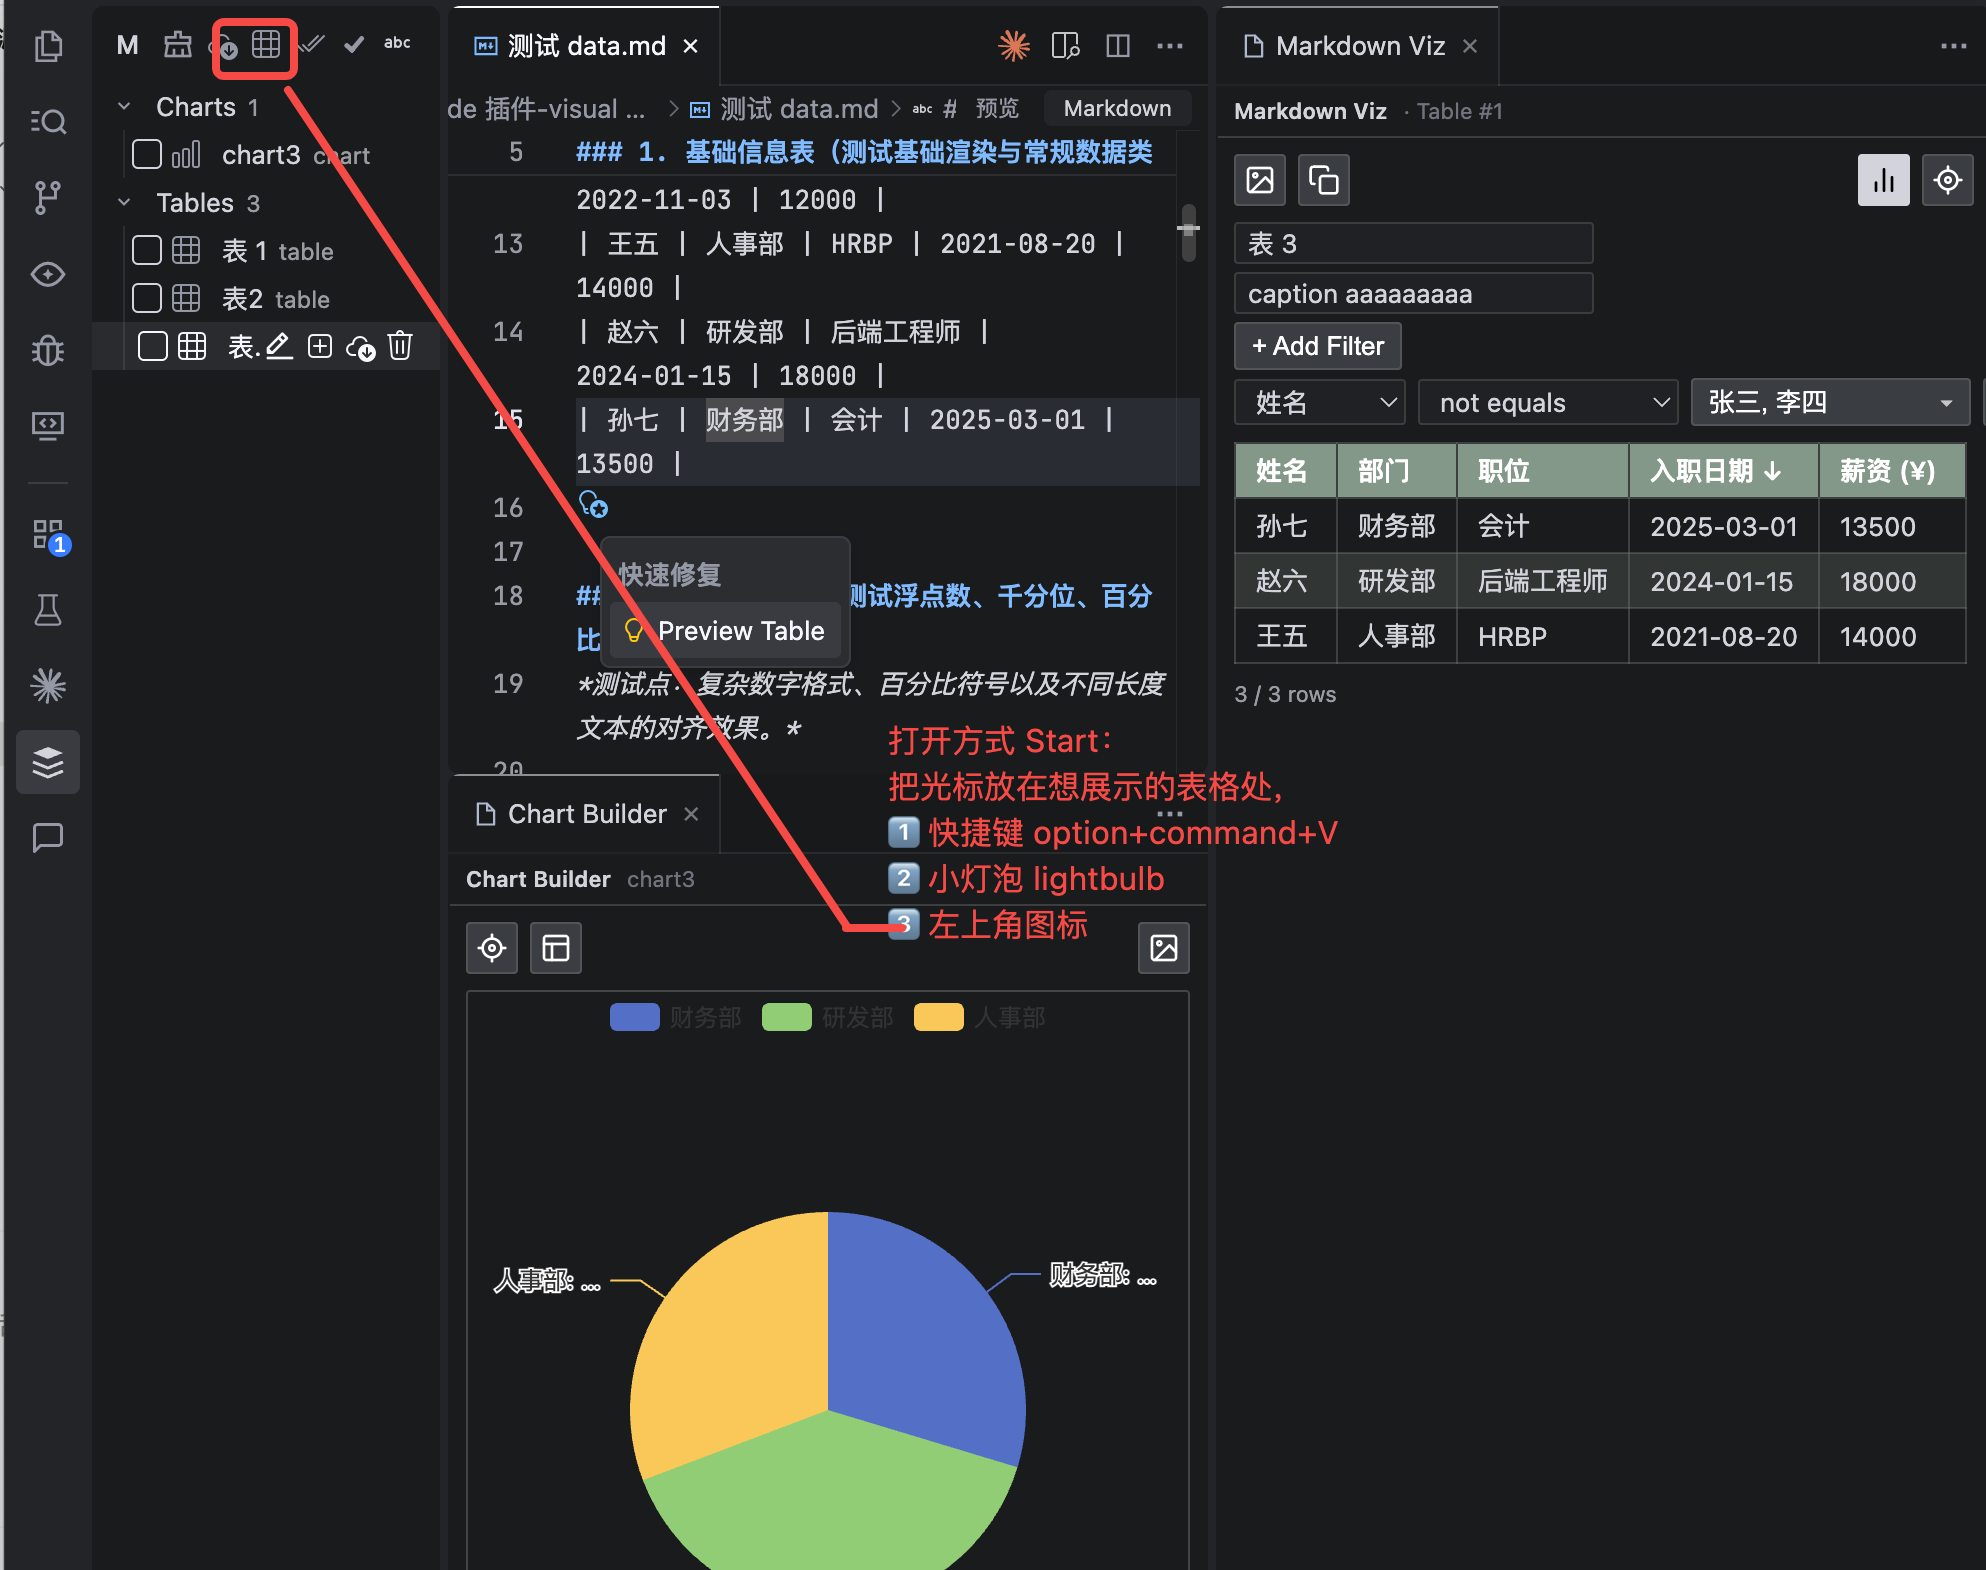
- 💡 Preview — cursor on a table → bulb /
⌥⌘V → a real, sortable, filterable table (numeric / date / text aware). Tables inside ```md fences count too.
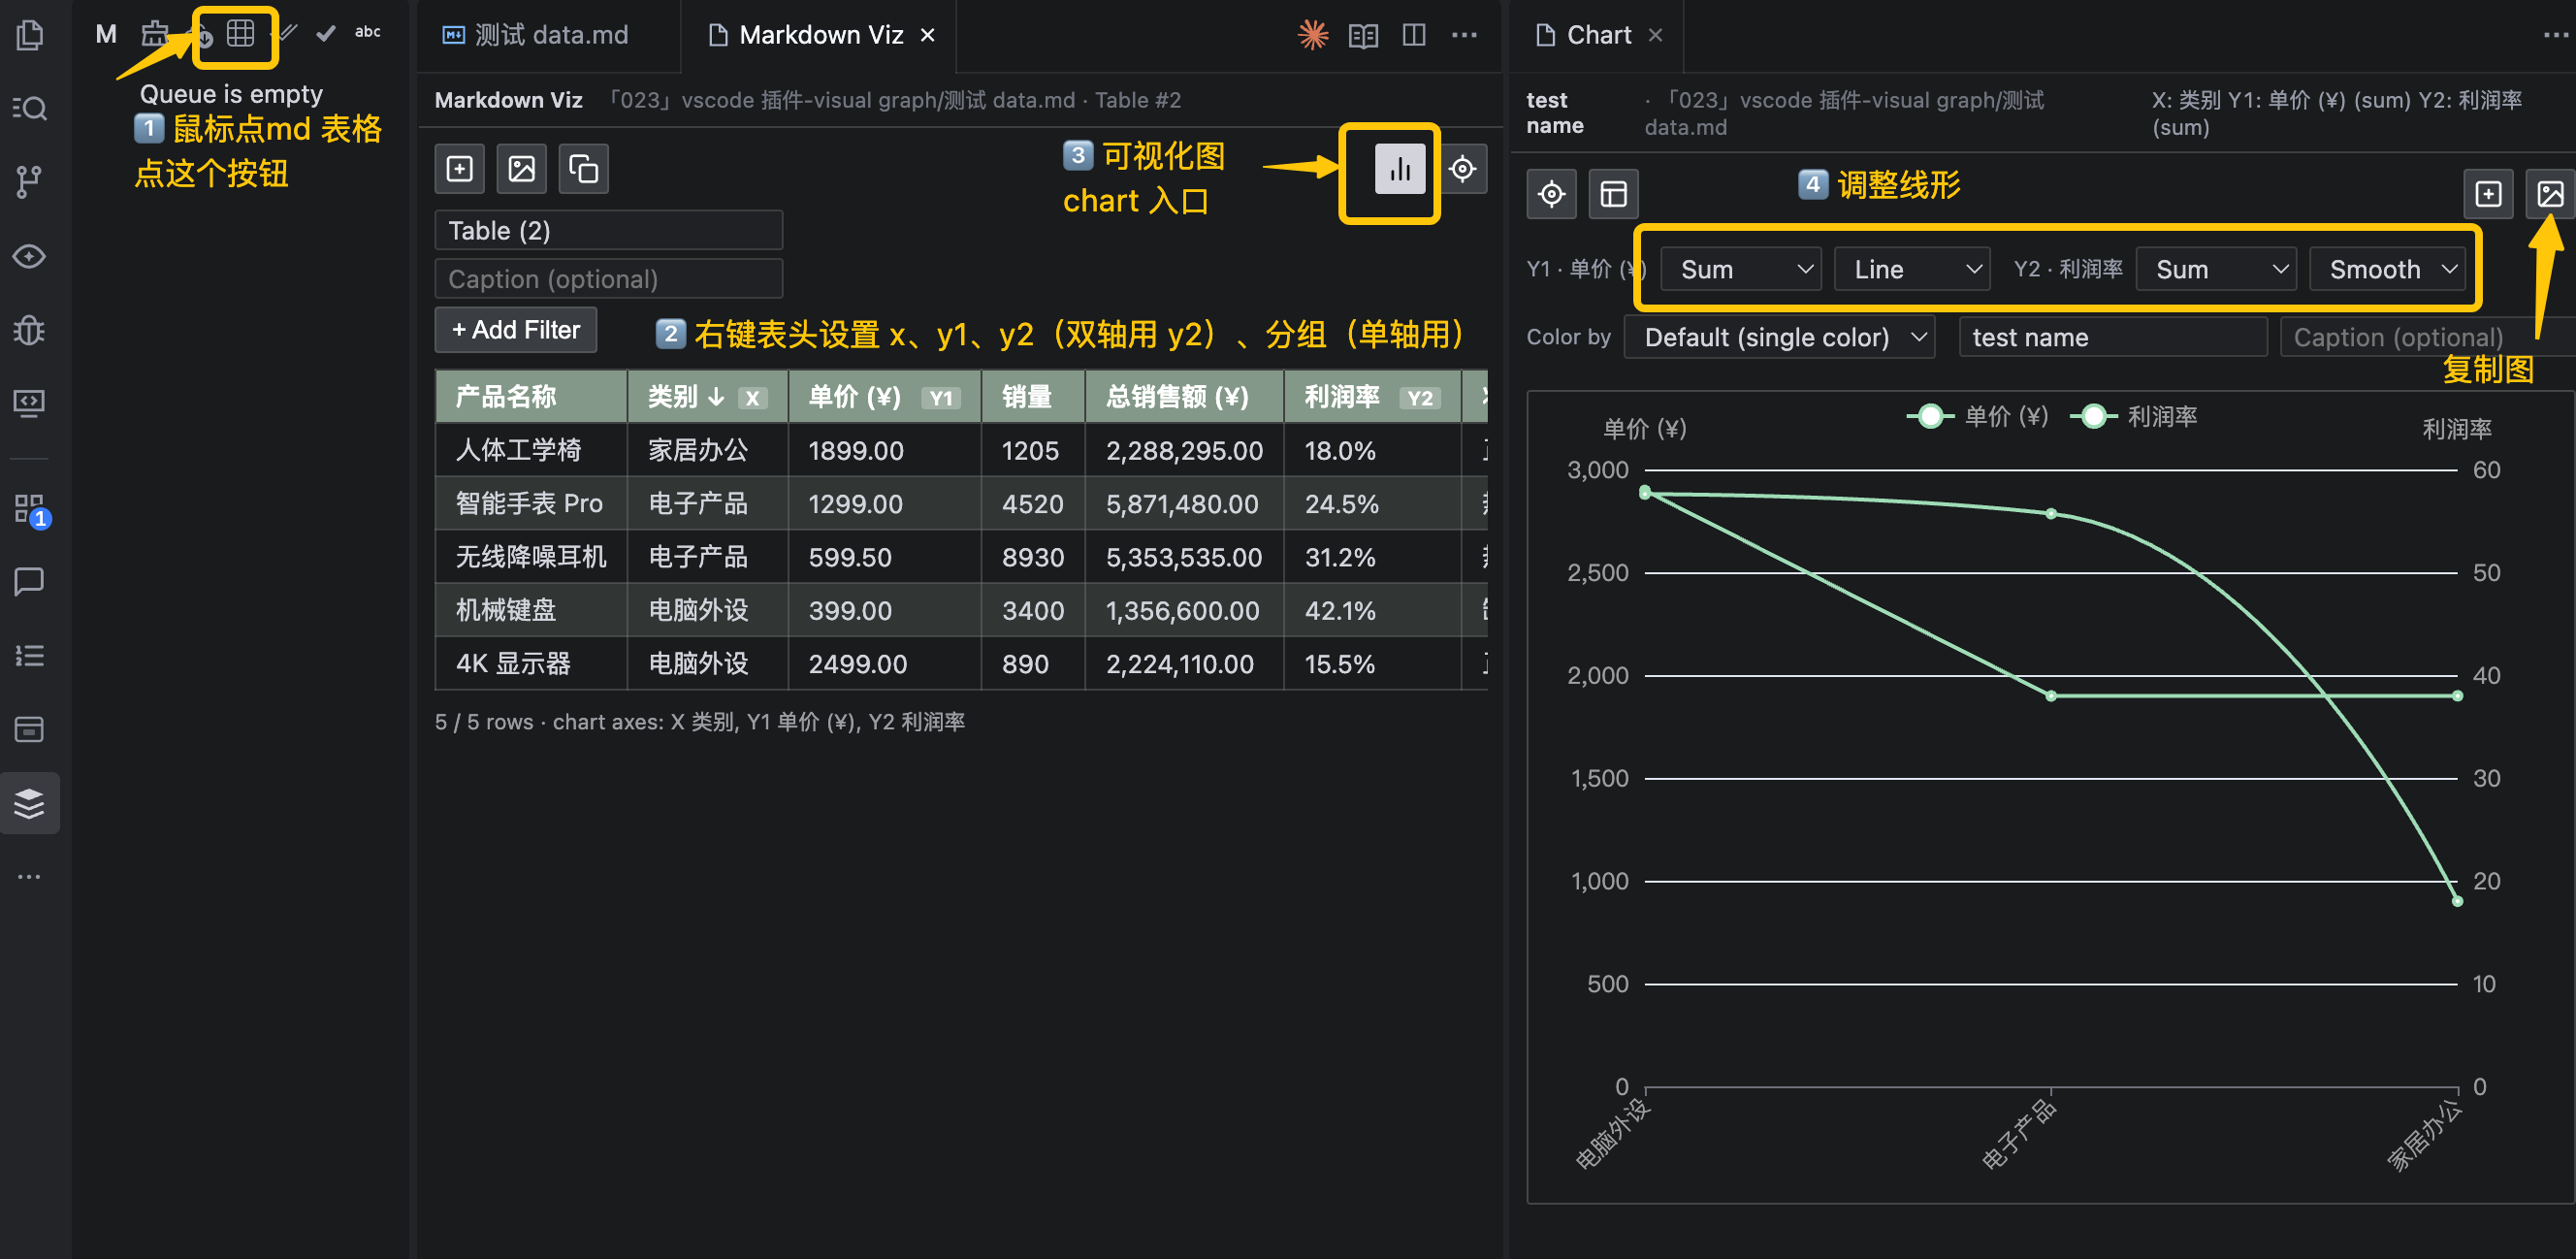
- 📊 Visualize — right-click headers to set X / Y1 / Y2 / Group, then chart in one click (ECharts, SVG-crisp). Stacked bars, and the chart follows your edits live.
- 🖼️ Export — copy tables & charts as PNG (with optional name + caption), or copy TSV straight into Excel / WPS / Sheets
- 📥 Export Queue — collect charts & tables in a sidebar, then copy or download individually, or ZIP them all
- 🔒 100% local — no account, no backend, no network, no AI. Markdown stays your source of truth.
Why Data Viewer?
Your AI hands you a Markdown table in a second. Sort it, filter it, chart it — and get back to work — all without leaving your editor.
Data Viewer turns the static Markdown table (much of it AI-generated today) into a live analysis surface right where you are: sort columns, filter rows, and build a chart in one click. No copy-paste into Excel, no re-typing into a chart tool, no broken flow.
| Without Data Viewer |
With Data Viewer |
| Read a static table, one value at a time |
Sortable, filterable grid |
| Jump to Excel just to sort a column |
Sort in place, type-aware (number / date / text) |
| Re-type data into a chart tool |
Chart straight from the header (X / Y1 / Y2 / Group) |
| Copy → paste → reformat every export |
Copy PNG / TSV directly |
| Lose your outputs |
One Export Queue for every chart & table |
Stay in the zone. Sort, filter, visualize — in place, in seconds, fully local.
Product map
Data Viewer
├─ Preview ──────────── resolve the table under the cursor
│   ├─ Sort     (numeric / date / text aware)
│   ├─ Filter   (multi-condition, value picker)
│   ├─ Render   (column alignment, in-cell <br>, emoji)
│   └─ Tables inside ```md / ```markdown fences too
├─ Visualize ────────── axes from header right-click (ECharts / SVG)
│   ├─ Aggregation per axis (Sum / Count / Avg / Min / Max)
│   ├─ Shape per axis (Bar / Line / Smooth), Stack, Color by
│   ├─ Tracks edits live; filters/axes preserved
│   └─ Frozen snapshot for exports + closed files
├─ Convert ──────────── loose data ↔ Markdown ↔ spreadsheet text
│   ├─ Convert to Markdown Table  (Excel paste / typed data → table)
│   ├─ Convert to Quick Input     (table → editable plain text)
│   └─ Copy for Excel             (clipboard TSV, document untouched)
├─ Export
│   ├─ PNG     (table / chart, optional name + caption)
│   └─ TSV     (paste into Excel / WPS / Sheets)
├─ Export Queue ─────── one place for every output
│   ├─ Add / Open / Edit / New-from-item / Delete
│   ├─ Copy & Download PNG     ── individually
│   ├─ Download Selected       ── as ZIP
│   └─ Self-contained items (survive source-file close)
└─ Local-first ──────── .markdown-viz/charts.json, no network
30-second workflow
Write a Markdown table
   ↓
Place the cursor inside it
   ↓
Preview Table (💡 light bulb / ⌘⌥V / sidebar button / command palette)
   ↓
Sort & filter on the fly
   ↓
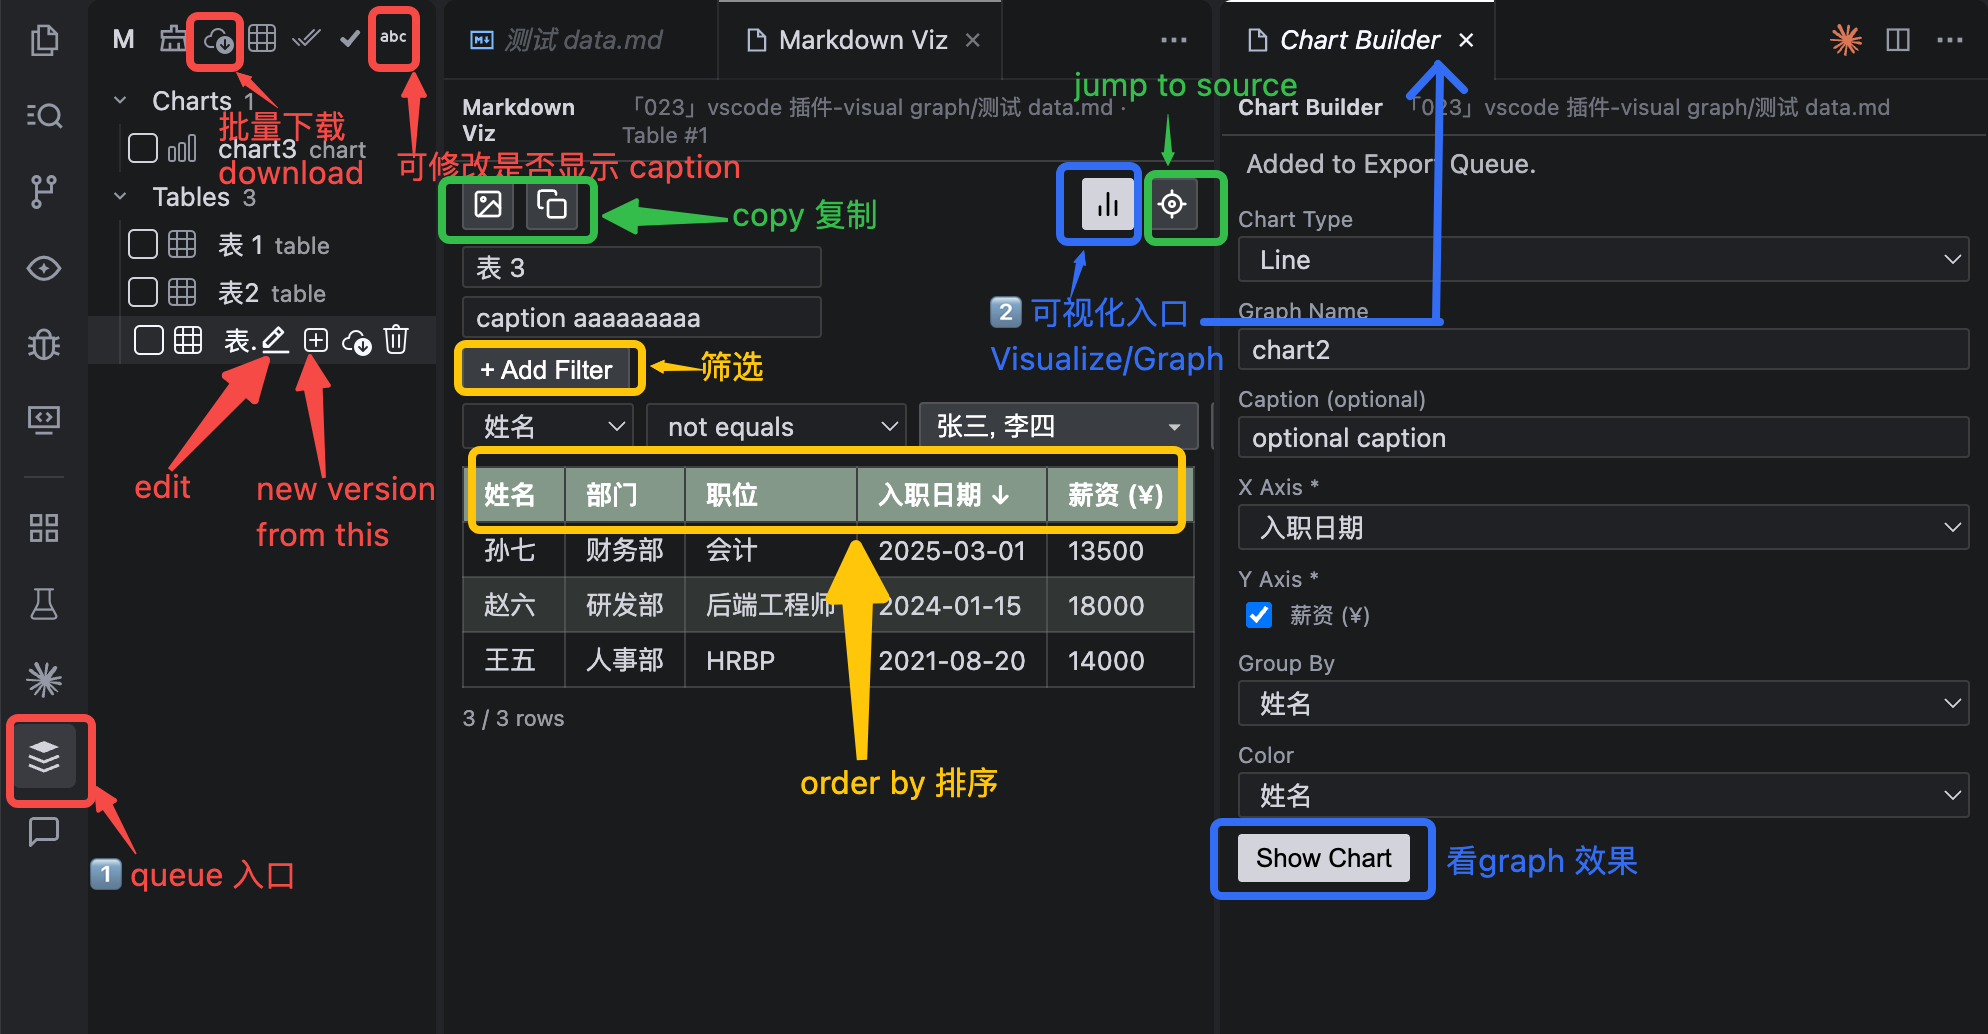
Visualize → right-click headers for X / Y1 / Y2 / Group
   ↓
Add to Export Queue
   ↓
Copy PNG / TSV  or  Download all as ZIP
Core capabilities
1. Table Preview — sort & filter without leaving Markdown
- Type-aware sorting — numbers sort numerically (
10 > 9), dates chronologically, text alphabetically. No more Excel round-trips.
- Multi-condition filtering — equals / not-equals / contains / starts-with / ends-with and numeric ranges; string columns get a picker of existing values.
- Faithful rendering — honors Markdown column alignment (
:--- / :---: / ---:), in-cell <br> line breaks, emoji and long text.
- Multiple tables? The light bulb / shortcut always previews the table under your cursor, not just the first one.
- Tables inside ```md fences work too — a table in a Markdown code block is documented Markdown, so it previews, charts and exports like any other. Other fence languages are left alone: that content is code.
Right-click a column name in the table and tag it as X / Y1 / Y2 / Group, then click the chart button in the table toolbar. The tagged roles are marked on the header itself (X, Y1, Y2, G), so setting up a chart is just picking columns — there is no field-mapping form.
- Aggregate each Y axis — Sum / Count / Average / Min / Max within each X bucket.
- Choose each Y axis's shape — Bar / Line / Smooth, independently for Y1 and Y2.
- Y2 draws on a second, right-hand axis with its own aggregation and shape.
- Color by any column; unset, it falls back to the group column's identity, and to a single colour when there is no group column.
- Group column turns each distinct value into its own series.
- Stack the group's series into one bar per X, per Y axis — e.g. X = date, Y = cost, group = country gives one bar per date with each country inside it. (Bars with a group only; the control says why when it does not apply.)
- Add a title and caption, then Add to Export Queue, copy, or open source table.
- Built from your filtered rows — filter first, chart what you actually care about.
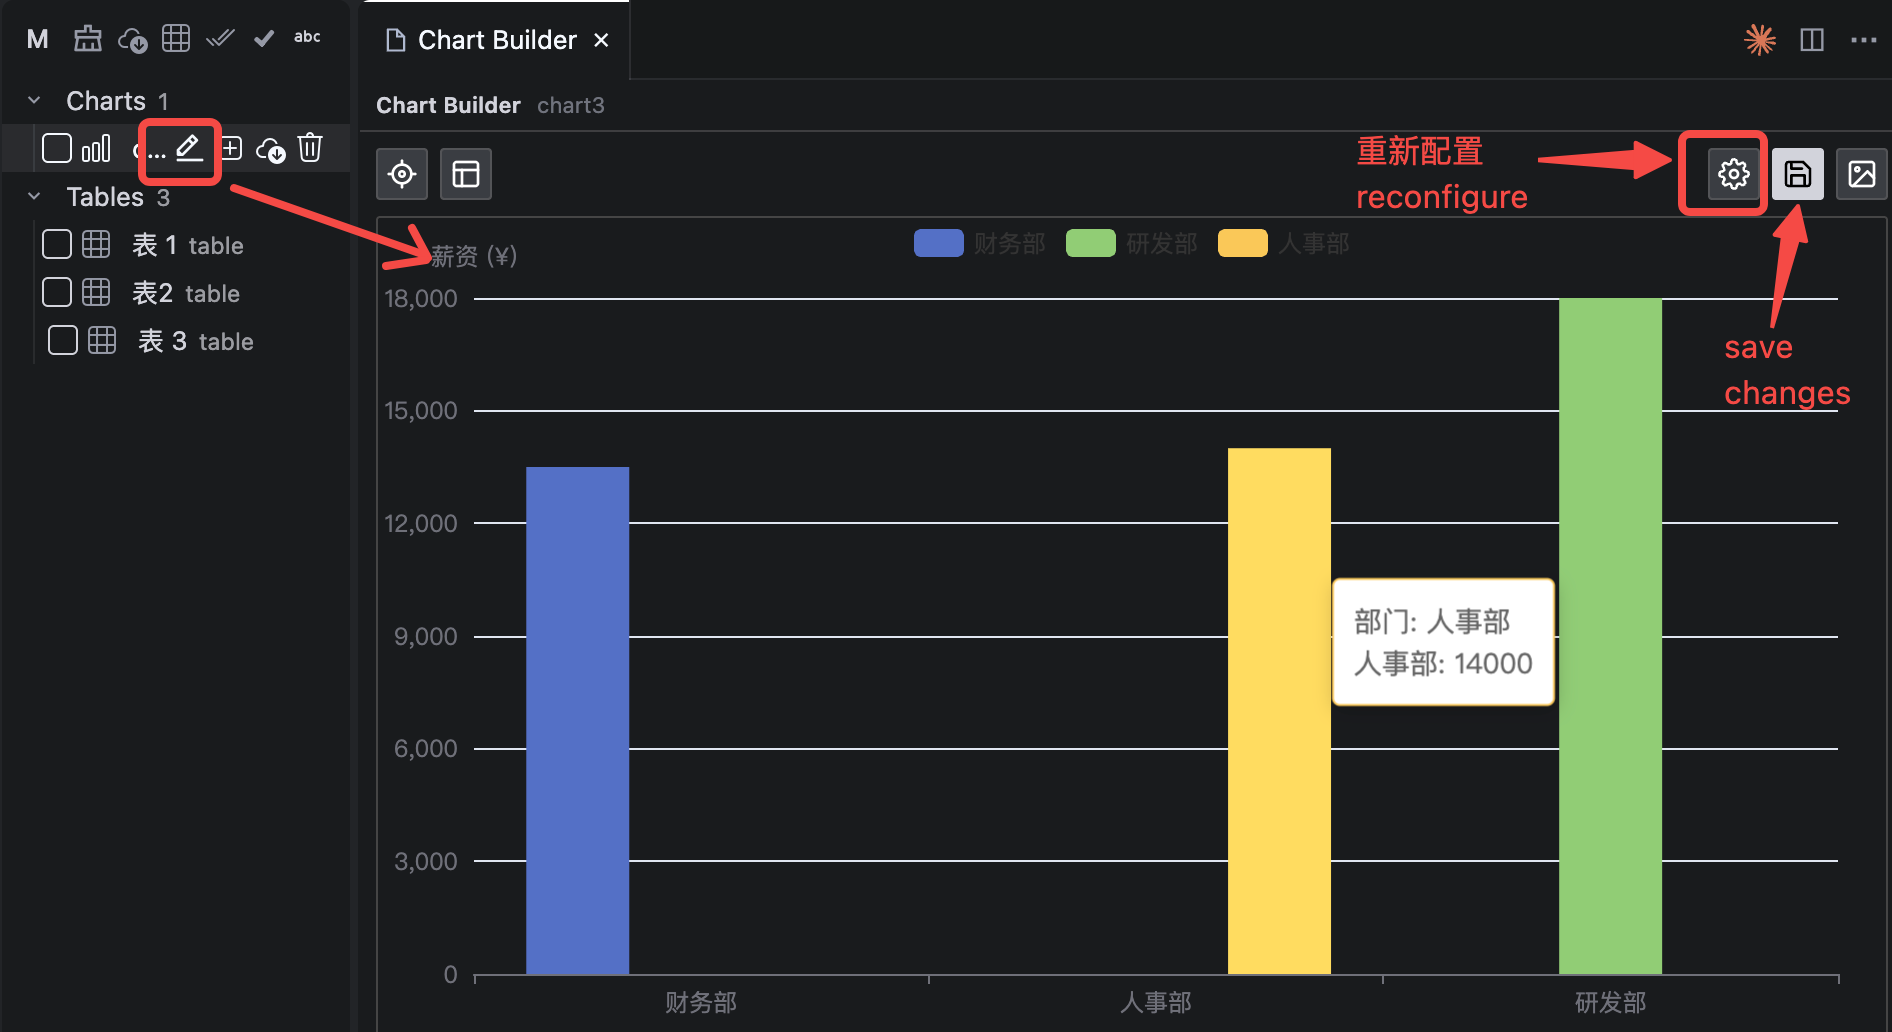
- Tracks edits live — change the Markdown and the open chart follows, keeping your filters, sort and axis tags. Refreshing never steals focus or switches tables. A refresh button on each panel re-reads on demand. The queued copy keeps a frozen snapshot, so exports stay reproducible even after the source file is closed, and a chart whose file is gone still opens from that snapshot.
Decorated numbers chart as numbers. 24.5%, 1,234.5, $1,200, ¥1,000 and accounting negatives (1,234.50) all plot, and sort numerically as axis labels. Percent signs are stripped rather than divided by 100, so the axis reads 24.5 exactly where the table reads 24.5%. Genuinely ambiguous cells (1,5, 1 234) are left unparsed instead of guessed.
Group and Color are independent. Group decides how many series you get; Color decides how they are tinted. Because a series is a single line or bar it carries one colour — when its rows span several Color By values (group by Product, colour by Region), the series takes the dominant value and the chart notes the ones that are mixed, rather than letting row order pick silently.
16 pastel colours cycle for Color by / group, ordered so adjacent series differ in both hue and lightness — the first few colours are as far apart as the whole palette, so a two-series chart is as readable as a sixteen-series one.
3. Export — PNG & TSV
| Output |
Use it for |
| PNG (table or chart) |
slides, docs, reports — with optional name + caption banner |
| TSV |
paste straight into Excel / WPS / Numbers / Sheets, columns intact |
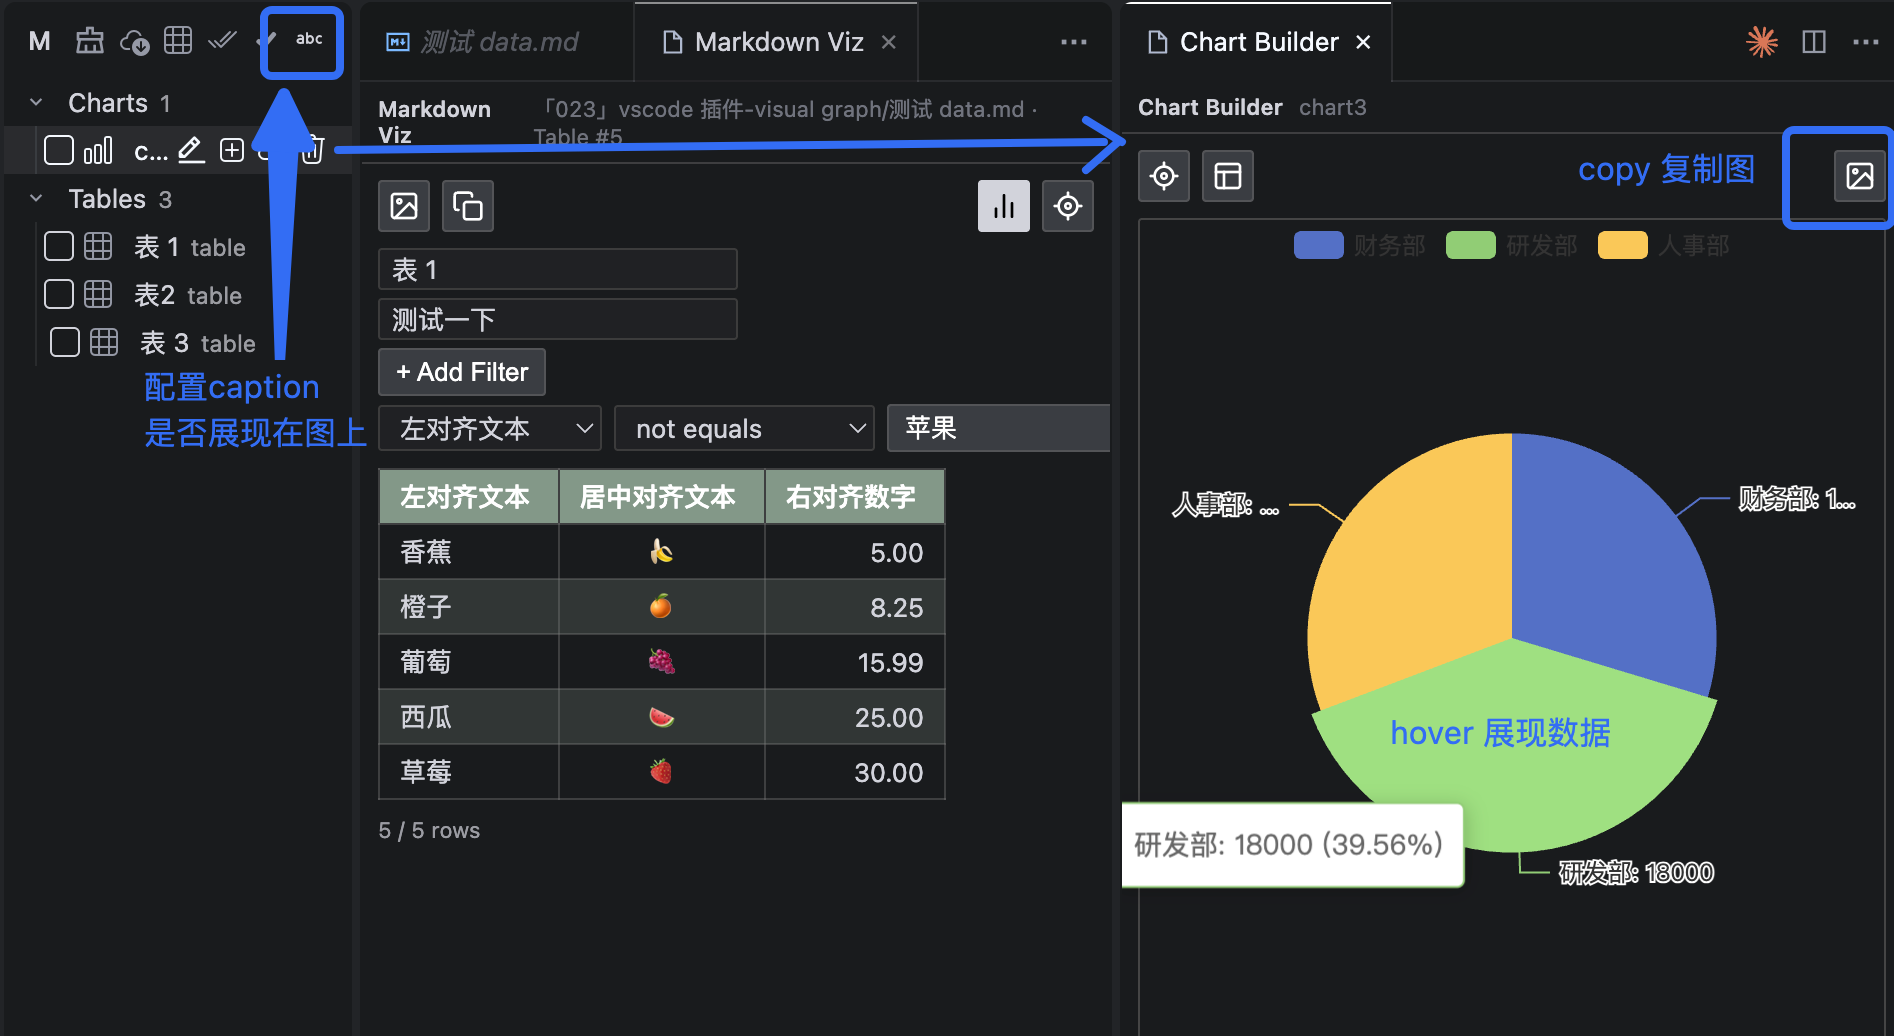
- Image Caption button (in the Export Queue toolbar) lets you choose what appears on exported images: Name + Caption / Name only / Caption only / Hide both. Applied to both PNG copy and ZIP export.
- Copy TSV respects the same name/caption setting (each on its own line).
3.5 Convert — get data in and out of Markdown
Loose data doesn't have to be hand-written into | a | b | syntax first. Put the cursor in the block (or select it) and use the 💡 light bulb:
Excel / Numbers / Sheets        Quick Input (typed or pasted)
        │                                  │
        └──────────► Markdown Table ◄──────┘
                          │
              ┌───────────┴───────────┐
              ▼                       ▼
       Convert to Quick Input     Copy for Excel
       (editable plain text)      (clipboard → Cmd+V in a sheet)
| Command |
What it does |
| Convert to Markdown Table |
Turns a tab-separated (Excel) or whitespace-separated block into a Markdown table, in place. |
| Convert to Quick Input |
Flattens a Markdown table into editable plain text — one row per line. |
| Copy for Excel |
Writes the table to the clipboard so Cmd+V lands in a spreadsheet with the columns intact. Never modifies the document. |
- Every conversion goes through one table model, so
Markdown → plain text → Markdown preserves your data exactly. Only the formatting changes.
- Conversions refuse rather than guess. A block whose row lengths disagree is reported instead of being silently rewritten — your document is left untouched.
- One undo. Each conversion is a single edit, so
Cmd+Z takes the whole thing back at once.
- No default shortcuts — the commands are fully registered, so bind your own in Keyboard Shortcuts if you want one. See the FAQ for the input syntax.
4. Export Queue — one place for every output
A dedicated sidebar that remembers everything you've charted or exported:
- Add charts and tables, open them later (with filters/sort restored), edit (overwrite), or new view from this.
- Editing a chart means editing its axes — it reopens the source table with the tagged columns already marked, so you re-tag the header and save back over the same entry. There is no separate chart form to reopen.
- Copy / Download PNG per item, select the ones you want, then Download Selected as a ZIP.
- Items store their frozen data, so you can reopen or export them even after the source file is closed.
Commands
| Command |
What it does |
Data Viewer: Preview Table |
Preview the table under the cursor |
Data Viewer: Convert to Markdown Table |
Turn the data block into a Markdown table |
Data Viewer: Convert to Quick Input |
Flatten a Markdown table to editable text |
Data Viewer: Copy for Excel |
Copy the table to the clipboard for a spreadsheet |
Data Viewer: Refresh Table Preview |
Re-parse the current document |
Data Viewer: Open Export Queue |
Open the Export Queue sidebar |
Keyboard shortcut
| Shortcut |
Action |
Cmd/Ctrl + Alt + V |
Preview the table under the cursor (rebindable) |
You can also trigger Preview via the 💡 light bulb inside a table, the sidebar button, or the Command Palette.
The three conversion commands ship without default shortcuts on purpose — they would collide with the editor's own Markdown bindings. They are fully registered, so bind your own in Keyboard Shortcuts if you want them.
Columns split on whitespace (space / multiple spaces / Tab are equivalent), the first line is the header, and values containing spaces go in "quotes".
An empty value is written "" — a bare gap can't mean "empty cell", since it is indistinguishable from the separator:
x y z
"" mid ""
1% "" 1.23
Feedback
Found a bug or have a feature request? Open an issue in the extension repository, or reach me via WeChat (Yvonne1ru, please state your issue in the verification message).
Data Viewer 中文说明
中文说明(附录)
简单的语法/复制Excel➔ Markdown表格➔ 可交互的数据工作台 —— 排序、筛选、图表、导出 PNG/TSV,全程不离开编辑器。
- 💡 预览 —— 光标置于表格内 → 灯泡 /
⌘⌥V → 得到可排序、可筛选的真实表格(数字 / 日期 / 文本类型识别);```md 代码块里的表格同样可用。
- 📊 可视化 —— 右键表头设为 X / Y1 / Y2 / 分组,一键出图(ECharts,SVG 高清);支持堆叠柱,且图表随编辑实时更新。
- 🖼️ 导出 —— 表格与图表复制为 PNG(可带 name + caption),或复制 TSV 直接粘进 Excel / WPS / Sheets
- 📥 导出队列 —— 在侧栏收集图表与表格,可单独复制 / 下载,或打包 ZIP 全部下载
- 🔒 100% 本地 —— 无账号、无后端、无网络、无 AI。Markdown 始终是数据源。
---
为什么需要 Data Viewer?
AI 一秒甩给你一张 Markdown 表格。就地排序、筛选、成图 —— 然后继续干活 —— 全程不离开编辑器。
Data Viewer 把你手里(如今很多是 AI 生成)的静态 Markdown 表格,变成你所在之处的实时分析界面:排序列、筛行、一键成图。不用复制进 Excel,不用重新敲进图表工具,不用打断工作流与注意力。
| 没有 Data Viewer |
有了 Data Viewer |
| 一行行读死表 |
可排序、可筛选的网格 |
| 为排一列跳到 Excel |
就地排序,类型感知(数字 / 日期 / 文本) |
| 把数据重敲进图表工具 |
右键表头设轴,一键成图 |
| 每次导出都复制→粘贴→再排版 |
直接复制 PNG / TSV |
| 输出零散易丢 |
一个导出队列管理所有图表与表格 |
保持心流。排序、筛选、可视化 —— 就地完成,几秒搞定,全程本地。
产品功能地图
Data Viewer
├─ 预览 ─────────────── 定位光标所在的表格
│   ├─ 排序     (数字 / 日期 / 文本类型感知)
│   ├─ 筛选     (多条件,含取值下拉)
│   ├─ 渲染     (列对齐、单元格内 <br>、emoji)
│   └─ ```md / ```markdown 代码块内的表格同样解析
├─ 可视化 ───────────── 表头右键设轴(ECharts / SVG)
│   ├─ 每轴聚合(Sum / Count / Avg / Min / Max)
│   ├─ 每轴图形(Bar / Line / Smooth)、堆叠、Color by
│   ├─ 随编辑实时更新,保留筛选与轴标记
│   └─ 冻结快照用于导出与已关闭文件
├─ 转换 ──────────── 松散数据 ↔ Markdown ↔ 电子表格文本
│   ├─ Convert to Markdown Table  (Excel 粘贴 / 手打数据 → 表格)
│   ├─ Convert to Quick Input     (表格 → 可编辑纯文本)
│   └─ Copy for Excel             (写入剪贴板,不改文档)
├─ 导出
│   ├─ PNG     (表格 / 图表,可带 name + caption)
│   └─ TSV     (粘贴进 Excel / WPS / Sheets)
├─ 导出队列 ─────────── 所有输出一处管理
│   ├─ 添加 / 打开 / 编辑 / 据此新建 / 删除
│   ├─ 单项复制 / 下载 PNG
│   ├─ 下载所选(ZIP)
│   └─ 自包含条目(源文件关闭仍可导出)
└─ 本地优先 ─────────── .markdown-viz/charts.json,无网络
30 秒理解工作流
写一张 Markdown 表格
   ↓
把光标放进表格内
   ↓
Preview Table(💡 灯泡 / ⌘⌥V / 侧栏按钮 / 命令面板)
   ↓
即时排序与筛选
   ↓
可视化 → 右键表头设置 X / Y1 / Y2 / 分组
   ↓
加入导出队列
   ↓
复制 PNG / TSV  或  打包 ZIP 全部下载
核心能力
1. 表格预览 —— 不离开 Markdown 即可排序筛选
- 类型感知排序 —— 数字按数值排序(
10 > 9)、日期按时间、文本按字母序,无需再往返 Excel。
- 多条件筛选 —— 等于 / 不等于 / 包含 / 开头是 / 结尾是 / 数值区间;字符串列自动给出已有值下拉选择。
- 忠实还原 —— 支持 Markdown 列对齐(
:--- / :---: / ---:)、单元格内 <br> 换行、emoji 与长文本。
- 多张表? 灯泡 / 快捷键始终预览光标所在的那张表,而非总是第一张。
- ```md 代码块里的表格同样可用 —— 写在 Markdown 代码块里的表格本就是给人看的 Markdown,所以预览、绘图、导出都一如既往。其他语言的代码块不处理,那里面是代码。
2. 可视化 —— 轴从表头来
在表格中右键列名,标记为 X / Y1 / Y2 / 分组,再点表格工具栏的图表按钮。标记会显示在表头上(X、Y1、Y2、G),所以配置图表就是选列,没有字段映射表单。
- 每个 Y 轴可选聚合方式 —— Sum / Count / Average / Min / Max,按 X 分桶计算。
- 每个 Y 轴可选图形 —— Bar / Line / Smooth,Y1 与 Y2 各自独立。
- Y2 画在右侧第二根轴上,聚合方式与图形独立于 Y1。
- Color by 可选任意列;未选时回退到分组列的标识,没有分组列则同色。
- 分组列让每个不同值成为一条独立系列。
- 堆叠(Stack) 把分组内各系列叠进同一根柱,每个 Y 轴独立控制 —— 例如 X = 日期、Y = cost、分组 = country,则每个日期一根柱、各国 cost 叠在其中。(仅对带分组的柱状图有意义;不适用时控件置灰并说明原因。)
- 可填标题与 caption,然后 加入导出队列 、复制、打开源表格。
- 基于筛选后的行成图 —— 先筛选,再画你真正关心的数据。
- 随编辑实时更新 —— 改动 Markdown,打开的图表跟着变,且筛选/排序/轴标记全部保留;刷新不会抢焦点、也不会跳到别的表。两个面板各有一个刷新按钮可立即重读。入队的那份仍存冻结快照,所以源文件关掉后导出依然可复现,图表也仍能打开。
带修饰的数字照样能画。24.5%、1,234.5、$1,200、¥1,000 与会计负数 (1,234.50) 都能绘图,作为 X 轴标签时也按数值排序。百分号是剥离而非除以 100 —— 表格显示 24.5%,坐标轴就显示 24.5,数值一致。真正有歧义的写法(1,5、1 234)保持不解析,不做猜测。
分组与上色互相独立。分组决定有几条系列,Color by 决定它们的颜色。一条系列是一根线/一根柱,只能有一个颜色;当它的行横跨多个 Color by 值时(按产品分组、按地区上色),该系列取占多数的值,并在图上注明哪些系列是混合的,而不是由行序悄悄决定。
16 色淡雅马卡龙循环用于 Color by / 分组。色相均匀铺开、明度交替,相邻系列在两个维度上都不同;且分离度是均匀的 —— 前几个颜色之间的距离和整个色板一样大,所以两条系列的图和十六条系列的一样清晰。
3. 导出 —— PNG 与 TSV
| 输出 |
适用场景 |
| PNG(表格或图表) |
幻灯片、文档、报告 —— 可带 name + caption 标题栏 |
| TSV |
直接粘入 Excel / WPS / Numbers / Sheets,列保持完整 |
- 导出队列工具栏的 Image Caption 按钮让你选择导出图片显示什么:Name + Caption / 仅 Name / 仅 Caption / 全部隐藏,同时作用于 PNG 复制与 ZIP 导出。
- Copy TSV 遵循相同的 name/caption 设置(各自独立成行)。
3.5 转换 —— 把数据送进送出于 Markdown
松散数据不必先手写成 | a | b | 语法。把光标放进数据块(或直接选中),用 💡 灯泡:
Excel / Numbers / Sheets          手打或粘贴的纯文本
        │                                  │
        └──────────► Markdown 表格 ◄───────┘
                          │
              ┌───────────┴───────────┐
              ▼                       ▼
       Convert to Quick Input     Copy for Excel
       (可编辑纯文本)             (剪贴板 → 在表里 Cmd+V)
| 命令 |
作用 |
| Convert to Markdown Table |
把 Tab 分隔(Excel)或空白分隔的数据块原地转成 Markdown 表格。 |
| Convert to Quick Input |
把 Markdown 表格压平成可编辑纯文本,一行一条记录。 |
| Copy for Excel |
把表格写入剪贴板,Cmd+V 粘进表格软件后列结构完整。不修改文档。 |
- 所有转换都经过同一个表格模型,所以
Markdown → 纯文本 → Markdown 数据完全一致,变的只有排版。
- 转换失败不会猜。行的列数对不上会直接报错,原文一字不动。
- 一次撤销。每次转换是单次编辑,
Cmd+Z 整段回退。
- 不带默认快捷键 —— 命令已完整注册,可自行在键盘快捷方式里绑定。输入语法见 常见问题。
4. 导出队列 —— 所有输出一处管理
一个专属侧栏,记住你画过、导出过的所有内容:
- 添加 图表与表格,稍后打开(恢复筛选/排序),编辑(覆盖),或 基于此项新建视图。
- 编辑图表 = 编辑它的轴 —— 会重新打开源表格并还原已标记的列,你改完表头再存回同一条目。没有单独的图表表单可以"重新配置"。
- 单项 复制 / 下载 PNG,勾选后再 下载所选 为 ZIP。
- 条目存储冻结数据,即使源文件已关闭,也能重新打开或导出。
命令
| 命令 |
作用 |
Data Viewer: Preview Table |
预览光标所在的表格 |
Data Viewer: Convert to Markdown Table |
把数据块转成 Markdown 表格 |
Data Viewer: Convert to Quick Input |
把 Markdown 表格压平成可编辑文本 |
Data Viewer: Copy for Excel |
复制表格到剪贴板,供电子表格粘贴 |
Data Viewer: Refresh Table Preview |
重新解析当前文档 |
Data Viewer: Open Export Queue |
打开导出队列侧栏 |
快捷键
| 快捷键 |
操作 |
Cmd/Ctrl + Alt + V |
预览光标所在表格(可自定义) |
也可通过表格内的 💡 灯泡、侧栏按钮或命令面板触发预览。
三个转换命令故意不设默认快捷键 —— 会和编辑器自带的 Markdown 快捷键冲突。命令已完整注册,想要的话可在键盘快捷方式里自行绑定。
🌟 常见问题:表格快速输入语法
列按空白分隔(空格 / 多空格 / Tab 等价),第一行是表头,值里有空格要用 "引号" 包裹。
空值写 "" —— 直接留空不能代表"空格子",因为它和分隔符无法区分:
x y z
"" mid ""
1% 1.23 ""
Feedback
发现 Bug 或者有功能建议?请到插件代码仓库提交 Issue,也可以添加我的微信(Yvonne1ru,好友申请验证信息请写明你的问题)
| |