Overview
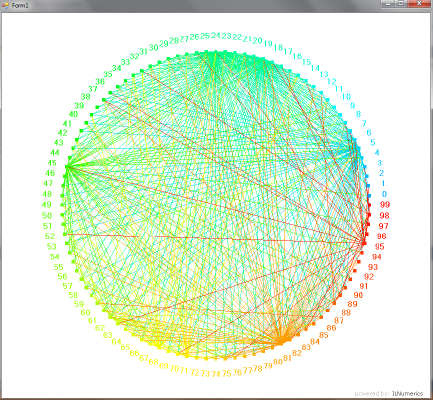
Create 2D and 3D graphs and plots with the Visualization Engine. Pick from a number of built-in visualization objects to present your results or create your very own visualization objects. Use the provided mouse events to turn your charts into a GUI. The Array Visualizer enables you to look at your arrays during your debug session.
Create a Drawing Module
In Visual Studio create a newWindows Forms Application. Right-click the target project in theSolution Explorer. On the project menu, click AddNew Item.

Select the item template Plotting Forms in the Templates pane.

Go to the Program.cs file and set the created form as startup form:

Now, hit F5 to run the program. A form will pop up showing the following image.

Use the left mouse button to resize and rotate the plot cube. Right-click on the line to change the data.
Use the built-in visualization objects to visualize data
Add any kind of built-in visualization object to the scene and modify its properties.

Pick from a number of plotting types.


Reassembly the provided shapes and create shapes with a more sophisticated geometry.

Create custom visualization objects
If you want to use an individual combination of visualization objects multiple times, there are a few possibilities. Take a look at ourtutorial that elaborates on those possibilities.
Turn your graph into a GUI
Use the provided Mouse events to create an interactive graph. Seehere for more information.

Array Visualizer
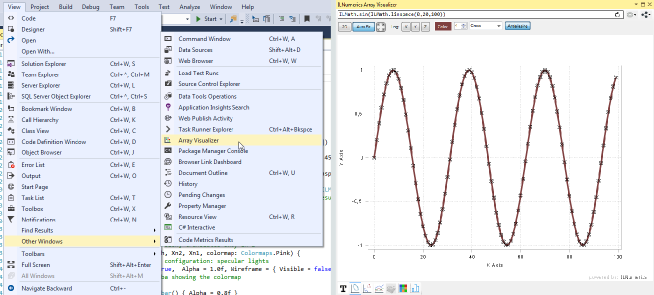
Use the Array Visualizer to visualize arrays during your debug session. Open the View menu, click Other Windows and select Array Visualizer. Enter any expression that yields in an Array type in the textbox of theArray Visualizer.

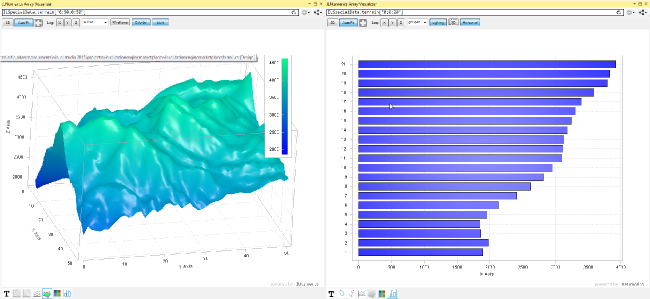
Switch between different plotting types.

More information