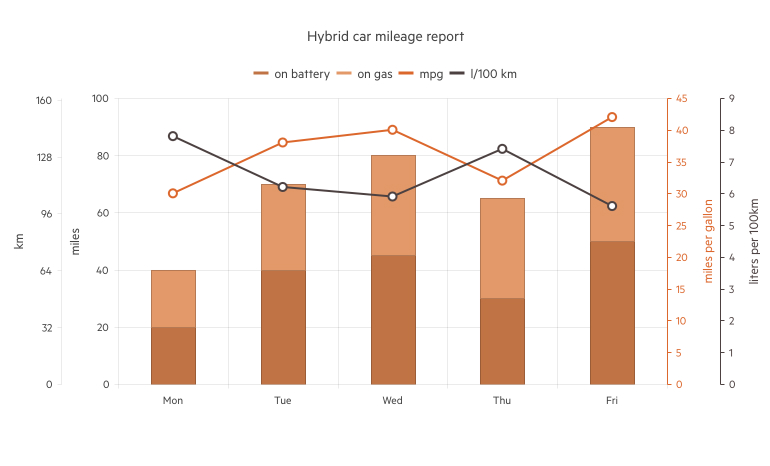
The Kendo UI for Angular Charts component is a package of series types that provide high-quality graphical data visualization of your data. They include a variety of chart types and styles that have extensive configuration options. This flexibility allows you to quickly and easily create the exact chart you need to fit your specific requirements for functionality and appearance. The Angular Charts are built from the ground up and specifically for Angular, so that you get high-performance chart controls which integrate tightly with your application and with the rest of the Kendo UI for Angular components.
16 Angular Chart Types to Cover Any Data Vizualization Need
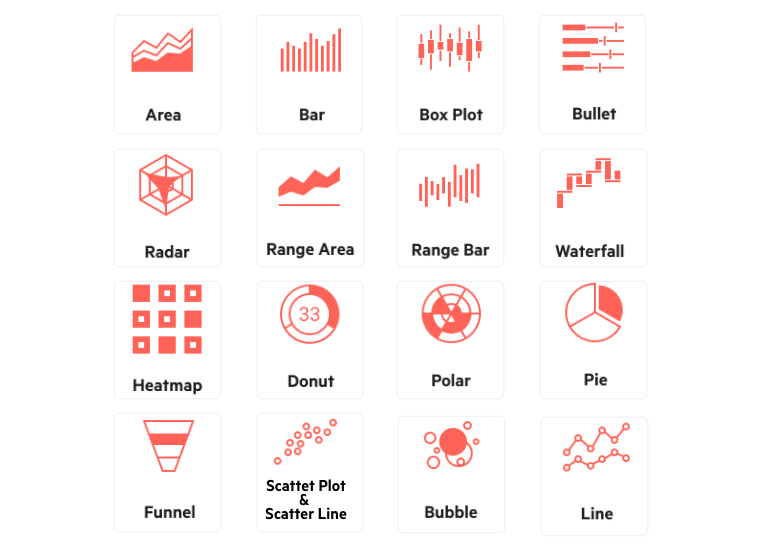
- Area: Area charts and Vertical Area charts are categorical charts, which are suitable for displaying quantitative data by using continuous lines.
- Bar: Bar charts and Column charts are categorical charts, which display data by using horizontal or vertical bars whose lengths vary according to their value.
- Bubble: Box Plot charts are categorical charts which graphically render groups of numerical data through their quartiles.
- Bullet: Bubble charts are scatter charts, which display data as points with coordinates and sizes that are defined by the value of their items.
- Donut: Bullet charts are categorical charts, which are a variation of the Bar Charts.
- Funnel: Donut charts are circular charts, which represent a variation of the Pie charts and are capable of displaying multiple nested series.
- Heatmap: Funnel charts are freeform charts, which display a single series of data in progressively decreasing or increasing proportions that are organized in segments, where each segment represents the value for the particular item from the series.
- Line: Heatmap charts use colors to indicate the relative value of data points in two dimensions.
- Pie: Line charts and Vertical Line charts are categorical charts, which display continuous data as lines that pass through points defined by the values of their items.
- Polar: Pie charts are circular charts, which display data in the form of single-series sectors from a two-dimensional circle and are useful for rendering data as part of a whole.
- Radar: Polar charts are scatter charts, which display two-dimensional data series in polar coordinates.
- Range Area: Radar charts, also known as Spider charts, are categorical charts, which wrap the X axis in a circle or polygon.
- Range Bar: Range Area charts are categorical charts, which represent a variation of the Area Charts.
- Scatter: Scatter Plot and Scatter Line charts are the two main variations of scatter charts and are suitable for displaying numerical data.
- Waterfall: Waterfall charts are categorical charts, which display the cumulative effect of sequentially introduced positive or negative values.
Angular Charts Features
While some charts have unique features by nature, these features are found accross the package.
- Data Binding: The Charts support the binding of their data series to arrays, arrays of arrays, objects, and observables. Beyond the actual series, other areas of the Chart, like the axis and labels, can all be bound to your data as well.
- Rendering Modes: The Charts support two modes for rendering—Canvas (bitmap) and SVG (vector graphics). By default, the Charts are rendered through SVG. Switching between the two is as easy as updating a single configuration option.
- Export Options: The Charts provide built-in support to save your Charts as an image (PNG), PDF, SVG, and the Kendo UI Drawing format (useful for further processing).
- Pan and Zoom: The Charts allow the user to work with them by utilizing intuitive panning and zooming interactions. These functions can be easily enabled or disabled by setting the Chart options.
- Appearance: The colors of the Charts are normally picked up by the current Kendo UI theme, but each aspect of the Chart can be customized by theme variables or configuration options. Kendo UI for Angular delivers a set of popular themes including Bootstrap and Material, all of which can be easily customized with the Progress ThemeBuilder online utility.
- Globalization: The Kendo UI for Angular Charts support globalization and localization to ensure that each Chart component can fit in any application, no matter what languages and locales need to be supported. Additionally, the Charts support rendering in a right-to-left (RTL) direction.
More Charts
Also included are two types of specialized charts.
- Stock Charts: The StockChart is a specialized control for visualizing the price movement of a financial instrument over a certain period of time.
- Sparkline: The Sparkline is a tiny chart without axes, coordinates, legends, titles, or other chart-specific elements.
Helpful Links
Everything You Need To Build Great Angular UI
With 100+ Components, 3 themes (standard, Material, Bootstrap), Theme Builder, and UI Kits for Figma, Kendo UI for Angular is the library professional developers rely on. See the entire list at www.telerik.com/kendo-angular-ui.
Our most popular components:
| |