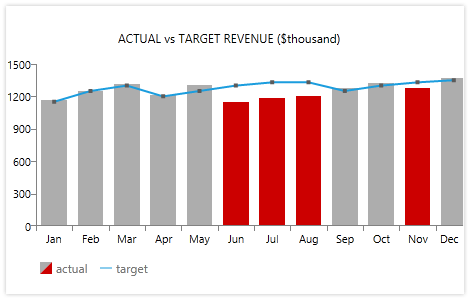
Telerik WPF Chart transforms your data into mind-blowing 2D and 3D charts. The control supports all major 2D/3D chart series types, single or multiple ChartAreas, powerful data binding and many more. It introduces an innovative approach that fully separates functionality and appearance, thus providing you the power to completely restyle it without changing a single line of code. FeaturesSupport for 34 chart typesTelerik WPF Chart supports 18 2D and 16 3D charts to help you create rich, visually-appealing presentations. 2D and 3D stacked bar seriesTelerik WPF Chart features stacked bar series that can be also grouped through the GroupName property. Appearance and StylingTelerik WPF Chart introduces an innovative approach that separates functionality and appearance altogether. This allows you to completely restyle the control without changing a single line of code. Rich data binding supportLeveraging the WPF databinding capabilities, Telerik WPF Chart ca bind to various data services and other sources. Easily customizable seriesWith Telerik WPF Chart you can easily change the appearance of series: for example you can make the Bar series use Button controls to visualize data with a very simple change or just use cylinders, cones and even star-shaped bars for your charts. Animations, interactivityTelerik WPF Chart offers rich animations out of the box. In addition, the chart control offers a built-in camera tool allowing rotation and zooming into 3D charts. Tooltip supportTelerik WPF Chart allows adding tooltips to your charts for better visualization of your data. The tooltips can easily show the actual numbers behind the chart or even another chart. Save imageTelerik WPF Chart allows you to save any given chart as image and use it as you need. GridlinesTelerik WPF Chart features gridlines, which act as natural continuation of the tick marks and serve as visual guides making it easier to read data from the charts. Strip linesThe WPF Chart control introduces vertical and horizontal strip lines for 2D and 3D charts for improved readability for looking up individual values. With them the users can easily identify and highlight data that appears at regular intervals or in a specific key range for better understanding of the information presented in the chart. Flexible layoutRadChart offers support for multiple chart areas in a single chart control, with a smart legend that can aggregate data from all of them. Product ScreenshotsRelated LinksTelerik UI for WPF Chart Documentation Check out the other 140+ Telerik UI for WPF components:
Data Management File Upload and Management
Scheduling Editors Media
Data Visualization Layout
Navigation Interactivity and UX |


