OverviewThe Telerik UI for .NET MAUI Charts library is a robust data visualization tool that can be used to build native applications for Windows, macOS, Android and iOS. It includes over 14 distinct types of charts, all of which feature built-in support for selection, panning and zooming, tooltips, labels, annotations and more.
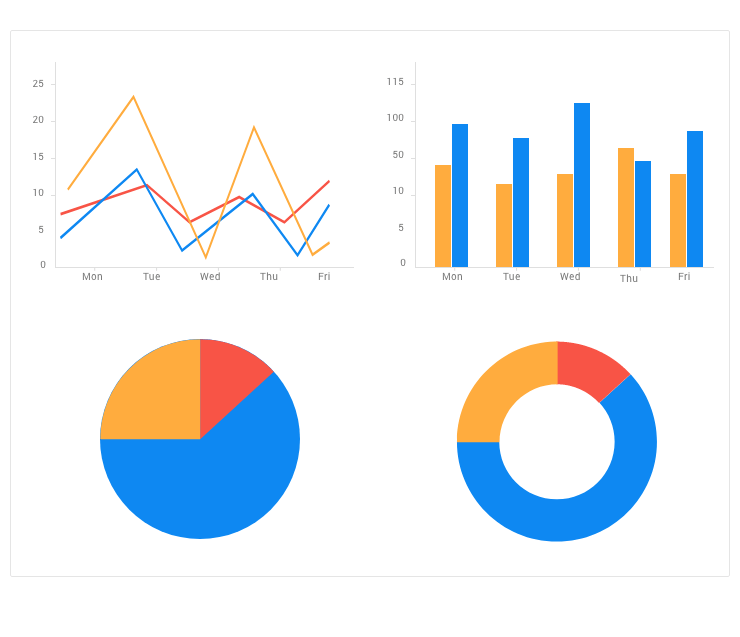
Extensive List of Chart TypesThe Telerik UI for .NET MAUI Chart library comes with a number of charts and series types. They function well as separate series types, and many of them can be combined and displayed in a single chart. The following chart types are available: Cartesian Chart Series
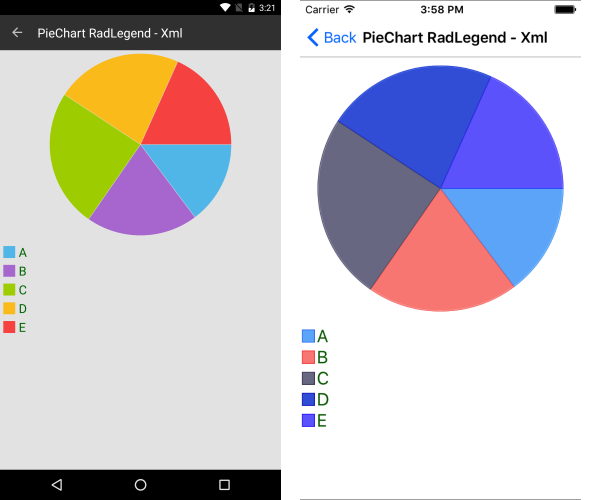
Pie Chart Series
Financial Chart Series
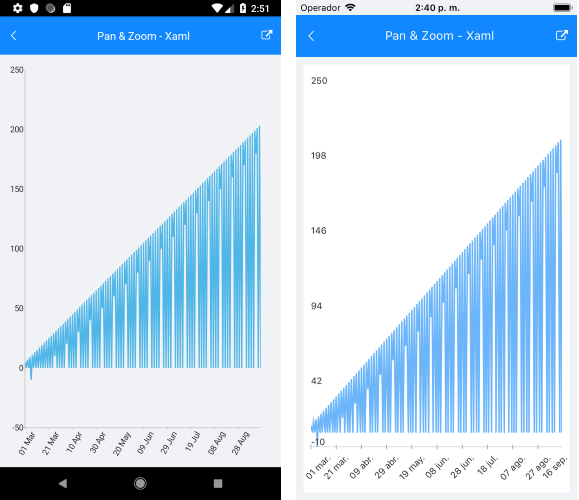
Multiple Axes and Chart Series on the Same PlotThe Cartesian Chart plots data points in a coordinate system defined by its two axes. Instead of having one axis type that serves multiple functions, multiple axes provide a hierarchy where each axis type exposes a specific functionality. Predefined axis types Data BindingThe Telerik UI for .NET MAUI Chart has an intuitive object model and public API that allow complex charts to be easily set up either in XAML or in code-behind. The Chart is completely data-aware as the binding mechanism of the component is used to create the appropriate data points from the raw data. Chart types and series are organized in hierarchies, depending on the coordinate system, used to plot data points. Panning & ZoomingThe Pan and Zoom behavior of the Chart handles the drag, pinch open, and pinch close gestures which respectively cause panning, zooming in, and zooming out of the associated chart plot area. This is useful when you are dealing with huge amounts of data and it is hard to focus on the important bits.
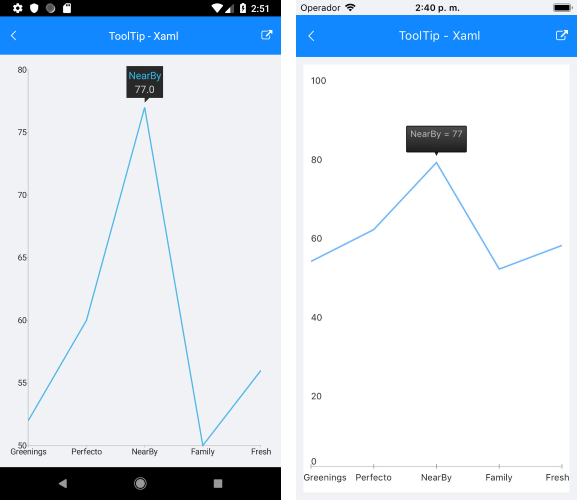
TooltipsThe Telerik UI for .NET MAUI Charts has built-in support for Tooltip across the various chart types. You can choose between a tap or hold gesture as a tooltip trigger.
TrackBallThe TrackBall behavior is responsible for showing information about several data points in a small popup that is displayed over its relevant data points. Additionally, a vertical line is drawn through the data points for more clarity.
SelectionThe Selection behavior of Telerik UI for .NET MAUI Chart offers a built-in user experience for selecting, deselecting and reporting either data points or series. In other words, the selection behavior can target data points, series or both if required. A single property may be used to allow single, multiple or no selection behaviors of the data points within the chart series. There is also a similar property that controls the selection behavior of the series within the plot area.
AnnotationsYou can display Annotations in the Telerik UI for .NET MAUI Chart. Annotations are visual elements that can be used to highlight certain areas on the plot area and to denote statistical significance.
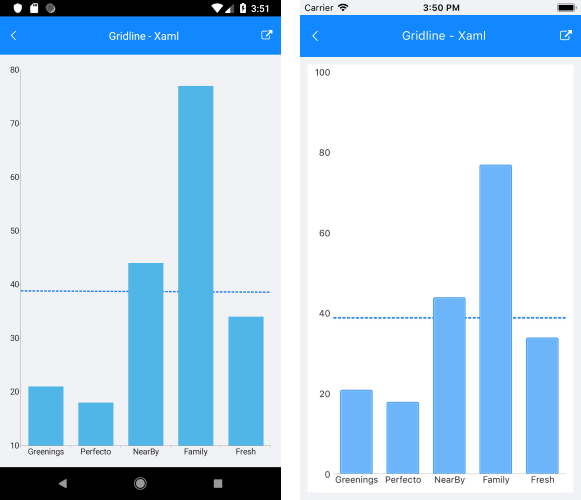
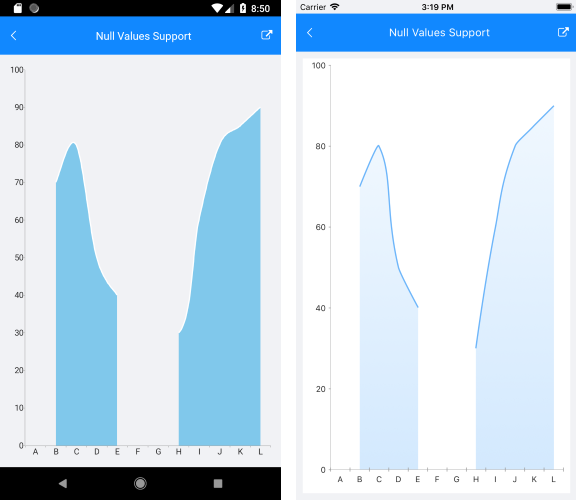
Cartesian Chart GridThe Cartesian Chart Grid represents a decoration over the plot area of the Cartesian Chart. It adds major lines connected to each Major tick of each axis. You can set the lines' visibility, thickness, color, a pattern of dashes and gaps and more. Null ValuesIn many scenarios, some of the data points that are visualized in the Chart contain empty or null values. These are the cases when data is not available for some records from the used dataset. In the case of the Cartesian Series, the Chart represents null data points with an empty space or gap. In the case of other chart types (Pie or Donut), these data points are not visualized.
LabelsThe Chart provides an option to display data point labels in the plot area. Labels may be seen throughout the Telerik UI for .NET MAUI Chart, including adjacent to series data points inside the chart area and on each of the displayed axes. LegendThe Legend feature of the Telerik UI for .NET MAUI Chart makes it easy to provide descriptions regarding the series which are visualized within the control. Additionally, you can customize the legend font size, font color, icon size and orientation.
Related Links
Are You Planning a Complex or Multi-Platform Project Soon?If Yes, Take a Look at Our Best Value OfferTelerik DevCraft is the most powerful software development tools collection for any platform and technology. It includes all Telerik .NET (MAUI, UWP, Xamarin, WPF, WinForms, WinUI, Blazor, ASP.NET Core, ASP.NET MVC, ASP.NET AJAX) and Kendo UI JavaScript (Angular, React, Vue, jQuery) UI component libraries for web, desktop and mobile, embedded reporting and end-to-end report management solutions, document processing libraries, automated testing for developers, C# mocking and unit testing tools. DevCraft will arm you with everything you need to deliver outstanding applications in less time and with less effort. With award-winning technical support delivered by the developers who built the products and a ton of resources and training, you can rest assured that you have a stable provider to rely on for your everyday challenges along your software development journey. More than 270,000 customers from 100+ countries trust us to move their business forward by relying on our components and tools. |