Telerik Charts for ASP.NET MVC - Over 20 Built-In Chart Types
- Client-Side Rendering for Optimal Performance
- Easy to Customize
 Features & Benefits Features & Benefits
Quickly add meaning to data with one of over 20 ASP.NET MVC charting types: bar, column, radar, pie, donut, line, area, bullet, scatter, bubble, box plot, waterfall, rangebar, funnel, polar, sparklines, candlestick and more. Telerik charts are rendered completely through JavaScript, thus reducing the amount of work performed on the server. Instead of rendering the entire image on the server and sending its markup to the client, the engine sends only the serialized data, which ultimately boosts the performance of your application. The Telerik ASP.NET MVC Charts support various data types. Depending on the chart type, you can distribute numerical data over categories (strings), units of time (DateTime) or other numbers. Check out the demos  Related Links Related Links
ASP.NET MVC Grid ASP.NET MVC Editor ASP.NET MVC Scheduler ASP.NET MVC Upload All Telerik ASP.NET MVC components
| Product Screenshots 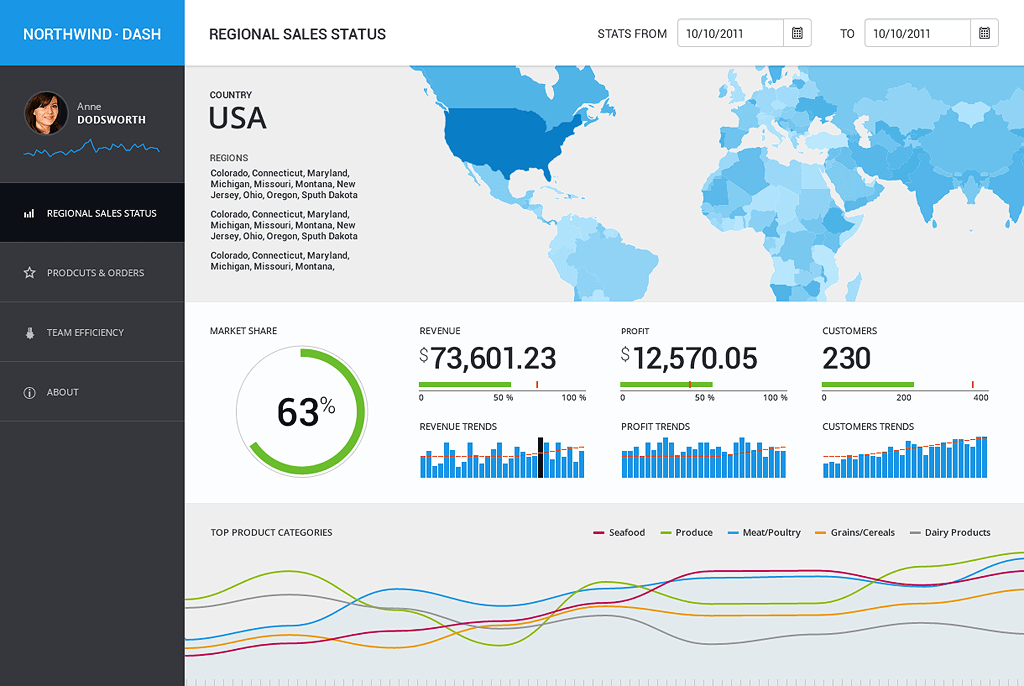

|
