Real-time data display Software .NET/VC++ Source Code Component Kit The quick and simple way to building real time data display Software with VC++, and the .NET platformE-XD++ and UCCDraw product walkthrough
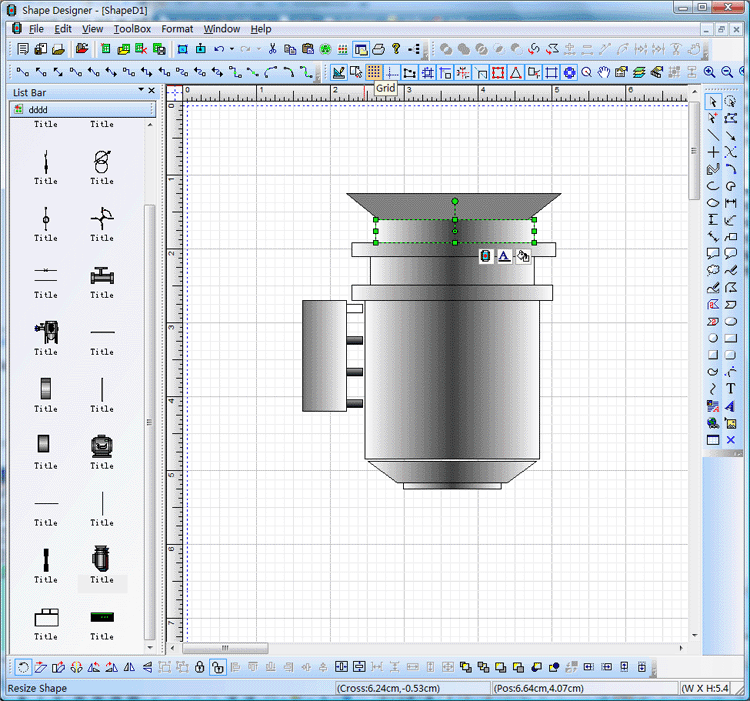
UCanCode Software Inc. is a leading provider ofHMI & SCADA,CAD,UML,GIS and Data Visualization Graphics for software developers more than 40 countries around the world! UCanCode provides a complete set of services, consisting of designtools and a software development kit (SDK), for developers who want to create a user interface for industrial monitoringand process control drawing real time data display applications. These displays feature highly customized graphical objects that connect to underlying real-world data. Developers prefer ucancode's solutions because they are easy to use, completely customizable, and can deploy to both the desktop and the Web. ucancode is the industry’s leading real-timeSPC software, automating quality data collection and analysis Add Diagrams and real time data display to your applications. E-XD++ Diagrammer brings accurate and intuitive diagrams and dashboards to your c++ desktop applications. It offers a comprehensive set of tools, components and graphic objects for creating visualization, editing and monitoring Windows applications. It is very quickly and easily to use E-XD++ to build anyreal time data display Software: 1. Design the real time data display symbols: With E-XD++ full edition, there is a shapedesigner application shipped, with this diagramming tool, you can use many advance features to build any kind ofreal time data display Software symbols, as below: When one composite symbol is designed, just use Copy/Paste to place it within the toolbox window at left side. Thesereal time data display Symbols will be ready for use in future. 2. Design real time data display Software Screen:
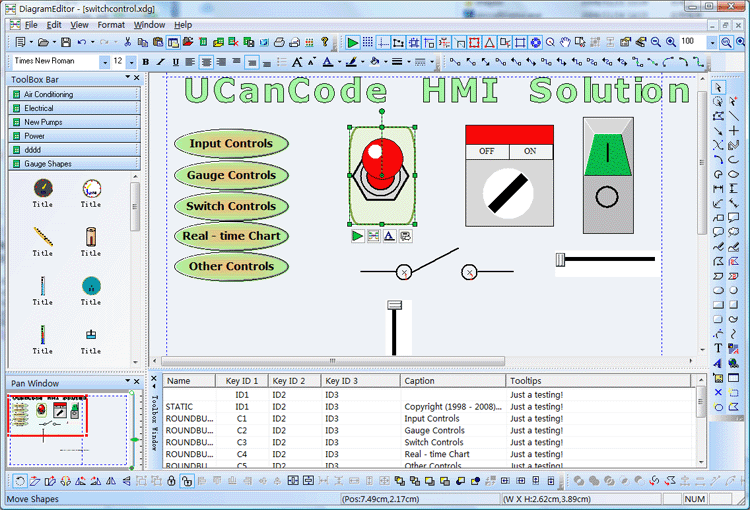
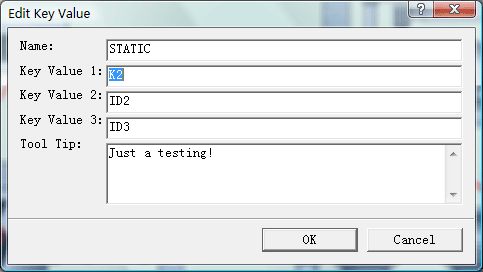
With E-XD++ full edition, there is also a ready to usereal time data display Screen design tool shipped, with this tool, you can use any symbols within the toolbox window at left side to build any screen as you want, just drag and drop, very simple and easy: If you want to identify any shape on the screen, just use the following dialog to define some key value. There are three key values that can be used to do this work, as below:
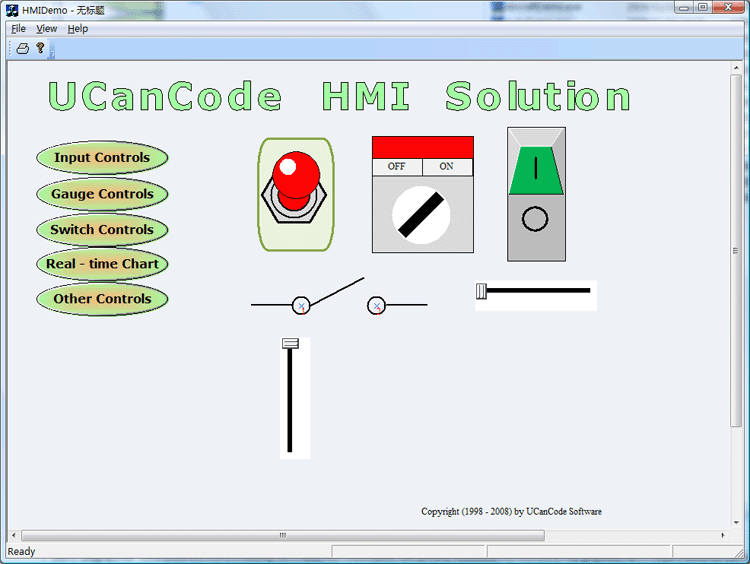
We change it's key value 1 to K2. After one real time data display Software Screen is finished, you can save it to a xdg file. You can design as many screen as you want. 3. Building your real time data display Software: With full edition of E-XD++ Visualization Component, there is an appwizard that will help you building a base framework of real time data display Software without written a line of codes, after the base framework of your application is finished, you can import any XDG files into your application, (Please remember the resource type must be XDGRes), to load areal time data display Screen just call the following codes, it is very easy: LoadXdgFromResource(IDR_MAIN, _T("XdgRes"), FALSE); In fact, this line of code can be called at any place if you want to load any new screen at any time. 4. Update the screen with data:
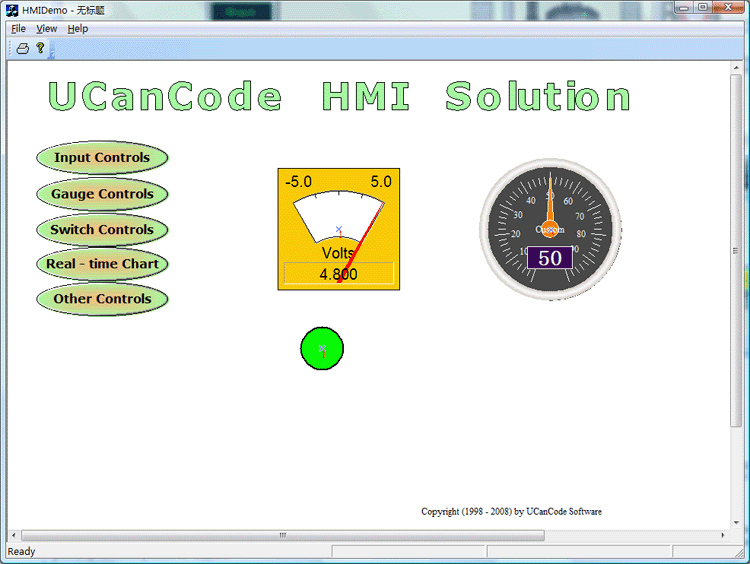
Mostly we can use the WM_TIMER of CWnd to recieve the data and refresh thereal time data display Screen, if you want to update only one shape, just call UpdateControl of this shape, but if you want to update a list of shapes one time, we recommend you to call UpdateShapes, this will works more effective If you want to handle the click event, you can DoButtonClickEvent to do that. That's all, below is the running - time mode of this sample. and
|


