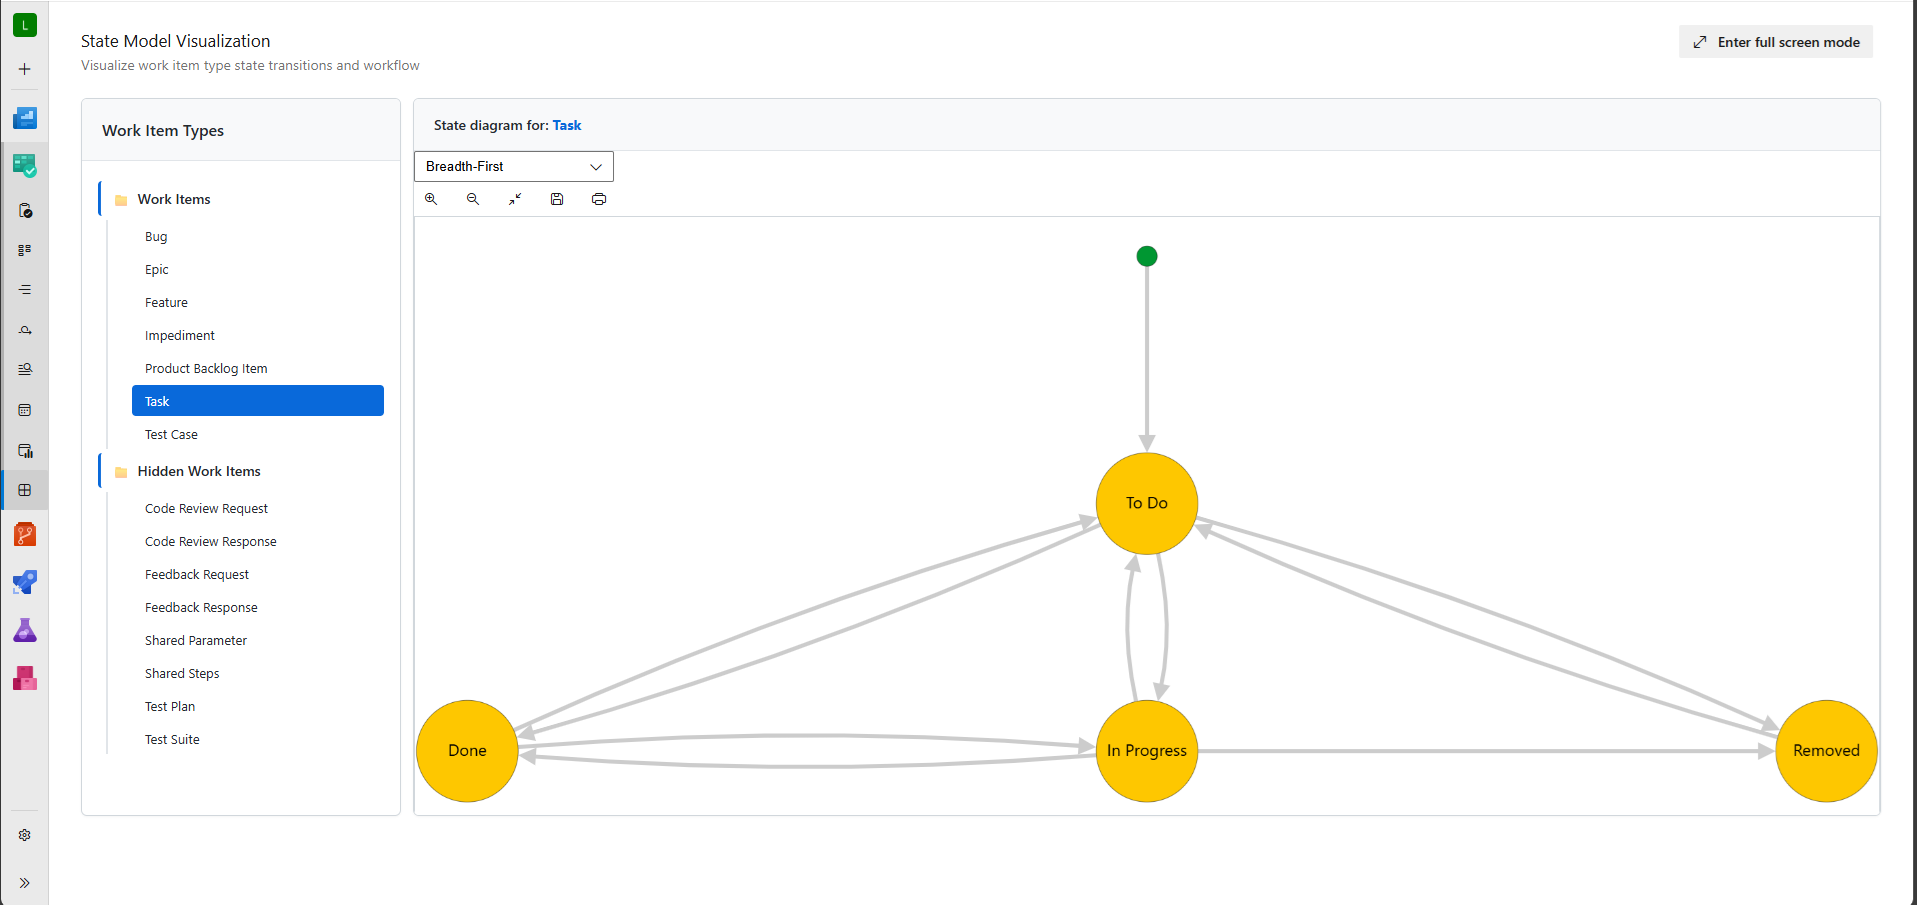
Skip to content
| Marketplace
Sign in
Azure DevOps>Azure Boards>State Model Visualization
State Model Visualization

State Model Visualization

Taavi Kõosaar

|
7,189 installs
| (10) | Preview
Visualize work item type state transitions in interactive diagrams. View state models, transitions, and workflow for any work item type in your Azure DevOps project.
Get it free

Modern Azure DevOps State Diagram Visualization

v2.0 Preview - Completely modernized extension built with React, TypeScript, and Azure DevOps UI components.

Visualize work item type state transitions and workflows in interactive diagrams. Every work item type in Azure DevOps has states, transitions, and reasons defined. With this extension you can visualize those states and transitions for both regular and hidden work item types with advanced layout algorithms and modern UI.

Visualize

✨ What's New in v2.0
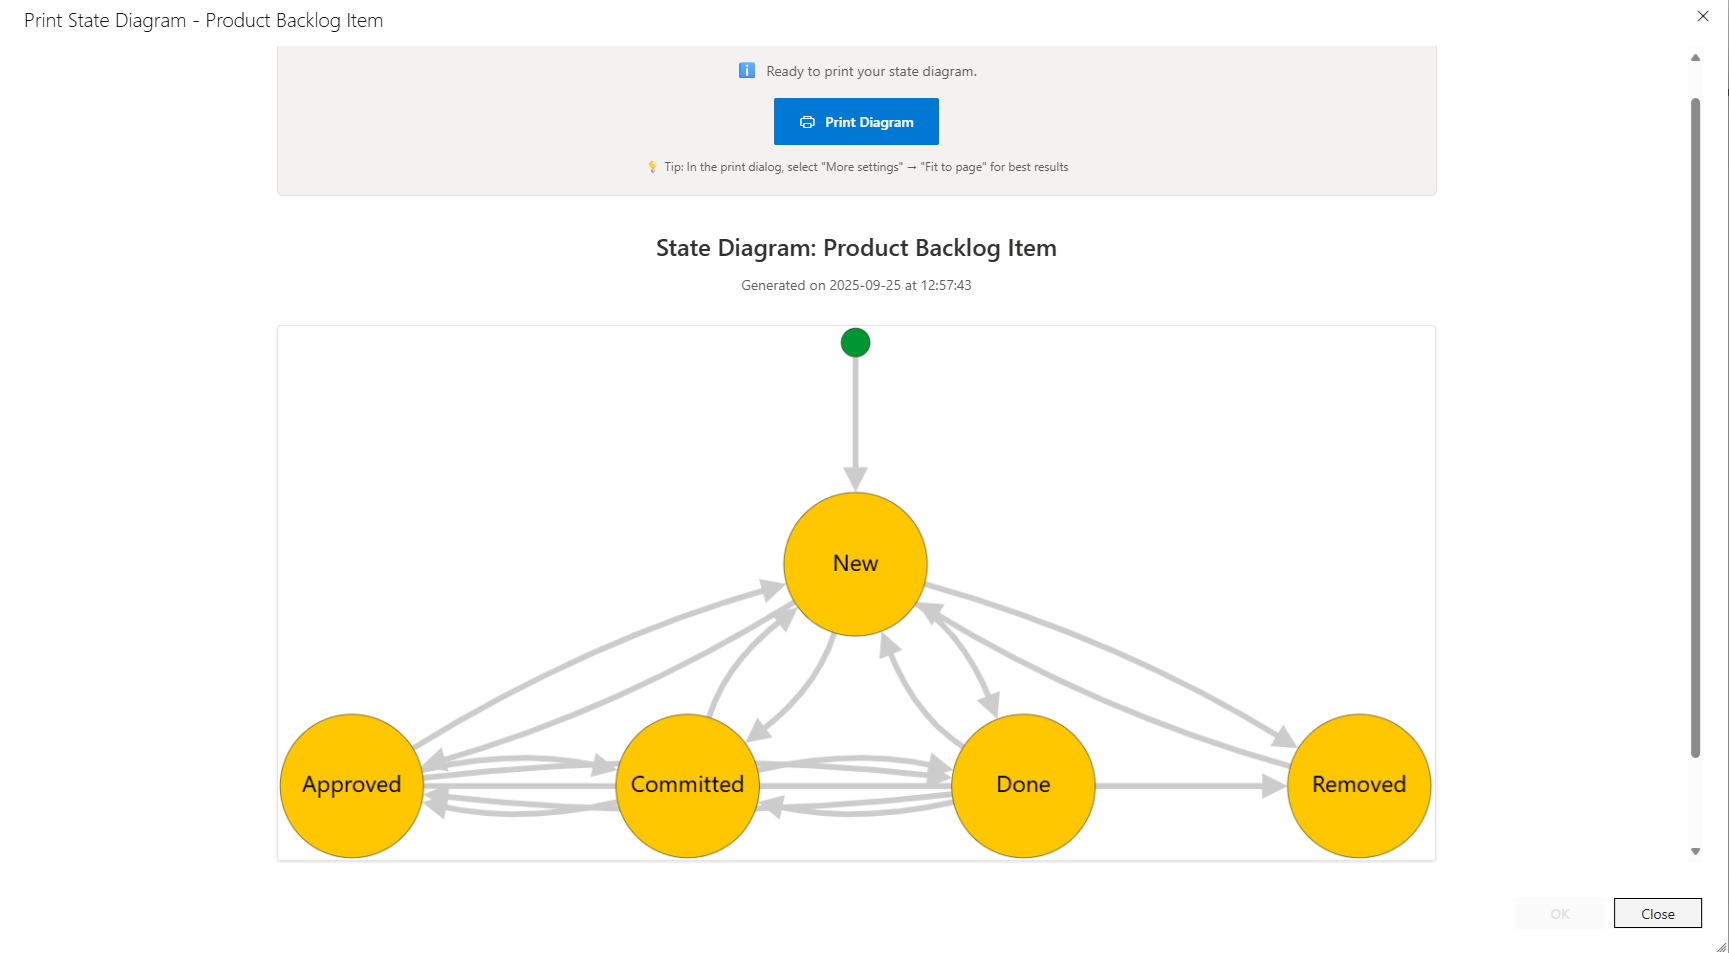
  • 🎨 Multiple Layout Algorithms - Choose between breadthfirst, concentric, and dagre layouts for optimal visualization
  • 🧠 Smart Positioning - Advanced node ranking system with intelligent initial state placement
  • 🎯 Modern UI - Built with Azure DevOps UI components for consistent experience
  • 📤 Enhanced Export - PNG export and print dialog with optimized formatting
  • ⚡ Real-time Layout Switching - Switch between algorithms without reloading
  • 🔍 Improved Navigation - Responsive design with better work item type organization

Export and Print

Export your state diagrams as PNG images or use the integrated print dialog for documentation. Drag nodes to reposition them for optimal layout before exporting or printing.

Export

🚀 Quick Start

Main Hub Visualization

  1. Navigate to your Azure DevOps project
  2. Go to Boards > State Visualizer
  3. Select a work item type from the tree view
  4. Choose your preferred layout algorithm (breadthfirst, concentric, or dagre)
  5. Use toolbar buttons to zoom, fit to screen, export, or print

From Work Item

  1. Open any work item
  2. Click ... (more actions) > State Diagram
  3. View the state diagram in a full-screen dialog

⚠️ Preview Notice

This v2.0 preview has been tested with Azure DevOps Services but not with Azure DevOps Server.

Need help testing on Azure DevOps Server? If you're using Azure DevOps Server, please try this extension and report any issues on GitHub. Your feedback helps ensure compatibility across all Azure DevOps platforms.

v1.3.8 will remain available where compatibility cant be maintained.

🎯 Upcoming Features

Based on community feedback and Azure DevOps API capabilities, these enhancements are planned:

  • 🎨 State Colors - Use official Azure DevOps state colors in diagrams
  • 🔲 Work Item Type Icons - Display work item type icons and colors
  • ⚡ Transition Actions - Show required actions and reasons for state transitions
  • 🔍 Smart Filtering - Filter disabled work item types with opt-in toggle
  • 🎨 Enhanced Theming - Complete Azure DevOps design system integration

💬 Feedback & Support

Love this extension? Please leave a review! Have suggestions or found an issue?

📝 Report Issues - Help improve the extension

⭐ Leave a Review - Share your experience

📚 Version History

v2.0 Preview (Current)

  • Complete rewrite with React + TypeScript
  • Multiple layout algorithms with smart recommendations
  • Advanced node ranking and positioning system
  • Modern Azure DevOps UI components
  • Enhanced export and print functionality

v1.3.8 (Legacy)

  • Final version of the original JavaScript implementation
  • Available on releases/v1.3.8 branch
  • ⚠️ No longer maintained

Learn more

The source to this extension is available on GitHub: StateModelVisualization.

  • Contact us
  • Jobs
  • Privacy
  • Manage cookies
  • Terms of use
  • Trademarks
© 2025 Microsoft