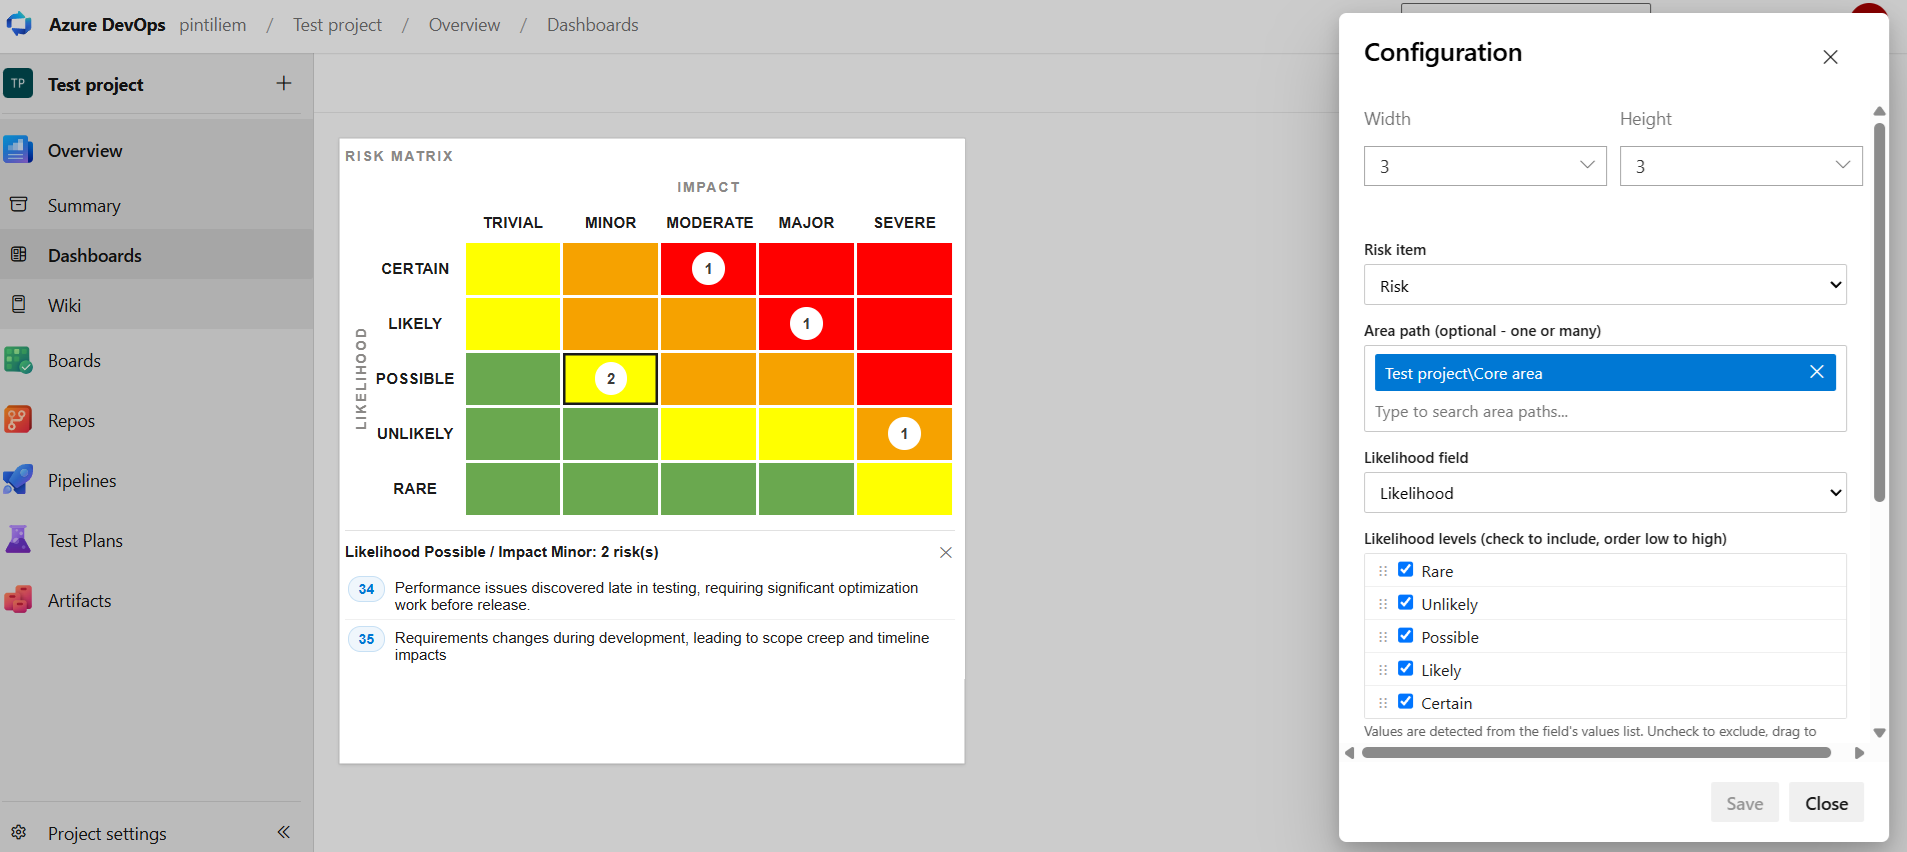
Risk Matrix WidgetDashboard widget that visualizes open Risk work items as a Likelihood x Impact matrix with counts per cell. |

Risk Matrix WidgetAn Azure DevOps dashboard widget that visualizes all open Risk work items as a Likelihood x Impact matrix. Each cell shows the count of open risks that fall into that Likelihood/Impact combination, and is color-coded (green/yellow/orange/red) using the same qualitative risk-rating scheme as a standard risk matrix.
Features
ConfigureAfter installing the extension and adding the Risk Matrix widget to a dashboard, open its configuration to set the work item type, field names, and level names to match your project's Risk work item type. FeedbackPlease feel free to ask questions or provide any suggestions for improvement. |