Be proactive
Monitor and detect issues in your apps and services without ever leaving VSTS! Just put an Application Insights Widget on your VSTS dashboard, and keep tabs on how your resources are performing. Need to track several metrics or even multiple apps? No problem - just add widgets to your dashboard again as needed. There are now two types of widgets available to you: metric and chart.
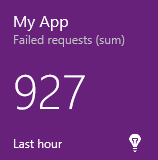
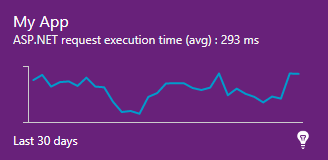
The Metric Widget allows you to examine the specific value of a metric, as well as giving you the capability to set a warning or critical threshold for that metric so that you can be visually alerted if there is an issue. The Chart Widget gives you the capability to examine a metric over time via a line, column, or area chart.
Configuration
Installation
After you install the widget in your account, you will need to add the widget to your dashboard. If you are unsure how to do that, please see the following documentation:
Depending upon which widget you choose, you will have slightly different configuration options. First, let’s review the settings that are common to both widgets:
- Title: the title you'd like to display at the top of the widget. We suggest that you make this the name of your resource, but you can choose any description you'd like.
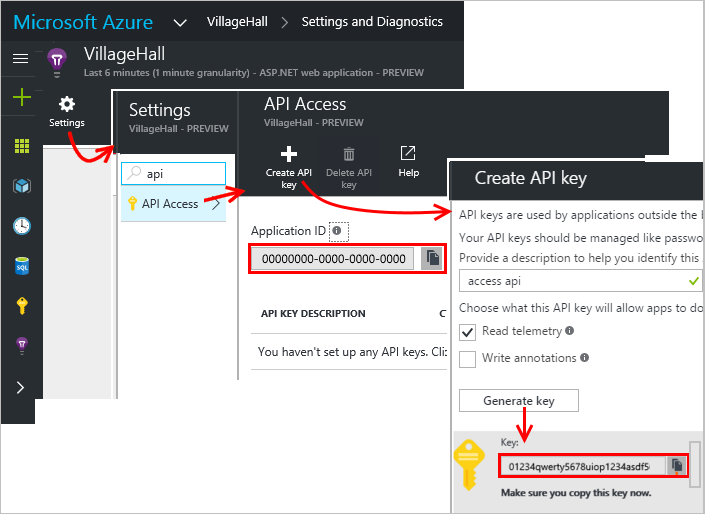
- Application Id: copy this from the Azure portal. It can be found in Settings, API Access.
- API Key: can be created as needed. This should also be copied from Settings, API Access in the Azure portal:
- Metric: the Application Insights metric you want to track with the widget (e.g., Server Response Time)
- Aggregation: determines how you track your widget (e.g., sum, average). The widget will only display valid aggregation options for the metric you have selected.
- Time Range: the period of time over which you plan to track your metric (e.g., last 24 hours).
- URL: contains the destination link to where you will navigate if you click on the widget. The default value is the Azure portal.
Settings specific to the Metric Widget:
- Warning threshold value: defines the value at which the widget will turn orange to indicate a warning. Check the box to activate it, then select how the threshold is triggered (e.g., "greater than") followed by the value that denotes the threshold.
- Critical threshold value: defines the value at which the widget will turn red to indicate a critical scenario. Check the box to activate it, then select how the threshold is triggered (e.g., "greater than") followed by the value that denotes the threshold.
Settings specific to the Chart Widget:
- Size: determines the size of the widget on your dashboard. The widget can be any size between 1X1 and 4X4.
- Time granularity: some time range selections allow you to further choose the granularity of the data (e.g., hourly or daily).
- Chart type: specifies the type of visualization for the chart. Options are line (default), area, or column.
Notes:
- The metric and aggregation drop downs will be automatically populated after providing a valid Application Id and API Key.
- For the metric widget, when supplying a value for warning and critical thresholds, it should be expressed using the unit type for that metric. For example, the "Available memory" metric has a unit of bytes. To trigger a change based upon crossing a threshold of 1 KB, enter the value 1024.
- If you exceed any query limits, the widget will turn gray in order to denote that it is disabled. This will make it clear to you that the widget cannot currently update. To resolve a query limit issue, either refresh the widget after the time specified in the error message, upgrade your plan, or generate an additional API key if you are hitting the limits often.
Support
If you encounter an issue with this widget, please post your question on the Application Insights forum.
If you have any feature recommendations, please enter your suggestion in the Application Insights UserVoice site.

