Quality & Delivery Monitor
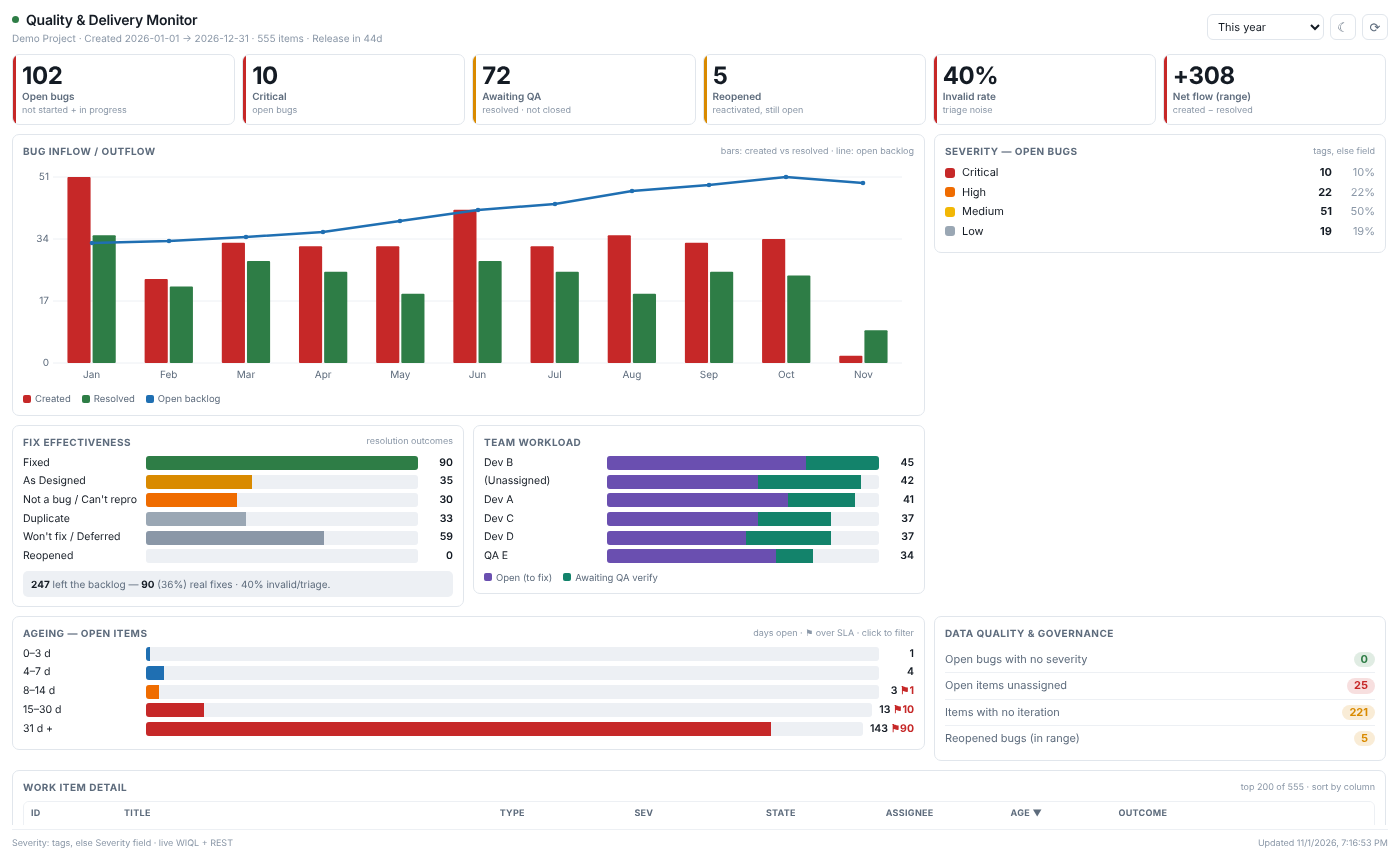
A bug and work item dashboard widget for Azure DevOps. It gives delivery leads and management one live view of quality and release readiness for the dashboard's project.
What it shows
- Six KPIs, colour-coded: Open bugs · Critical (and Blocker, when tagged) · Awaiting QA · Reopened · Invalid rate · Net flow for the selected range
- Bug inflow / outflow: created vs resolved per day, week or month (picked from the range), with an open-backlog line and an optional release marker
- Severity mix of open bugs and fix effectiveness: Fixed, As Designed, Not a bug / Can't repro, Duplicate, Won't fix / Deferred, Reopened
- Team workload: items to fix vs awaiting verification, per person
- SLA ageing: open items by age, with ⚑ for items past their SLA
- Data quality: open bugs without severity, unassigned items, items with no iteration, reopened bugs
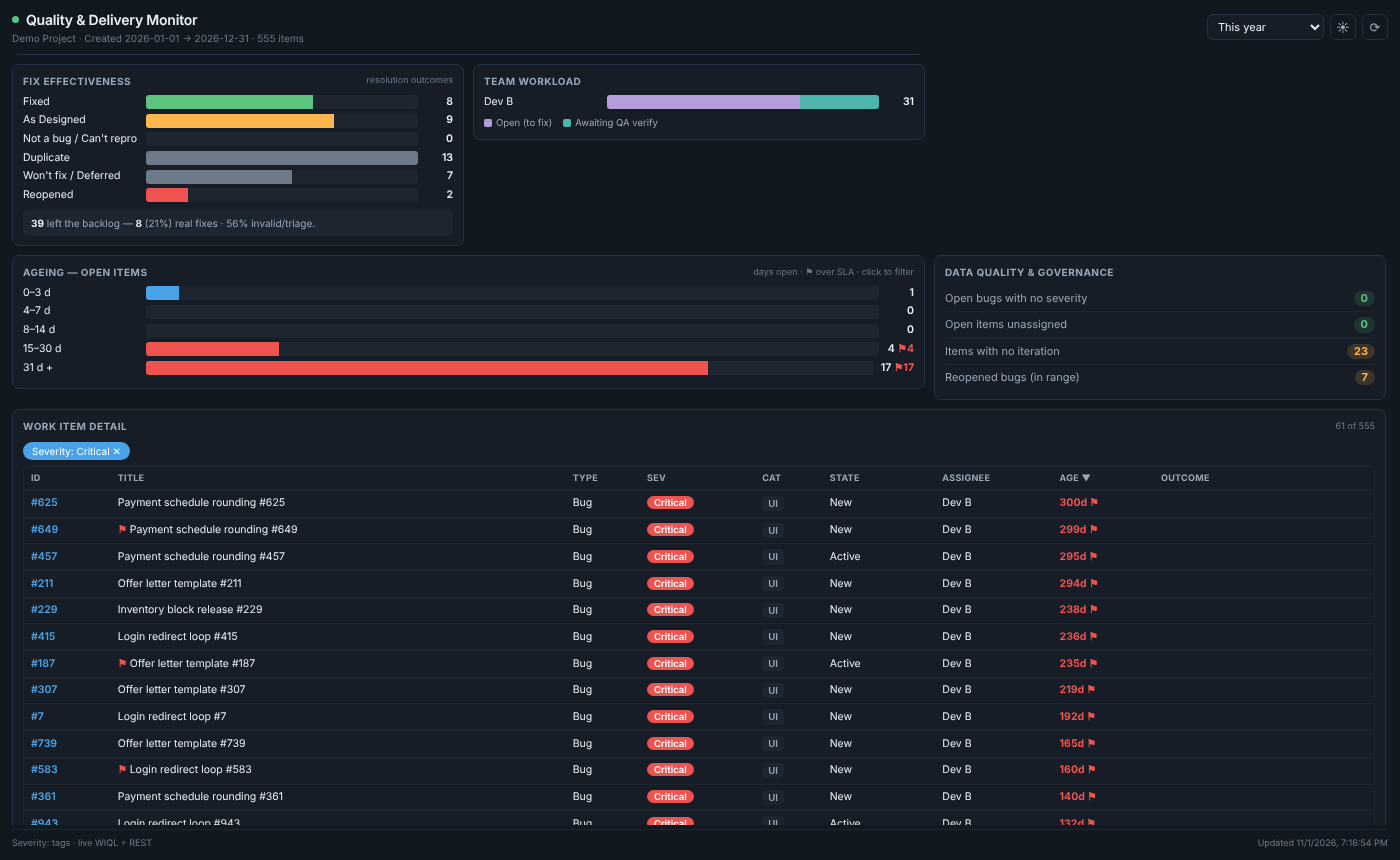
- Drill-down grid: sortable, up to 200 rows, one click opens the item in Azure Boards. Click any bar to cross-filter the whole widget.
Works with your process
- Agile, Scrum, CMMI, Basic and inherited processes. Open, resolved and completed are read from each work item type's state categories, so custom states are handled. Older servers fall back to the standard state names.
- Work item types come from the project's Bug, Requirement, Task and Feature categories (for example User Story, Product Backlog Item or Requirement).
- Severity source is configurable: tags then the Severity field (default), the Severity field only, or tags only.
- Reopened counts bugs reactivated through the standard Reasons (Reactivated, Regression, Not fixed), plus optional title keywords you configure.
- Awaiting QA applies to processes with a Resolved state. It shows "—" where the process has none (for example Scrum).
Date filter
The header filter applies to Created date. The default is this year. Presets cover year to date, this and last quarter, this and last month, the last 30 and 90 days, last year and all time, plus a custom From / To range. Each viewer's choice is remembered in their own browser.
Add the widget to a project dashboard, resize it (up to full width), click the gear and set:
| Setting |
Default |
| Default date range |
This year |
| Severity source |
Tags, else Severity field |
| SLA days (Blocker / Critical / High / Medium / Low) |
1 / 2 / 3 / 5 / 10 (defaults; adjust to your own SLAs) |
| Reopen keywords in title |
none |
| Release / target date |
none |
| Default theme |
Auto (viewers can switch light / dark) |
Requirements
- Azure DevOps Services, or Azure DevOps Server / TFS 2017 and later. Per-type state categories need Azure DevOps Server 2019 or later; older versions use the standard state names.
- No Analytics extension, no PAT and no service account.
Privacy and permissions
The widget runs in the viewer's browser with the read-only vso.work scope and the viewer's own permissions. Each person sees only the work items they can already read. No data is sent anywhere other than your Azure DevOps organisation or server. The browser stores only display preferences (theme and date range).
Support
Questions and feature requests: use the Q & A tab on this page.
© Metadata Technologies
| |