#New Relic Dashboard Widgets#
This extensions contains a collection of dashboard widgets that can be added to a dashboard in order to
display various metrics from New Relic.
Note: These widgets are neither developed nor endorsed by New Relic.
Release Notes
1.1.0
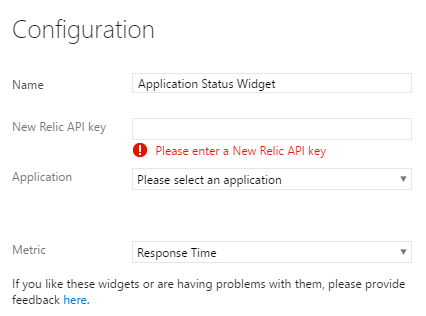
Improved user experience of the configuration page
Configuration page now uses out-of-the-box styles
Invalid API keys are now indicated on the configuration page
Added a visual indicator for the loading of applications/servers
Added a hint to the widgets themselves that they need to be configured
1.0.8
Better error handling, for example if applications or servers no longer exist in New Relic
1.0.5
Use out-of-the-box styles provided by Visual Studio Team Services
Supported widgets
The following widgets are currently supported:
Server Status Widget
Application Status Widget
Server Status Widget
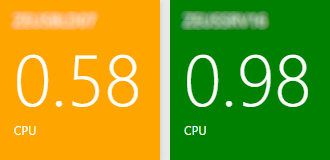
This widget displays the current health status of a specific New Relic server, as well as a (configurable) key metric of that server.
The following configuration options are available:
Name - Name of the widget as it is displayed on the dashboard.
API Key - A New Relic API key that can be used to access the New Relic API.
Server - After entering a New Relic API key this list will be populated with the available servers in your account. Then choose the server you want to see.
Metric - Finally choose the metric you want displayed on the widget. The following options are available:
CPU
Disk I/O
Memory
Fullest Disk
Application Status Widget
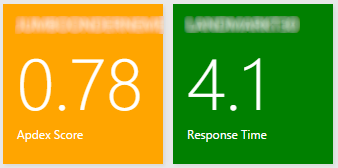
This widgets displays the current health status of a specific New Relic application, as well as a (configurable) key metric of that application.
The following configuration options are available:+1:
Name - Name of the widget as it is displayed on the dashboard. Use the default name of Application Status Widget to display the application's name on the dashboard.
API Key - A New Relic API key that can be used to access the New Relic API.
Application - After entering a New Relic API key this list will be populated with the available applications in your account. Then choose the application you want to see.
Metric - Finally choose the metric you want displayed on the widget. The following options are available: