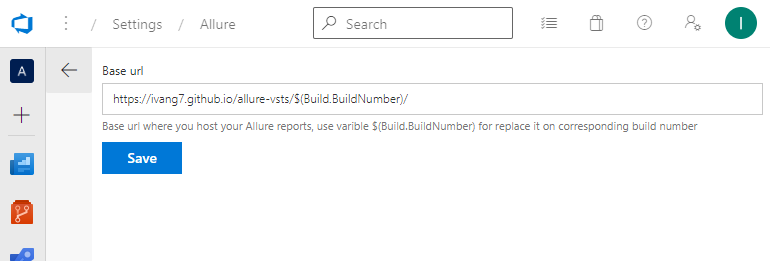
This extension allows you to generate and view Allure test reports right from the Visual Studio Team Services interface. Please note that due too some limitation in the current version of Team Services API the Allure Generate Build Step will only generate the Allure report and save it as a build artifact. To enable "Open Allure Report" option you will need to add additional build step to publish the report somewhere. For instance you can create a simple Azure Web App (or use github pages) and upload reports there using Build Task extension like FTP Upload. You website should support HTTPS. Please note If you use Azure Website or IIS in general some file types used by Allure are not enabled by default. Please, add mimetypes as shown below to your web.config in order to enable support of .json and .woff file types. When you have your website up and running we will use url like [BaseUrl] to open a report for the corresponding build. You will need to set BaseUrl property on the Allure settings page in the Project settings:
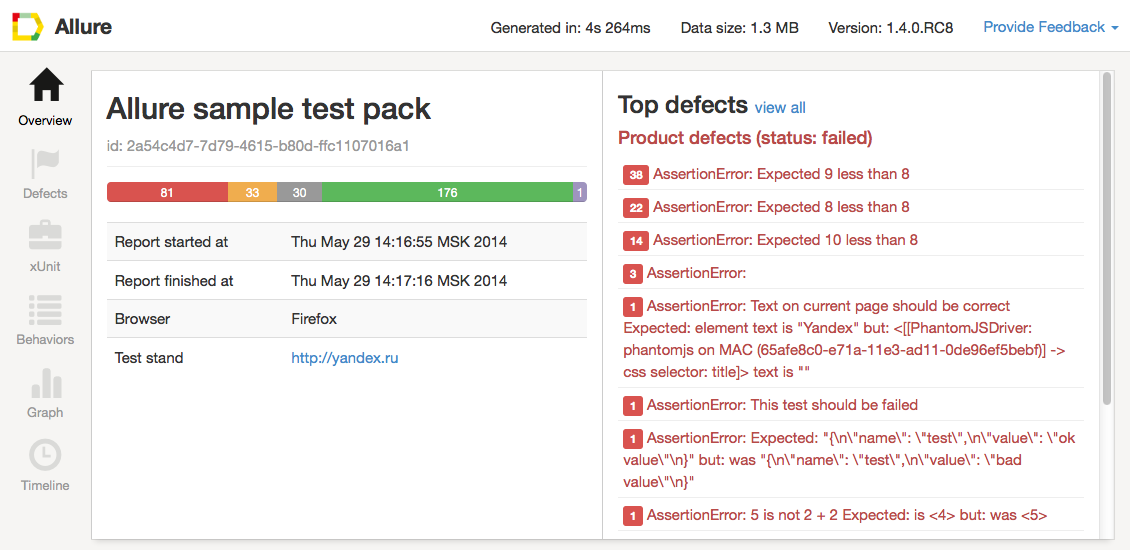
Why to use AllureThere are lots of cool testing frameworks for different programming languages. Unfortunately only few of them can provide good representation of test execution output. Allure is an open-source framework designed to create test execution reports clear to everyone in the team. How it worksAllure is based on standart xUnit results output but adds some supplementary data. Any report is generated in two steps. During test execution (first step) a small library called adapter attached to testing framework saves information about executed tests to XML files. We already provide adapters for popular Java, PHP, Ruby, Python, Scala and C# test frameworks. During report generation (second step) XML files are transformed to HTML report. This can be done with command line tool, plugin for CI or build tool. See examples and documentation for more details. How it looks likeOverview page shows overall test execution statistics with a list of test parameters. Right section contains top defects grouped by defect message.
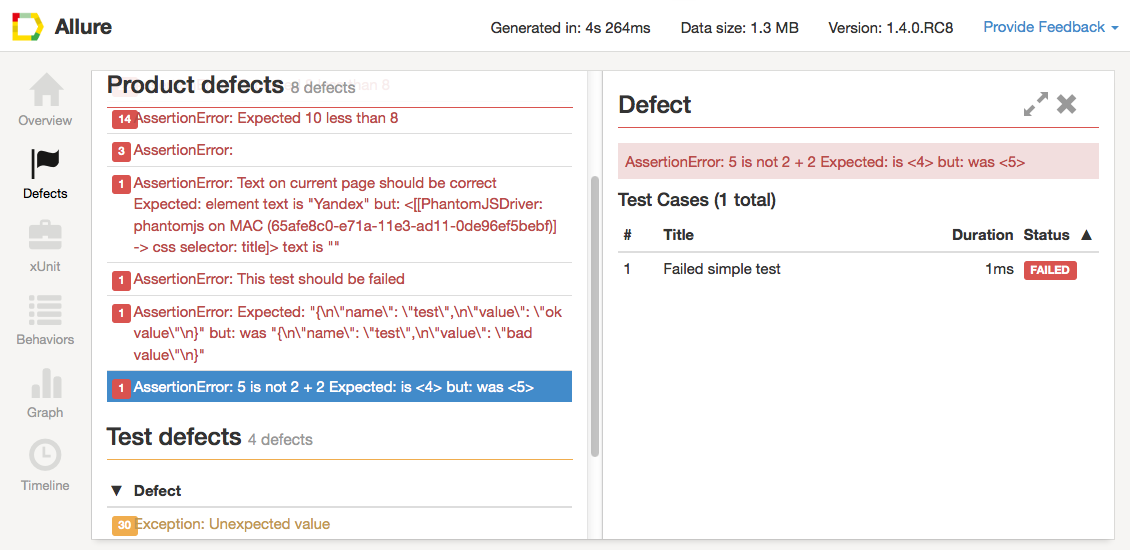
Defects page gives detailed list of defects revealed during test execution. We distinguish product defects which correspond to failed tests and test defects - correspond to broken tests.
xUnit page shows statistics in terms of xUnit. You can view test statistics for each test suite and detailed information about every test case.
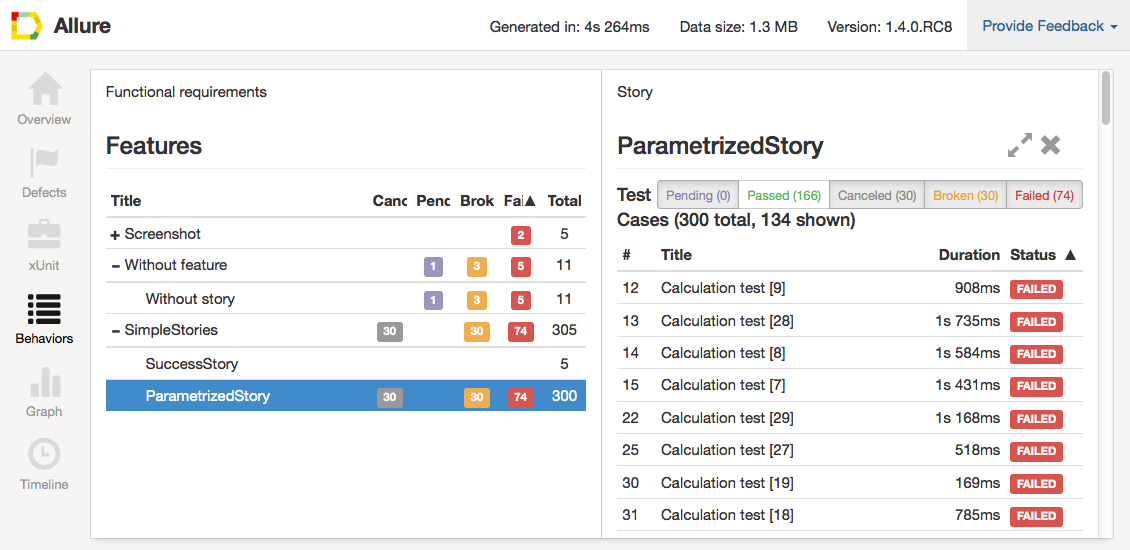
Behaviors page groups test data in terms of BDD. You can easily view which features and stories have problems.
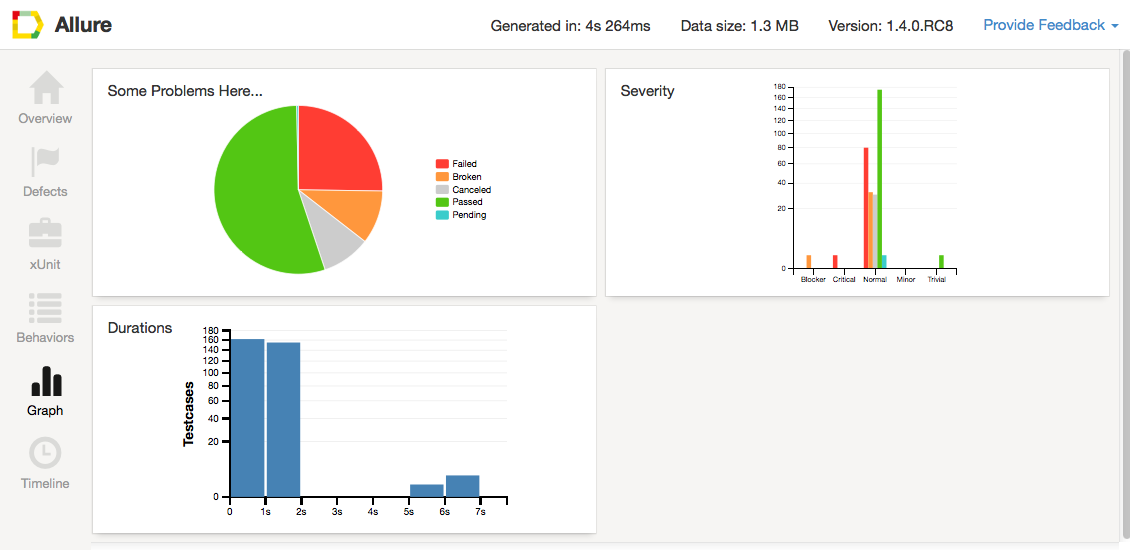
Graphs help you to visually estimate test results.
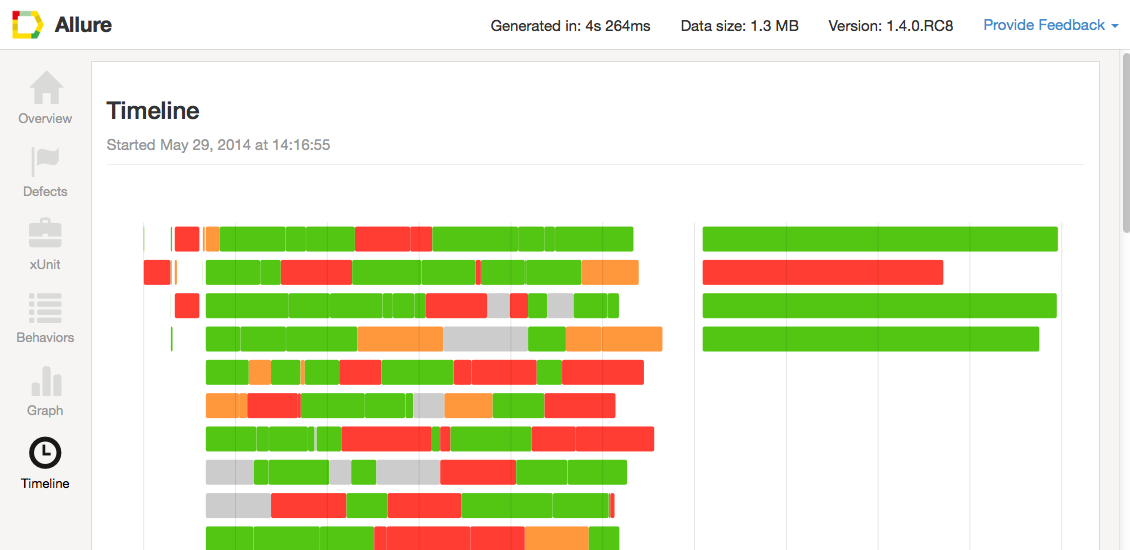
Timeline page shows in which moment of time every test case was executed and how long it was running.
|


