D0
D0 adds features that show the state of your application live and provides step predictions for stepping through C/C++ code.
Website: https://d-0.dev
Purchase: https://d-0.dev/pricing
Features:
View execution flow live from the Visual Studio editor:
- Attach the Visual Studio debugger to the target process.
- Navigate to the file you want to view its flow. It may take a second before the highlighted lines appear.
- If a line is not executing anymore, the line background will change its color to blue, indicating that it previously executed.
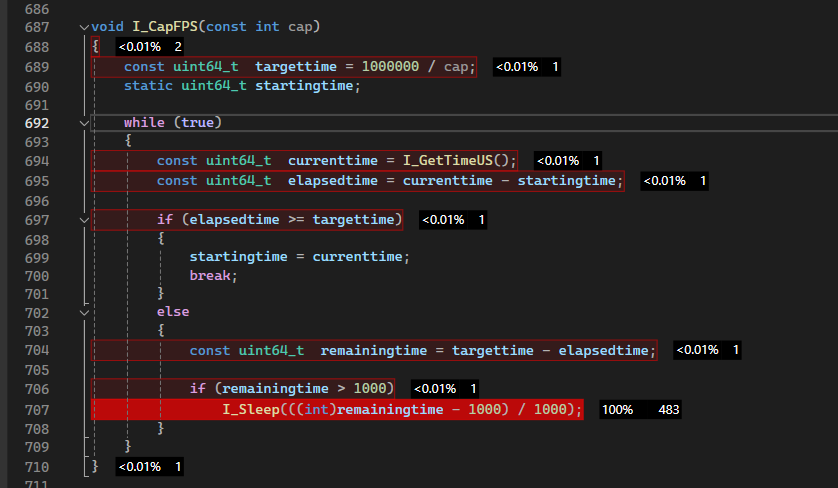
Profile C/C++ code live, line by line:
- Go to Extensions, D0 and tick the Live Profiler option.
- Attach the Visual Studio debugger to the target process.
- Select the function you want to profile by setting the editor cursor anywhere inside it.
- The extension will show you a live heatmap of which lines take the most time currently. Hover over the inline precentage box to get more detailed information.
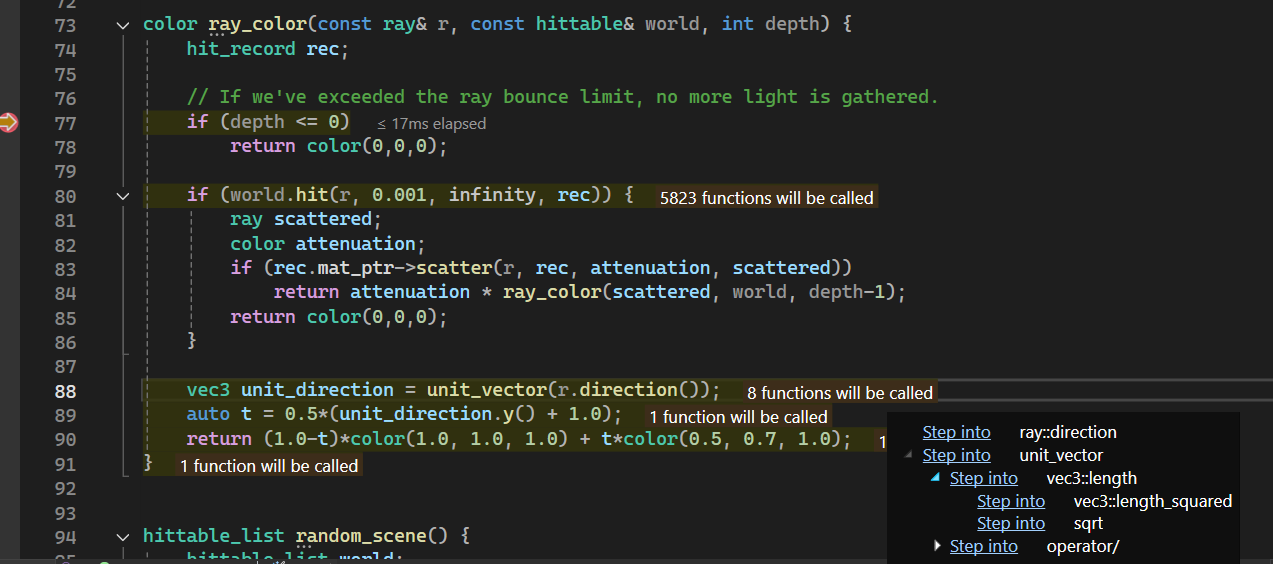
Use step predictions to see where you will be stepping next:
- Place a breakpoint in Visual Studio.
- When a breakpoint is hit, the extension will show a yellow highlight of lines which will be executed next.
- If a line executed functions, you can browse them by clicking the decoration on the right of the line and expanding the call tree.
- If you'd like to step into a specific function invocation from current location, click the "step into" button.
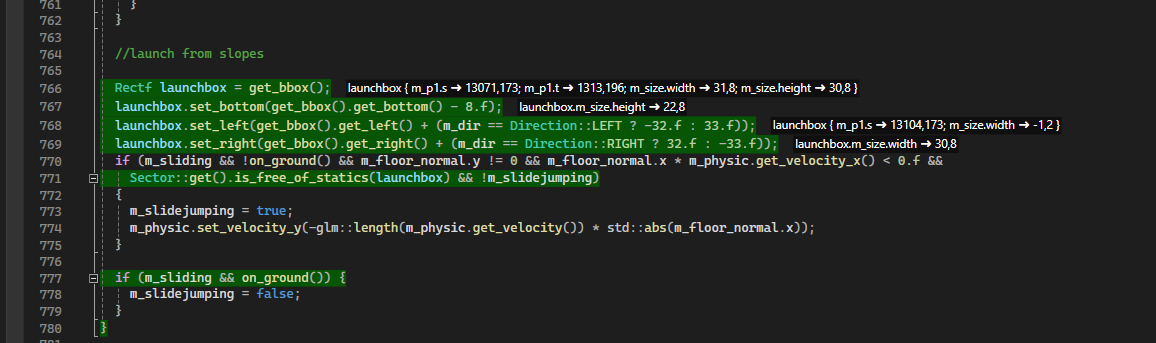
View inline variable changes from the Visual Studio editor:
- Attach the Visual Studio debugger to the target process.
- Place the cursor anywhere in the function in which you want to view the variable changes. The extension will show changes to variables that happened on each line in real time.
- If the instrumentation of the function is causing performance issues in your debugged application, you can toggle it anytime in the top VS menu: Extensions, D0, Show inline variable changes.
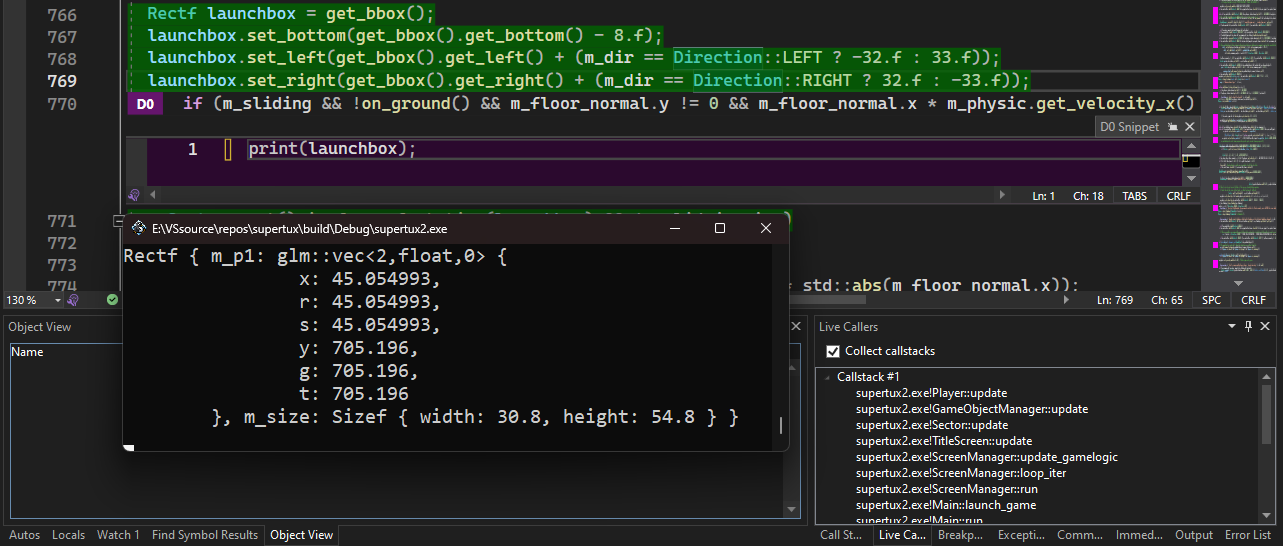
Insert a new Angelscript scripting snippet:
- Place the cursor on the line you want to insert a code snippet.
- Right click on the line, and choose "Insert D0 snippet"
- To print an object to the console write:
print(object);, and save the file to compile the snippet.
- To print an object to the Visual Studio console, write
log(object);
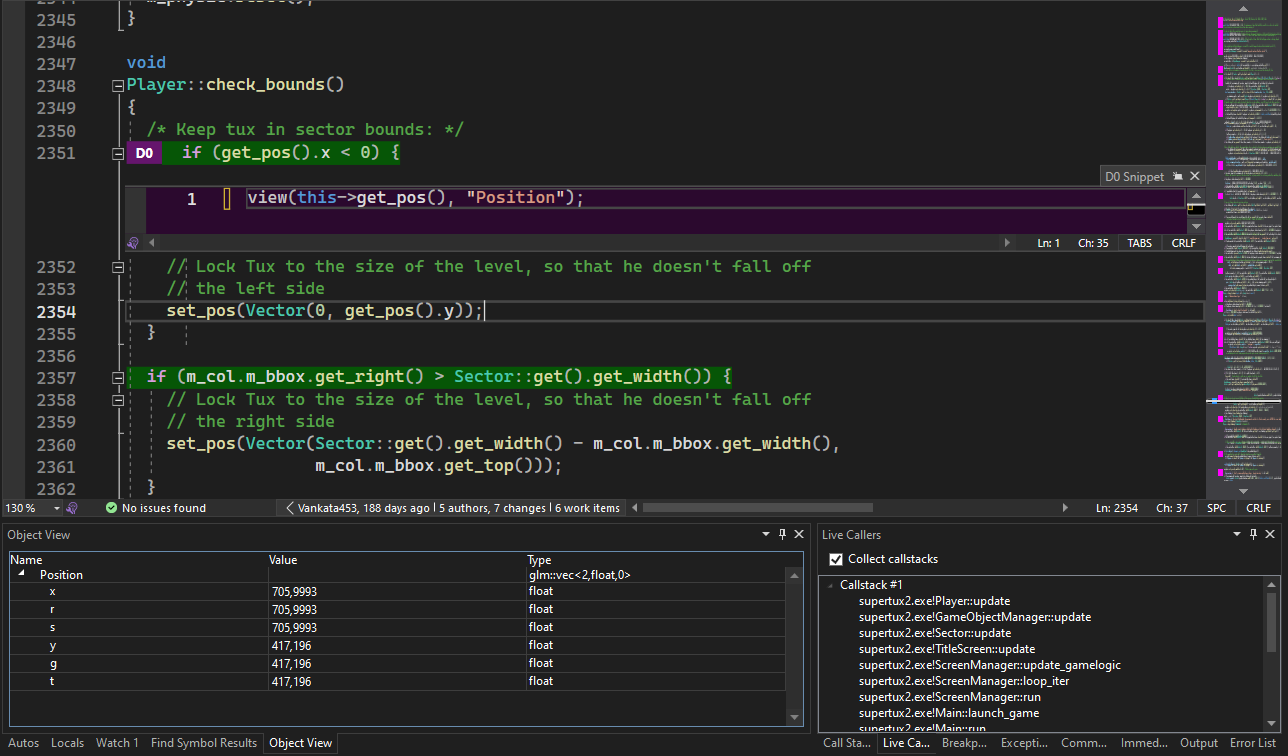
- To view all objects within the current scope, write
view();. To bring up the Object View, from the top Visual Studio menu choose Extensions, D0 and Show Object View. If you need to view a specific object, use view(object);.
D0 will apply changes automatically, without recompiling your program.
View live call stack and return value of a particular function:.
- Place the editor cursor anywhere in the function to track the live call stack.
- The return value will be visible in the Object View window if the function returns any value
- Bring up the Live Callstack window from the top Visual Studio menu: Extensions, D0, Show Live Callers.
- Check "Collect callstacks".
Licensing:
To check licensing/activate a license:
From the top Visual Studio menu choose Extensions, D0, Licensing....
If you have any questions, please ask in the Q&A section or contact me: https://d-0.dev/contact/
