Code Coverage ProtectorCode Coverage Protector helps you to keep your code coverage under control. To make this possible this extension contains a widget to show the trend on dashboards and a build task to enforce code coverage policies. Widget
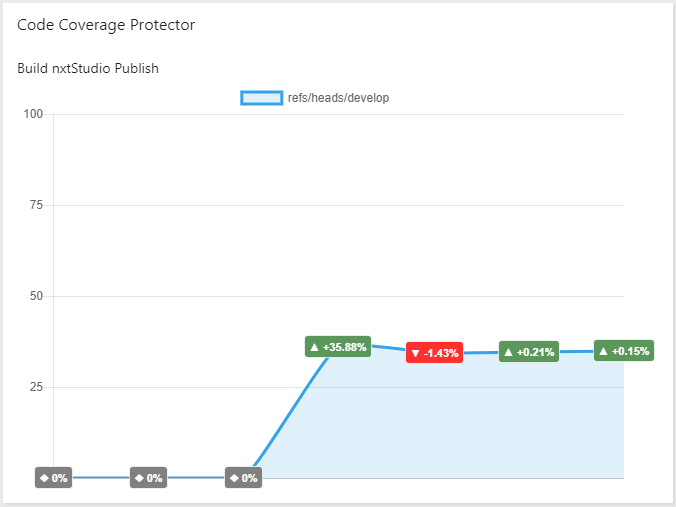
With the widget you can get an insight into the code coverage results of your most recent builds. Simply add the widget to a dashboard and configure the size, what build definition to monitor, how many builds you want to show, if you want to enable the labels and show tooltips or not. 1x1 Widget
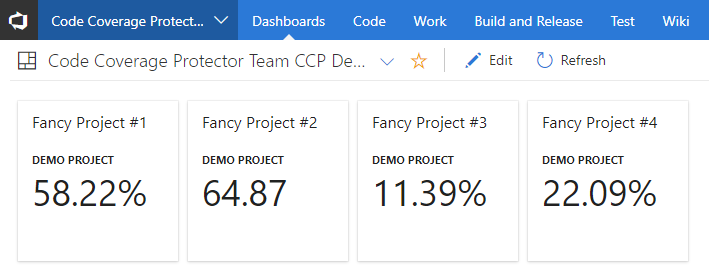
If you've got a lot of build definitions you want to show the 1x1 tile might be what you are looking for. Just add them to your dashboard and because they only take 1x1 space per instance you can add many of them to get a fast overview. We are actively working on making this feature even better in the upcoming sprints!Build Task
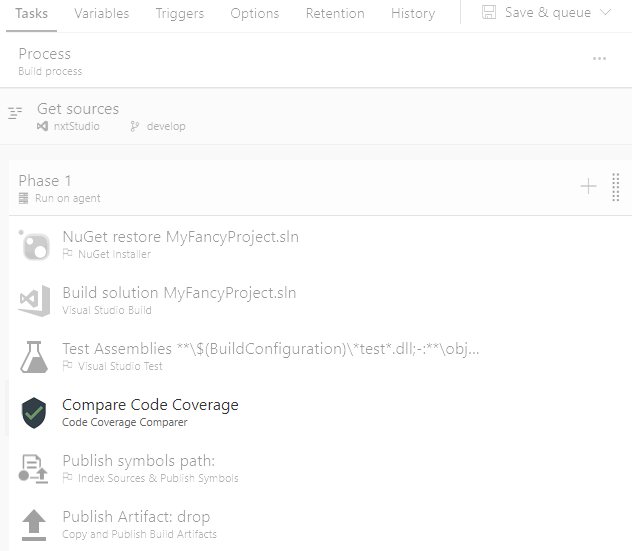
The build task makes sure that the code coverage percentage is the same or higher then the latest successful build. You can also set a target value (e.g. like 85%). In that case the code coverage may become lower than the previous build but not get any lower than the set target value. Simply add the Code Coverage Protector build task to your definition. But do make sure you place it after you published the code coverage results. Use the build task in a PR validation buildA great way to use this build task is to use it in a build that validates a pull request. This way you can avoid code merged that doesn't comply to your code coverage policy. Code Coverage Protector will compare the code coverage of the pull request with that of the latest successful build. The task uses the default branch of the build definition. Release notes09 June 2018
06 June 2018
20 April 2018
15 December 2017
04 December 2017
RoadmapIn the next iteration we are extending the 1x1 tile with more information like an indication if the last code coverage went up or down compared to the previous code coverage and how much it went up or down. FeedbackHaving idea's or seeing bugs? let us know! info@nxtstudio.nl |


