| Dynamic graphics and real-time system solution sample below: 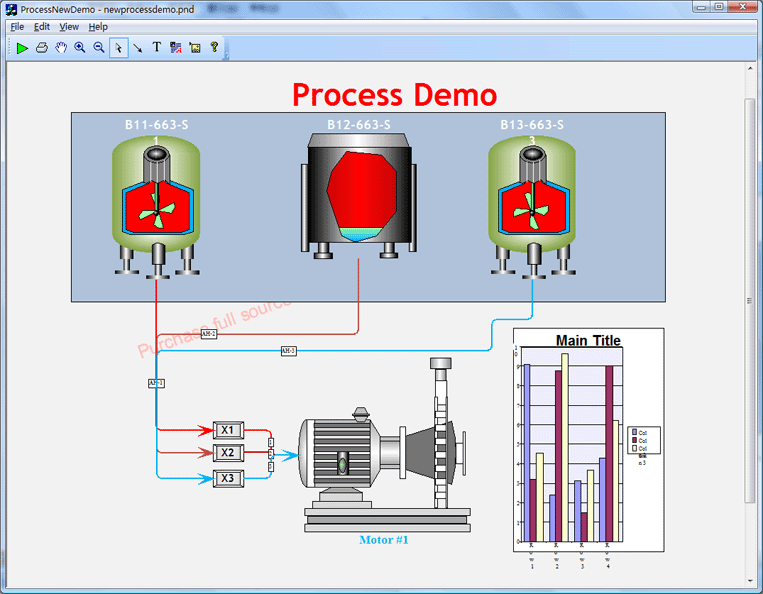
The following program is a very typical example of the use of E-XD++ visualization component library to build high-performance graphics for industrial control application case, here is the use of E-XD++ product development, the application of the steps: First, prepare the various components required for industrial control: Use E-XD++ provides high-quality graphic design program ShapeDesigner complex design needs ofindustrial components, you can use the E-XD++ itself to a lot of basic graphic design of complex components, as follows: 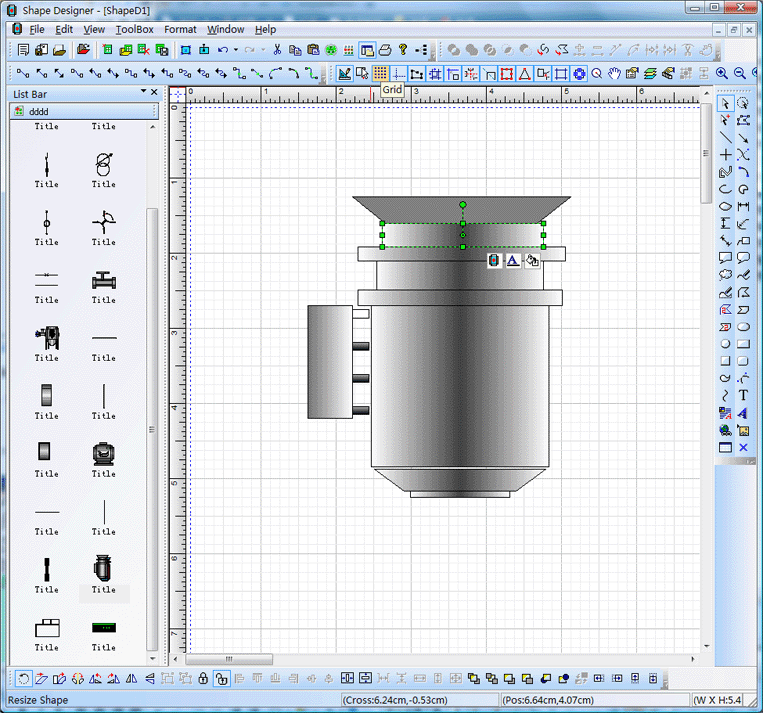
The right side of the canvas in a variety ofindustrial complex designed graphic elements can copy and paste directly from the way the mouse placed on a tool box to the left, directly after the re-use when you can drag and drop. Second, the design of industrial control screen: Through the accompanying E-XD++ products available DiagramEditor,industrial control for the specified design appropriate screen, DiagramEditor provides a very sound and powerful features to ensure that proper and efficient completion of a variety of high quality industrial design of the screen, in the design screen, we only need to drag the mouse the way through the steps of a good ready-made components in the design of structures can be dragged into the canvas, as shown below: 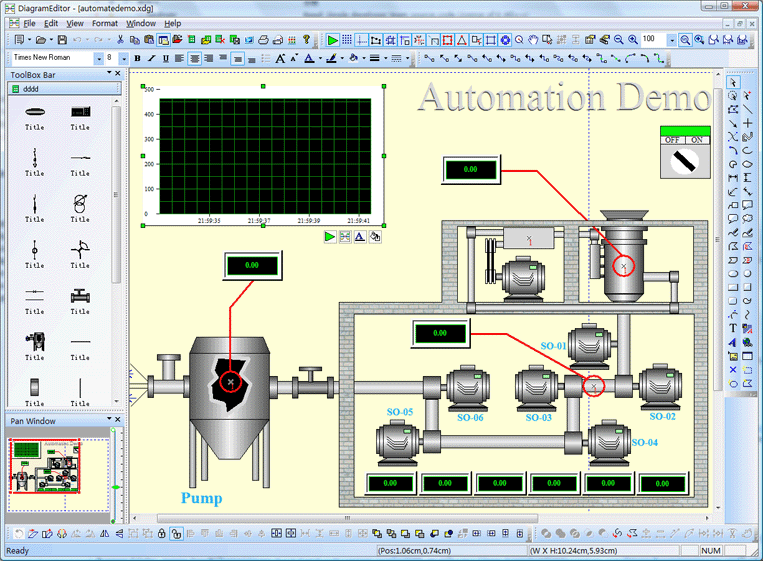
When we collect data, we often need to refresh the canvas on the status of the various primitives, specifically for each component in the DiagramEditor provide 5 keywords, you can query by any one keyword to the specified component. Settings as shown below: 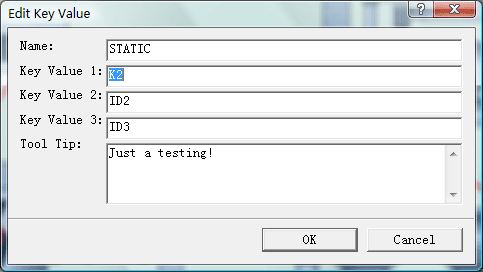
The settings we will be the top element of the Key Value 1 is set to K2. Third, the structures of the industrial process requires: By E-XD++ provides the AppWizard (application creation wizard), can automatically generate the IPC based on VC + + application framework, to load any industrial screen, just above the first XDG industrial interface designed into the application file formed XDGRES resource file, and then you can call the following function: LoadXdgFromResource (IDR_MAIN, _T ("XdgRes"), FALSE); Of course, if you need to load a new industrial interface, also can call the function. Fourth, real-time data collection: View class through the timer function, regular data collection, if you need to update the picture elements, call control itself UpdateControl can, when you need to also update the time series components can be added directly to the CFODrawShapeList list, then call UpdateShapes that be. Model code: void CAutoDemoView::OnTimer(UINT nIDEvent) { // TODO: Add your message handler code here and/or call default if(nIDEvent == ID_TIMER_ID) { CFODrawShapeList lstUpdate; int xx0 = rand() % 20; int xx1 = rand() % 18; int xx2 = rand() % 25; int xx3 = rand() % 16; int xx4 = rand() % 12; int xx5 = rand() % 21; if(pK1 != NULL) { CString strText; strText.Format(_T("%u mcA"), xx0 * xx1); pK1->SetLabelText(strText); lstUpdate.AddTail(pK1); } if(pK2 != NULL) { CString strText; strText.Format(_T("%u C"), xx0 * xx2); pK2->SetLabelText(strText); lstUpdate.AddTail(pK2); } if(pK3 != NULL) { CString strText; strText.Format(_T("%u Nm/h"), xx0 * xx3); pK3->SetLabelText(strText); lstUpdate.AddTail(pK3); } if(pX1 != NULL) { CString strText; strText.Format(_T("%u"), xx0 * xx4); pX1->SetLabelText(strText); lstUpdate.AddTail(pX1); int nValue = xx0 * xx4; if(nValue > 200) { pX1->SetBkColor(RGB(255,0,0)); } else if(nValue > 100) { pX1->SetBkColor(RGB(255,255,0)); } else { pX1->SetBkColor(RGB(0,0,0)); } } if(pX2 != NULL) { CString strText; strText.Format(_T("%u"), xx0 * xx5); pX2->SetLabelText(strText); lstUpdate.AddTail(pX2); int nValue = xx0 * xx5; if(nValue > 200) { pX2->SetBkColor(RGB(255,0,0)); } else if(nValue > 100) { pX2->SetBkColor(RGB(255,255,0)); } else { pX2->SetBkColor(RGB(0,0,0)); } } if(pX3 != NULL) { CString strText; strText.Format(_T("-%u"), xx1 * xx5); pX3->SetLabelText(strText); lstUpdate.AddTail(pX3); int nValue = xx1 * xx5; if(nValue > 200) { pX3->SetBkColor(RGB(255,0,0)); } else if(nValue > 100) { pX3->SetBkColor(RGB(255,255,0)); } else { pX3->SetBkColor(RGB(0,0,0)); } } if(pX4 != NULL) { CString strText; strText.Format(_T("%u"), xx2 * xx3); pX4->SetLabelText(strText); lstUpdate.AddTail(pX4); int nValue = xx2 * xx3; if(nValue > 200) { pX4->SetBkColor(RGB(255,0,0)); } else if(nValue > 100) { pX4->SetBkColor(RGB(255,255,0)); } else { pX4->SetBkColor(RGB(0,0,0)); } } if(pX5 != NULL) { CString strText; strText.Format(_T("%u"), xx2 * xx4); pX5->SetLabelText(strText); lstUpdate.AddTail(pX5); int nValue = xx2 * xx4; if(nValue > 200) { pX5->SetBkColor(RGB(255,0,0)); } else if(nValue > 100) { pX5->SetBkColor(RGB(255,255,0)); } else { pX5->SetBkColor(RGB(0,0,0)); } } if(pX6 != NULL) { CString strText; strText.Format(_T("%u"), xx3 * xx5); pX6->SetLabelText(strText); lstUpdate.AddTail(pX6); int nValue = xx3 * xx5; if(nValue > 200) { pX6->SetBkColor(RGB(255,0,0)); } else if(nValue > 100) { pX6->SetBkColor(RGB(255,255,0)); } else { pX5->SetBkColor(RGB(0,0,0)); } } if(pChartShape != NULL) { pChartShape->UpdateData(xx0 * xx1, xx0 * xx2, xx0 * xx3); lstUpdate.AddTail(pChartShape); } if(lstUpdate.GetCount() > 0) { UpdateShapes(&lstUpdate); } } else { CFODrawView::OnTimer(nIDEvent); }} The final run of the application interface model is as follows: 
Of course, E-XD++ visualization component library provides two graphical style of canvas, one is based on the View, the other is based on CWnd, which helps you to build different styles of applications (such as running to hide scroll bars etc.). E-XD++ high-quality visual component library with VC + +, fully formed, with excellent operating performance and efficiency, including the application of Alstom has been able to verify many of the world's top customers. The following list is the E-XD++ provides industrial solutions for some vector graphics library, all of these graphics are all vector graphics: 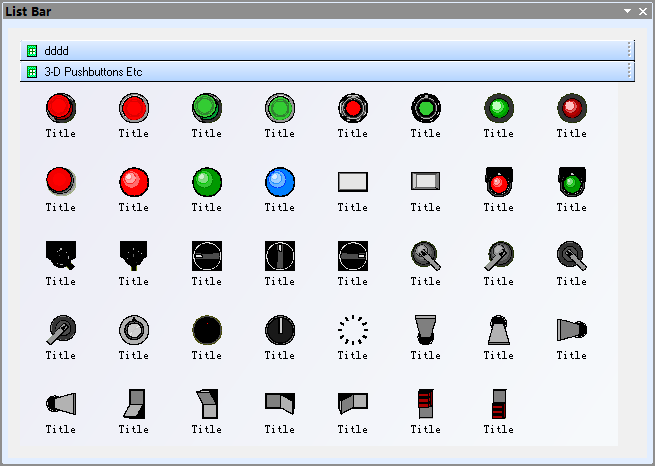
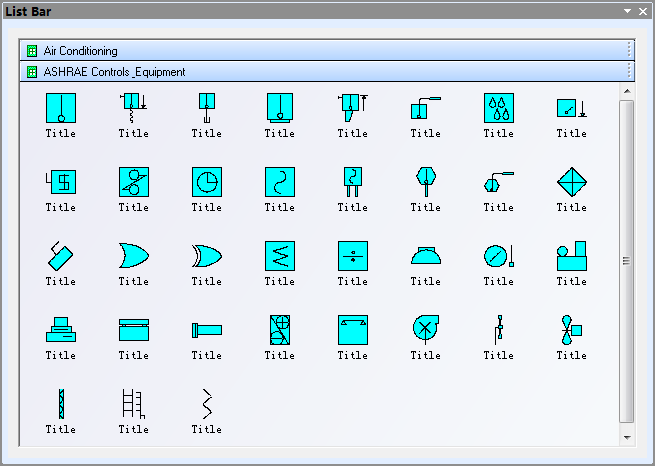
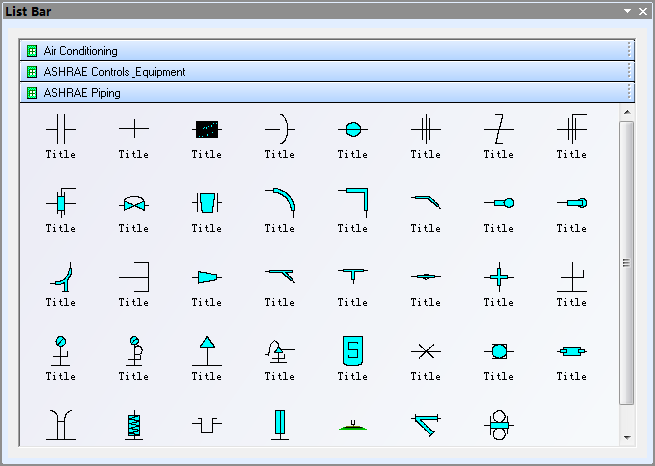
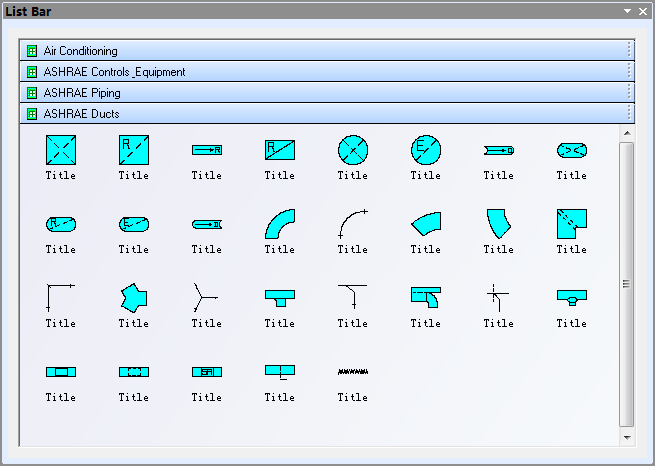
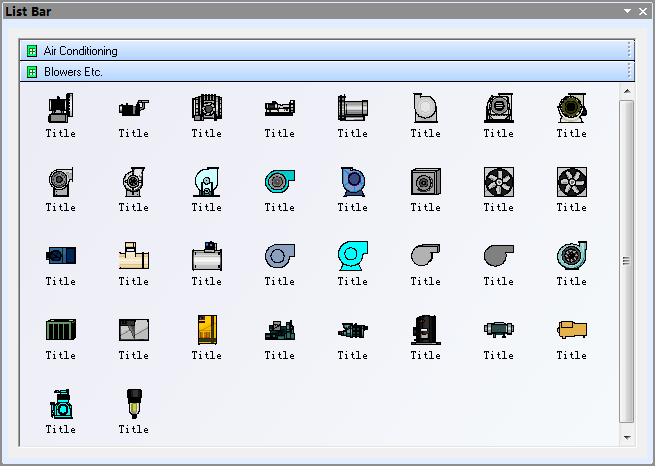
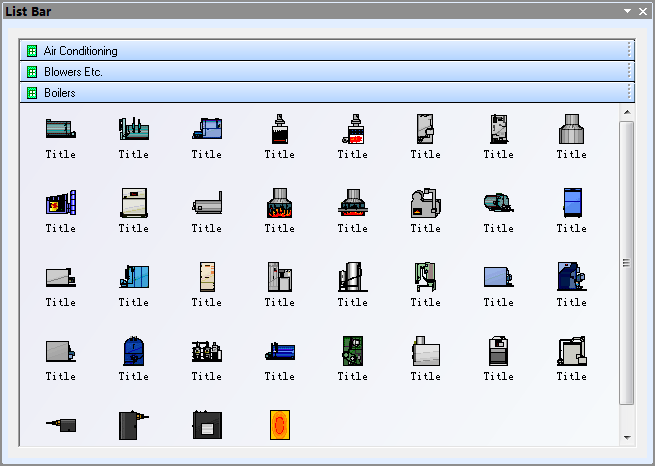
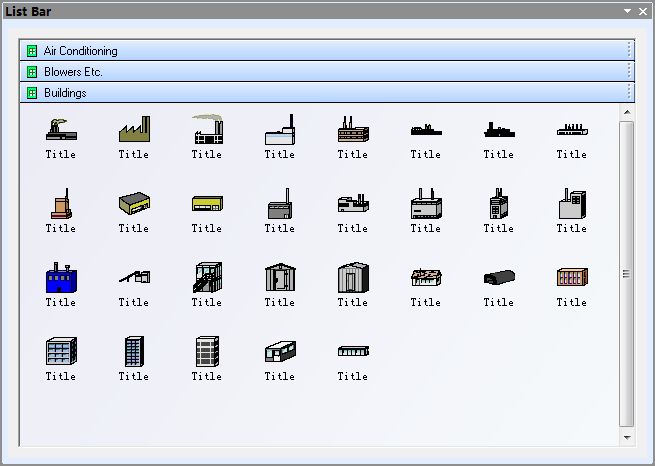
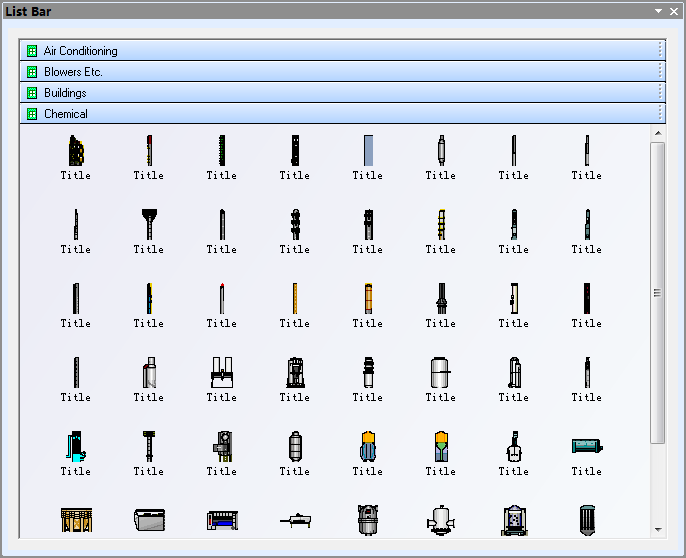
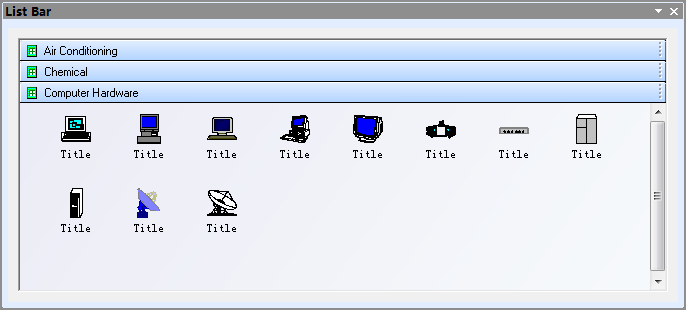
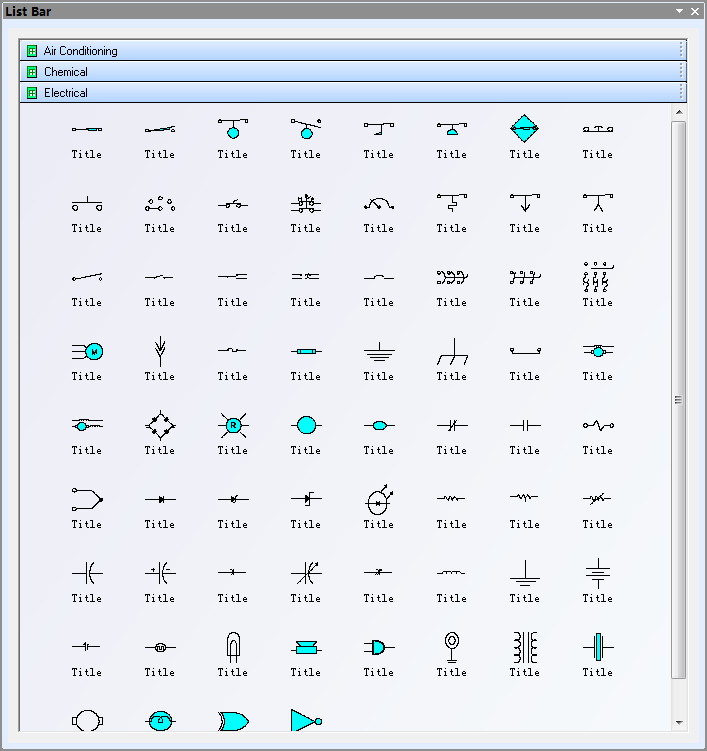
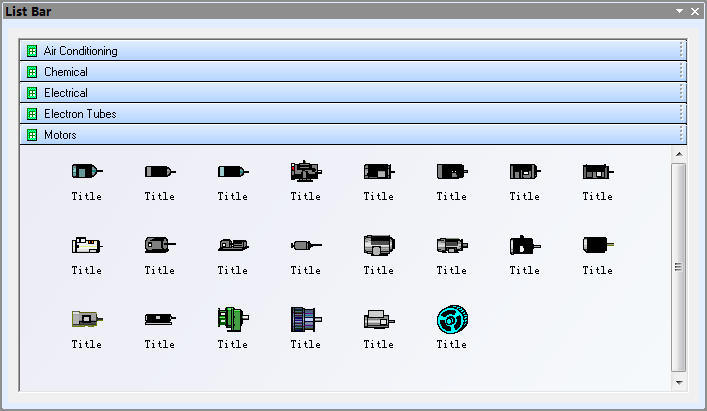
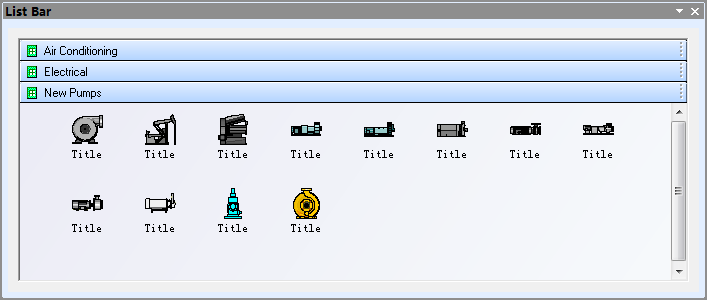
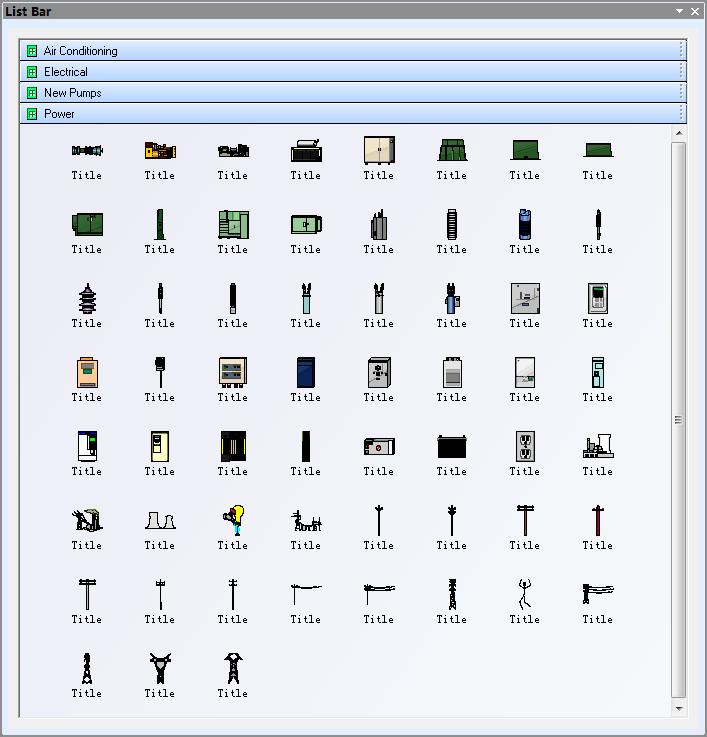
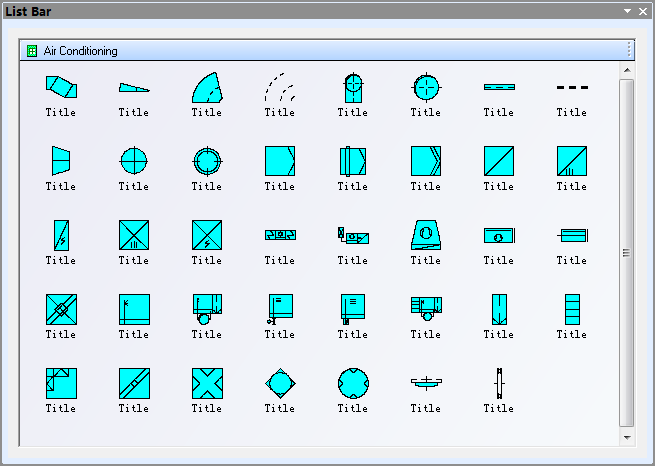
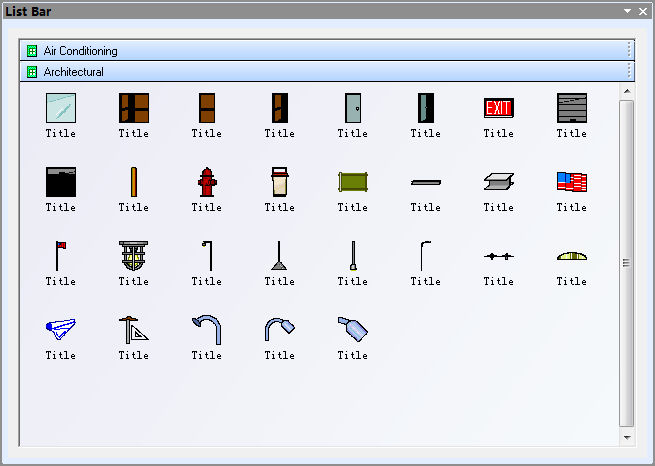
Due to space limitations, only one out so much. The following example shows how to use the E-XD++visualization component library to create complex graphical control flow graph, simple and fast, the graphics on the canvas as needed, or add custom attribute data with the database connection, as follows: 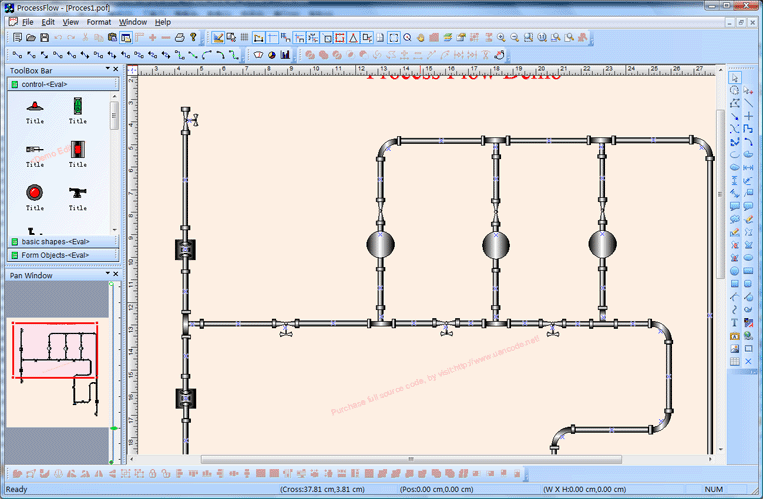
Below is an example of industrial pipes and fluid flow: 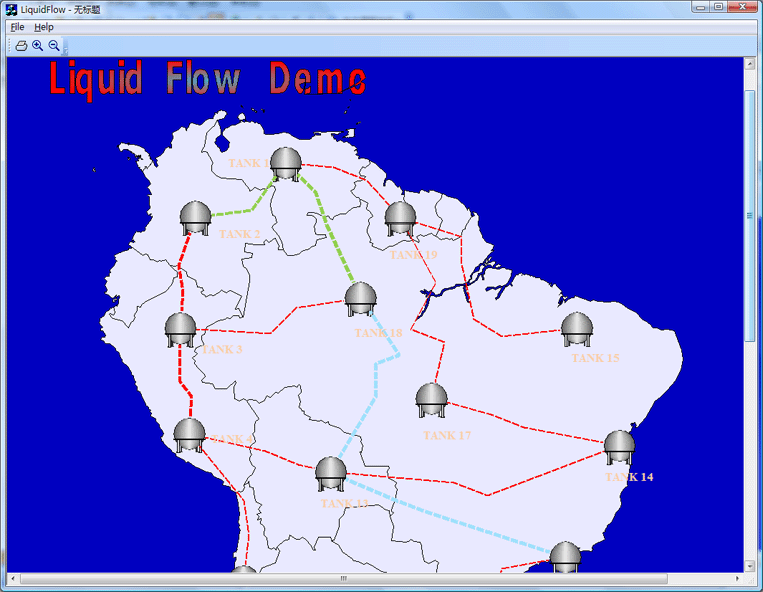
1. Support the complex gradient fills, image fills and other fill patterns to create a variety of simulation, industrial control, configuration graphics provides the most convenient means. 2. All graphics are built-in timer function, you can start at any time, free to control the movement frequency. 3. You can copy any graphic way by pasting into the left side of the tool box window, you can drag and drop graphics directly into the canvas. 4. Built-in design mode and run mode, in the design mode, which allows only editing graphics, and in the run mode, only motor function for graphics or interactive events, you can develop two procedures, a job only In the design mode, the other only in Run mode. 5. The provision of professional XML handling classes to facilitate the release of information or data with the exchange. 6. Canvas size freely defined. 7. Improve the printing control system built-in functions, without writing a single line of code to select the printer, set the print paper, control orientation, set page margins and so on. 8. Support multi-layer display. 9. Support the drawing auxiliary lines. 10. Graphics are set for each individual virtual keyboard and mouse control functions, can handle any mouse click, double click, mobile and other interactive events. 11. Supports rotate text at any angle, and the WYSIWYG text entry. 12. Using shared GDI device that will extend the performance to the extreme, can accommodate tens of thousands in the same pixel in the canvas at the same time to complete editing. 13. The system default page jump, file loading, sending mail, open Web pages and other interactive events, by covering the corresponding virtual function makes it easy to add new interactive events. 14. Full support for the creation of complex graphics can be any combination of simple graphics to complex composite graphics. 15. Support any complex polygon operations, including the intersection, and would like to, take over, so the joint operation. 16. Each graphics system equipped with five additional parameters control point, these additional control points, adjustable graphics state parameters. 17. Support the line and arc hybrid editing, graphics can be directly manipulated for a certain period, which can be straight lines and arcs in the freedom of conversion. 18. Full support for Undo / Redo, can be set to any multi-level Undo / Redo operation. 19. Can increase the canvas plug and play any graphics on the new property values, increase property values and the new automatic support for modifying the UNDO / REDO. 20. RTF support complex text editing and direct printing of direct output. 21. Can any graphics on the canvas to move, rotate, scale, distortion, distorted, arranged so advanced operation. 22. To support a large canvas scaling. 23. Can be pushed through the mouse flat canvas. 24. Support centimeters, millimeters, feet, inches and other scale ruler. 25. Can be directly imported bmp, wmf, emf, jpeg, gif, tga, pcx, png, mng and other image files. 26. Full support clipboard can be free to copy and paste graphics. 27. Be free to adjust the arrangement of canvas graphics level. 28. Provides thumbnail preview function, and can preview the image through the rectangular box, adjust the display position of the current canvas. 29. Ocx control to provide consistent functionality for easy web deployment or any other language platform for developers call the same functions. 30. The most important is that we will rigorously tested all of these high-quality VC + + source code available to you, the source code also includes the design of the control ocx source code.
dd More than 50 million lines all carefully designed and rigorously tested to provide the source code without any reservations!
Provide more than 400 class C + + extensions, 50 million lines of effective VC + + / MFC source code, sample or solution more than 70 source code, complete and detailed online help system and user documentation, supporting development tools designed! Powerful, flexible and easy to use graphical visualization of source code libraries.
Powerful and flexible to create a variety of charts to meet your needs. Product design specifications, it is easy to use, in just a few days can be designed according to your needs products. We provide complete support for products, download the trial.
Feature-rich.
Ultra-versatile, such as automatic layout, multi-level collapsible subgraph, cell connection point, XML, DXF, SHP, SVG, etc., can help you quickly create complex and flexible chart. Supports a number of events: such as click, double click, hover, select, rubber band select, copy, delete, resize and move the support. Support the most complex operations: such as drag and drop, unlimited undo / redo and clipboard operations and so on.
Save time and money to obtain reliability.
A picture is worth a thousand words, E-XD++ offer more than 50 million lines of well-designed and well-tested C + + source code! Development takes years, thousands of customers worldwide validation, can save you a lot of development time and money!
Try it now!
Do not just listen to us say it a try! Our free trial includes all you need to prototype your application. Free technical support.  Products Products
 Download this solution Download this solution

 The official version of the E-XD++component library visual graphics solutions for enterprise version provides all the source code, click the button below to UCanCode Order : The official version of the E-XD++component library visual graphics solutions for enterprise version provides all the source code, click the button below to UCanCode Order :

|