Data Visualization Component, Data Visaulization VC++Source Code ControlThe quick and simple way to building Data Visualization Component Process Simulation Software with Visual C++, and the .NET platform |
Data Visualization Component, Data Visaulization VC++Source Code Control with Process Simulation Software
The quick and simple way to building Data Visualization Component Process Simulation Software with Visual C++, and the .NET platform
E-XD++ and UCCDraw product walkthrough
Screenshots Applications built on E-XD++ToolKit
Product feature comparison
Download this Data Visualization Component Process Simulation & Hmi Sample 0
1. Design theData Visualization Component Process Simulation symbols:
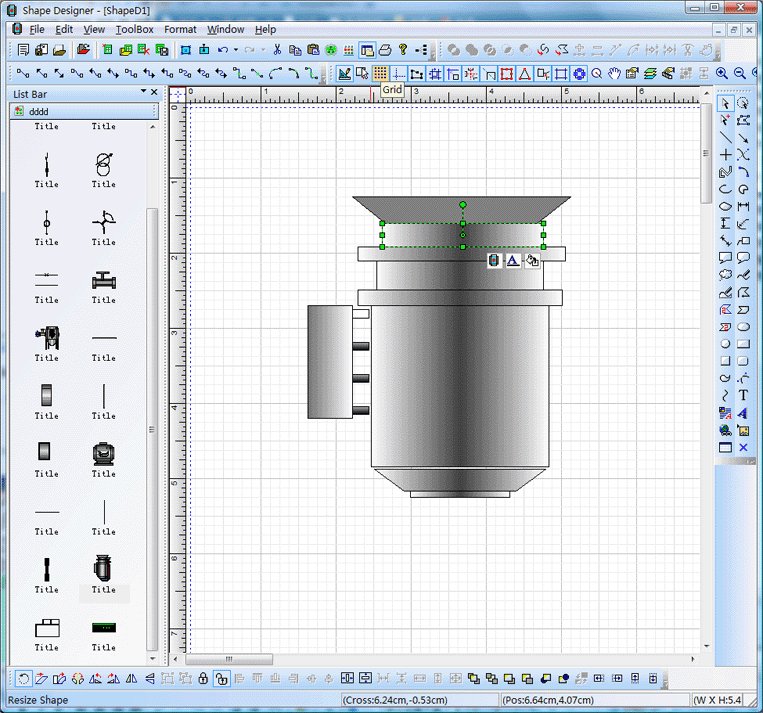
With E-XD++ full edition, there is a shapedesigner application shipped, with this diagramming tool, you can use many advance features to build any kind ofData Visualization Component Process Simulation Software symbols, The Symbol Editor is an interactive point-and-click editor that creates, edits and organizes intelligent symbols to populate a user interface, as below:
When one composite symbol is designed, just use Copy/Paste to place it within the toolbox window at left side. TheseData Visualization Component Process Simulation Symbols will be ready for use in future. The Shape Designer offers graphics editing capabilities and is fully interoperable with authoring tools, such as Adobe Illustrator or Inkscape, to ensure that the visual elements of the symbol are as appealing as possible. It then adds dynamics to graphics with rules describing how the elements of the symbol will react to data changes. For example, rules can define the alarm conditions that will cause a part of a factory symbol to blink, or how far a needle on a rotary gauge will rotate. The newly created symbol can then be cleanly organized in palettes and reused by the other design tools. By default, the Shape Designer contains palettes of fully functional symbols for diagramming and monitoring applications, such as gauges, buttons, meters, dials and more. What is a "Symbol?" A symbol is a self-contained graphic object that represents a physical or conceptual element in the underlying application. For example, symbols can represent trucks, factories, network elements, dials or gauges.. They have built-in behavior and an exposed interface, like a graphic VC++ control. When an application executes, its symbols connect to real-world objects and are "data-aware"—when the underlying data changes in a meaningful way to the user, the overlying symbols change their appearances. For example, if a component in a data network reaches a pre-defined critical threshold, the symbol associated with it might display a red alarm. Or if an airplane has moved, then its symbol will move on a map display.
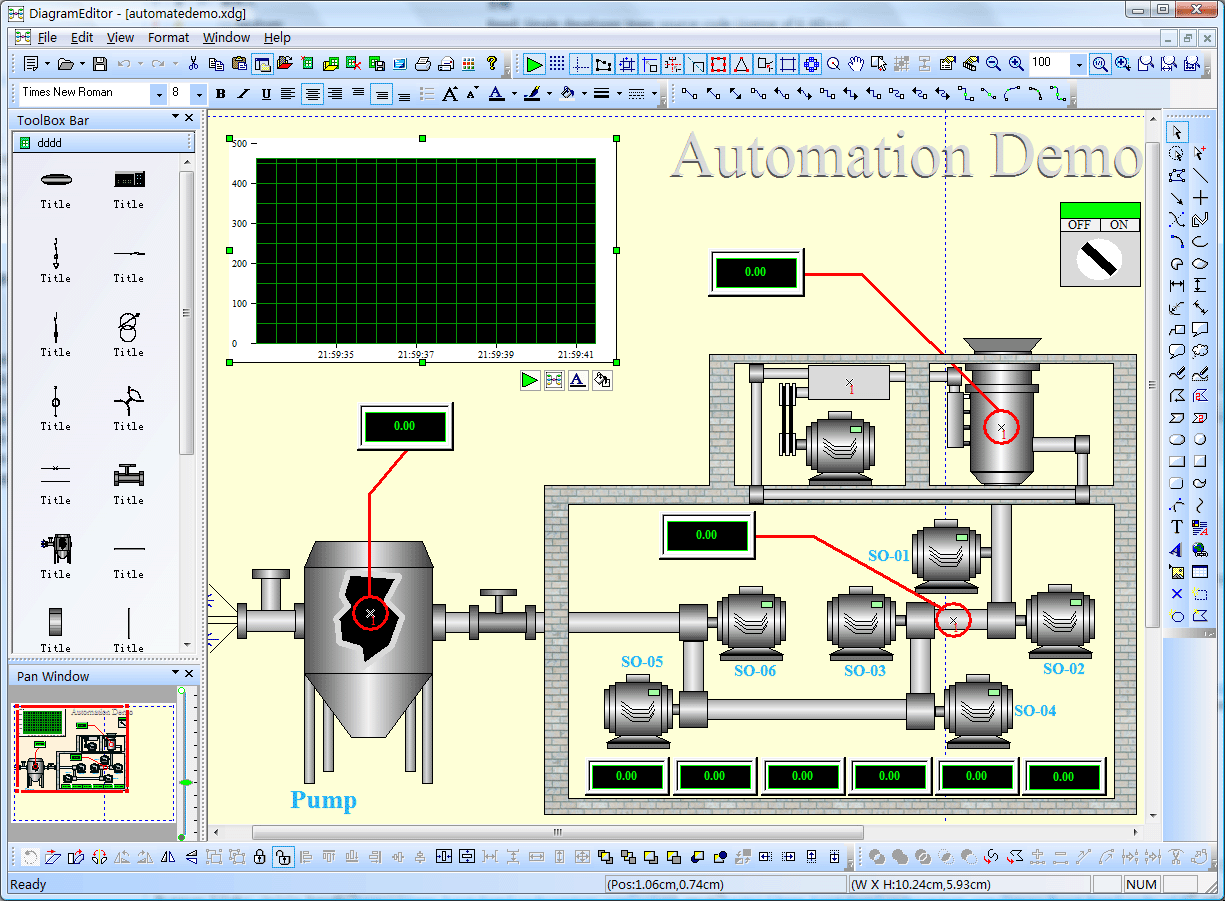
2. Design Data Visualization Component Process Simulation Software Screen:
With E-XD++ full edition, there is also a ready to use Data Visualization Component Process Simulation Screen design tool shipped, with this tool, you can use any symbols within the toolbox window at left side to build any screen as you want, just drag and drop, very simple and easy:
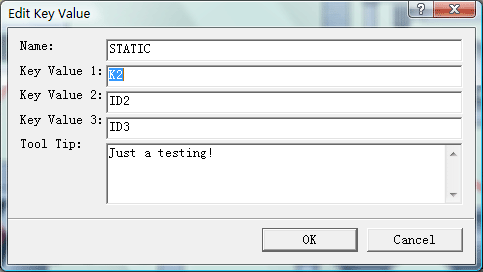
Diagram Editor is well-suited for defining the look and feel of applications that must automatically create a diagram—such as a business process, a network typology, a workflow, a dataflow, or entity-relational diagrams—from a data source. If you want to identify any shape on the screen, just use the following dialog to define some key value. There are three key values that can be used to do this work, as below:
We change it's key value 1 to K2. After one Data Visualization Component Process Simulation Software Screen is finished, you can save it to a xdg file. You can design as many screen as you want. 3. Building your Data Visualization Component Process Simulation Software: With full edition of E-XD++ Visualization Component, there is an appwizard that will help you building a base framework ofData Visualization Component Process Simulation Software without written a line of codes, after the base framework of your application is finished, you can import any XDG files into your application, (Please remember the resource type must be XDGRes), to load a Data Visualization Component Process Simulation Screen just call the following codes, it is very easy: LoadXdgFromResource(IDR_MAIN, _T("XdgRes"), FALSE); In fact, this line of code can be called at any place if you want to load any new screen at any time. 4. Update the screen with data:
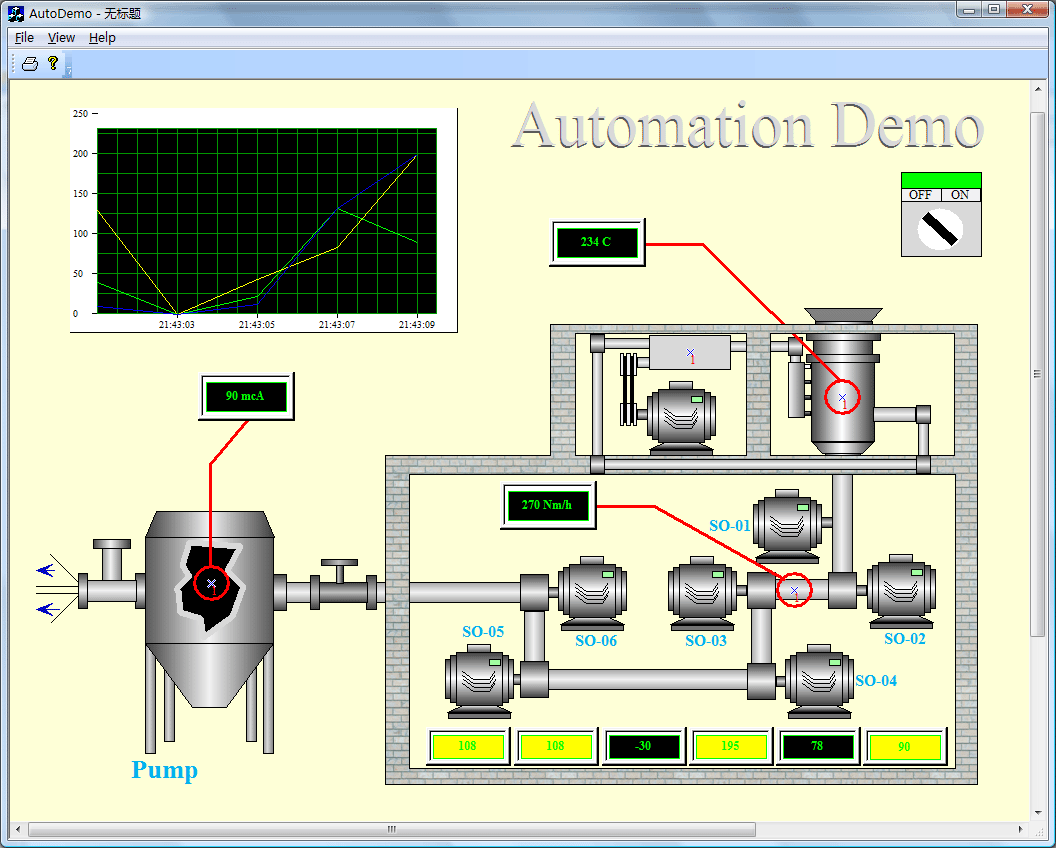
Mostly we can use the WM_TIMER of CWnd to recieve the data and refresh the Data Visualization Component Process Simulation Screen, if you want to update only one shape, just call UpdateControl of this shape, but if you want to update a list of shapes one time, we recommend you to call UpdateShapes, this will works more effectiveIf you want to handle the click event, you can DoButtonClickEvent to do that. That's all, below is the running - time mode of this sample.
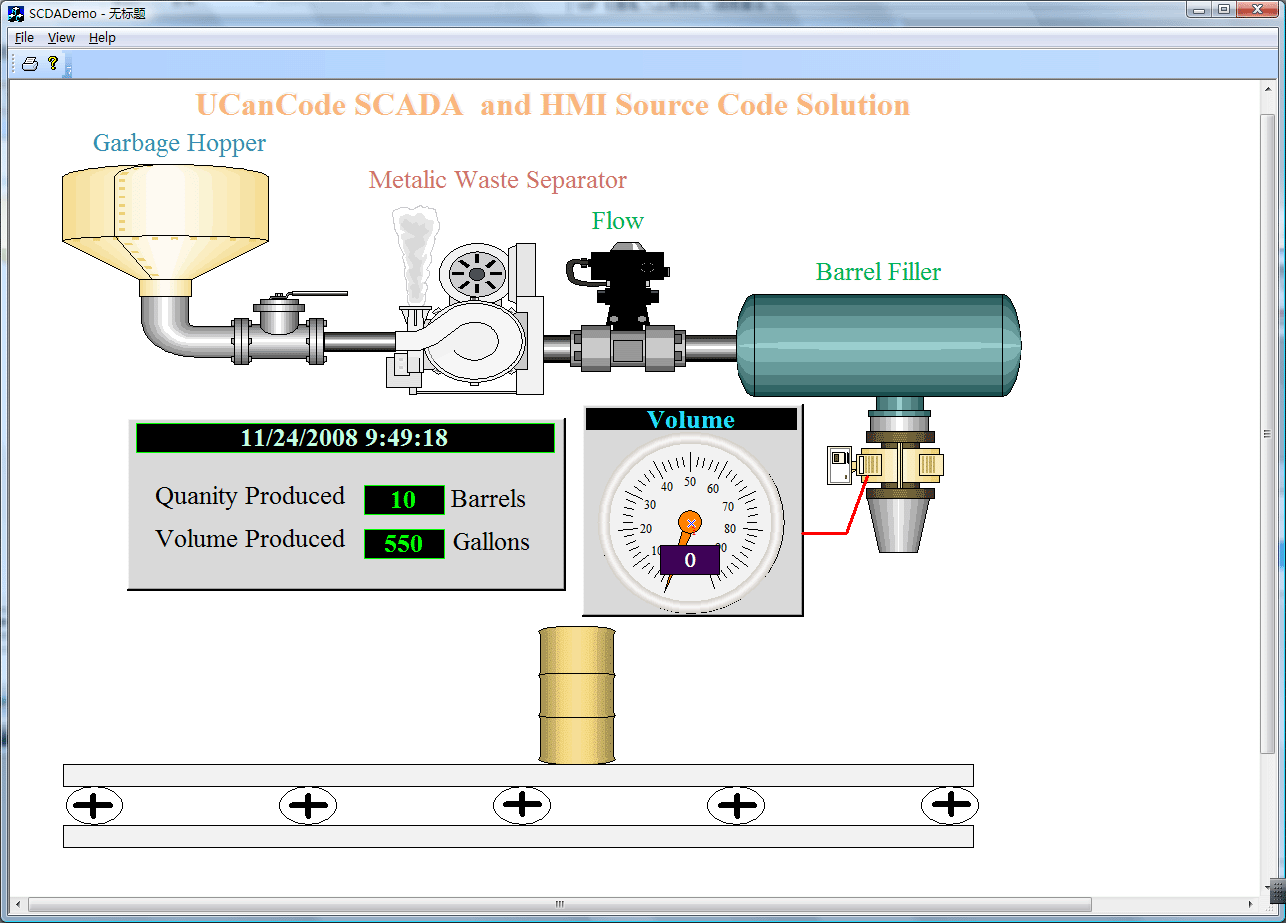
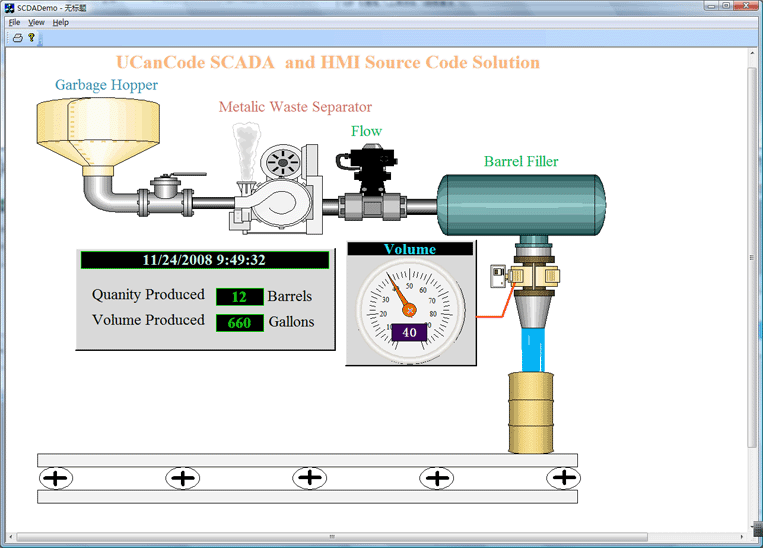
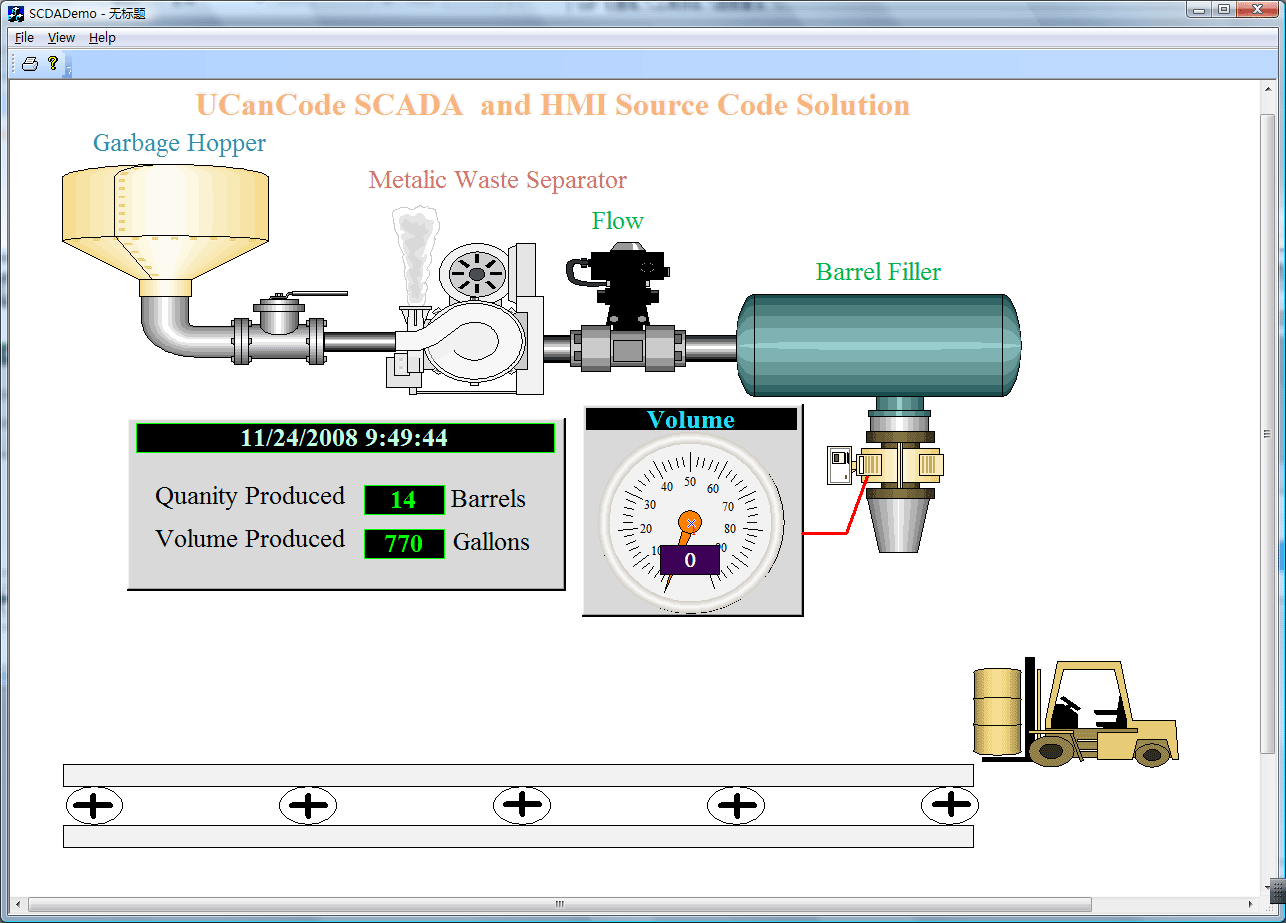
UCanCode provides a complete set of services, consisting of design tools and asoftware development kit (SDK), for developers who want to create a user interface for industrial monitoringand process control drawingData Visualization Component, Process Simulation applications. These displays feature highly customized graphical objects that connect to underlying real-world data. Developers prefer ucancode's solutions because they are easy to use, completely customizable, and can deploy to both the desktop and the Web. ucancode is the industry’s leading real-timeSPC software, automating quality data collection and analysis Add Diagrams and Data Visualization Component Process Simulation to your applications. E-XD++ Diagrammer brings accurate and intuitive diagrams and dashboards to your c++ desktop applications. It offers a comprehensive set of tools, components and graphic objects for creating visualization, editing and monitoring Windows applications. It is very quickly and easily to use E-XD++ to build any Data Visualization Component, Process Simulation Software: The following is another sample on Data Visualization Component Process Simulation Application: State 1:
State 2:
State 3:
|