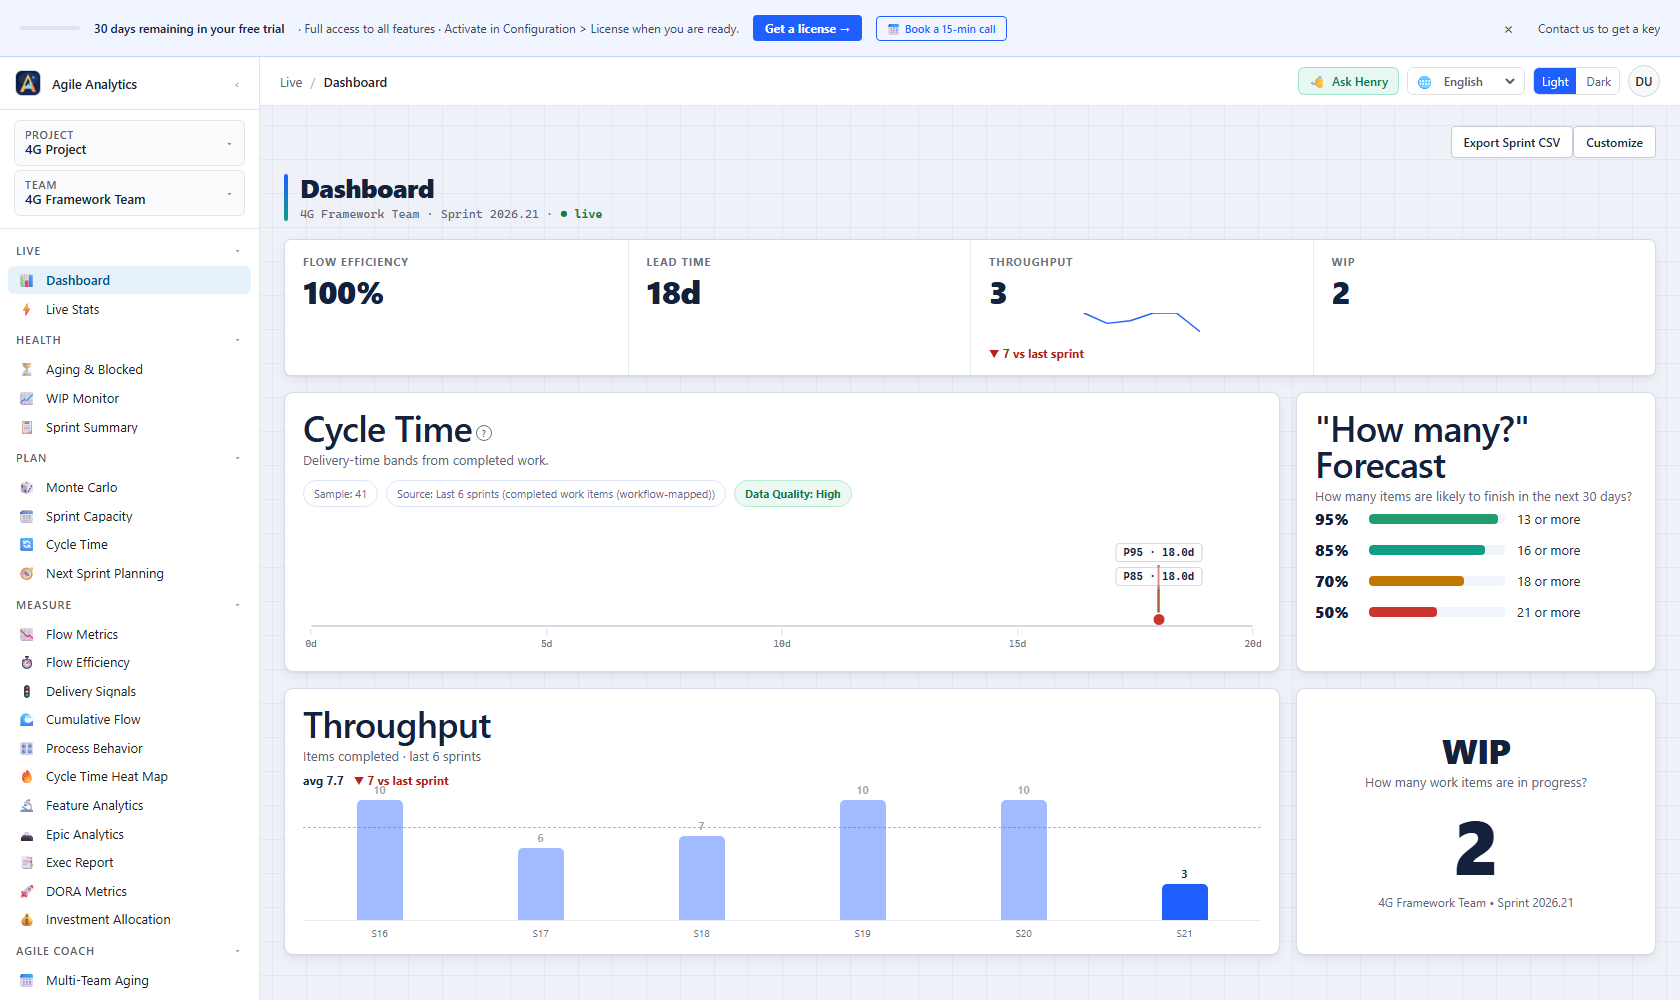
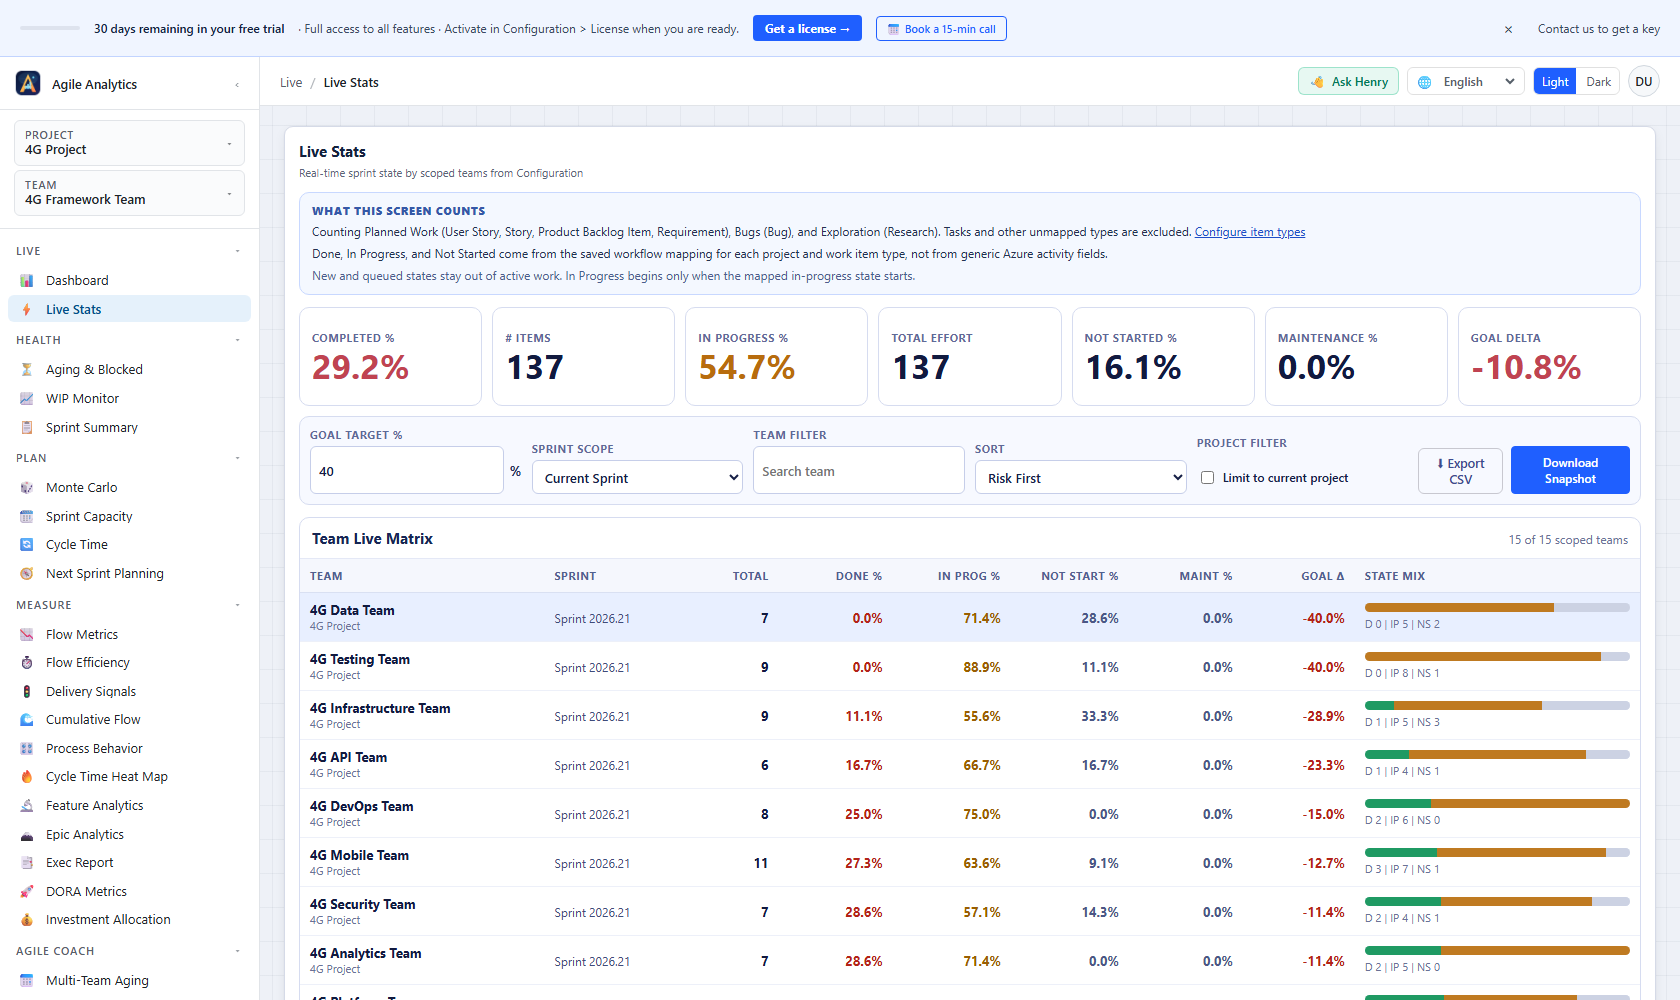
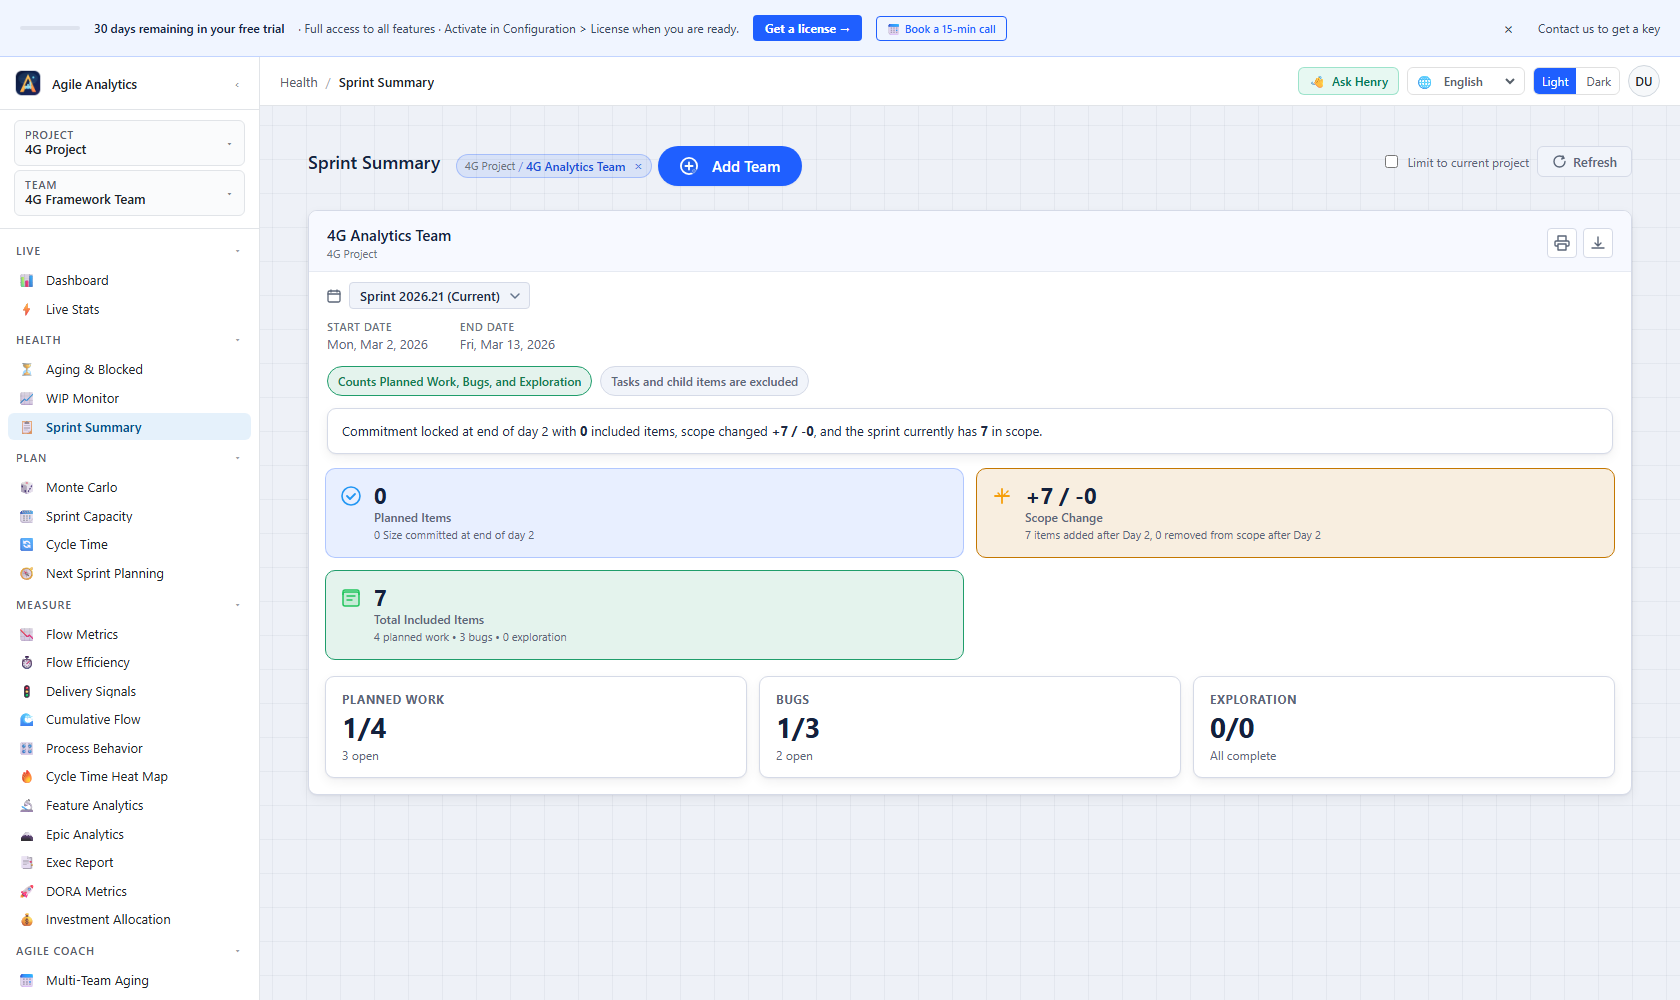
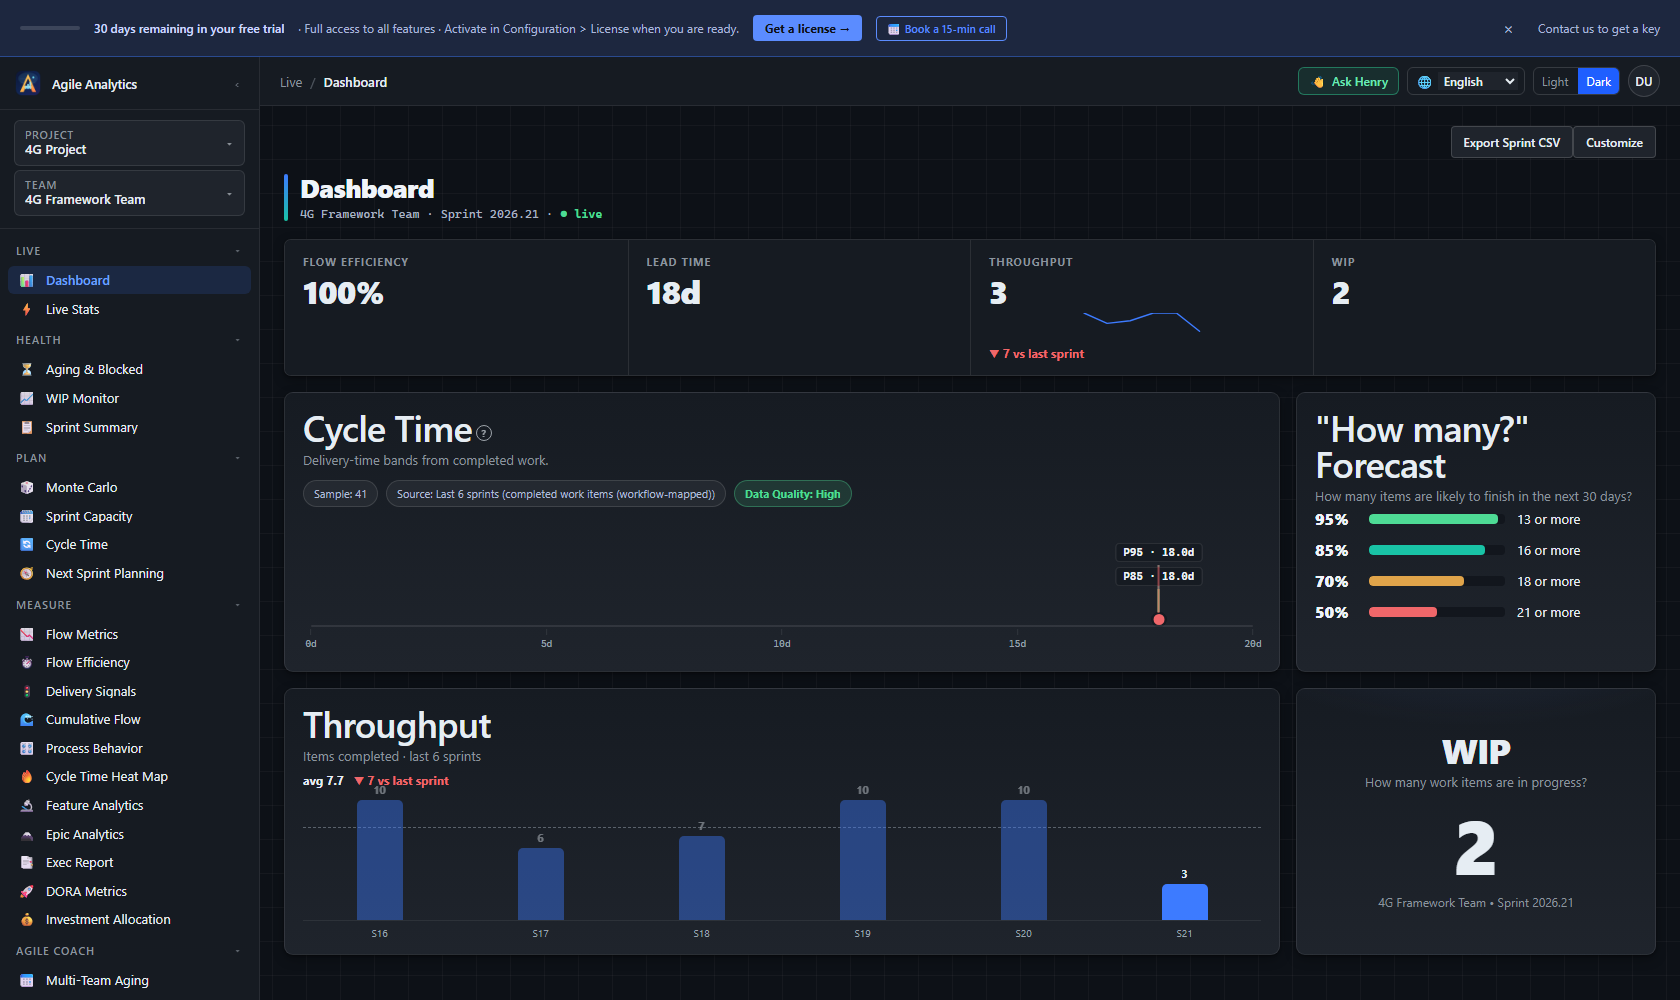
See your sprint's velocity, forecast, and flow — inside Azure DevOpsOpen Azure DevOps. Click "Agile Analytics" in any project's sidebar. See your last 6 sprints' velocity, cycle time, and a Monte Carlo delivery forecast on one screen — in under 60 seconds, with no Azure DevOps PAT, no setup, and nothing leaving Azure DevOps. Agile Analytics is a sprint reporting tool and agile metrics dashboard that runs entirely inside Azure DevOps — velocity tracking, cycle time analytics, flow metrics, and Monte Carlo delivery forecasting for Scrum and Kanban teams.
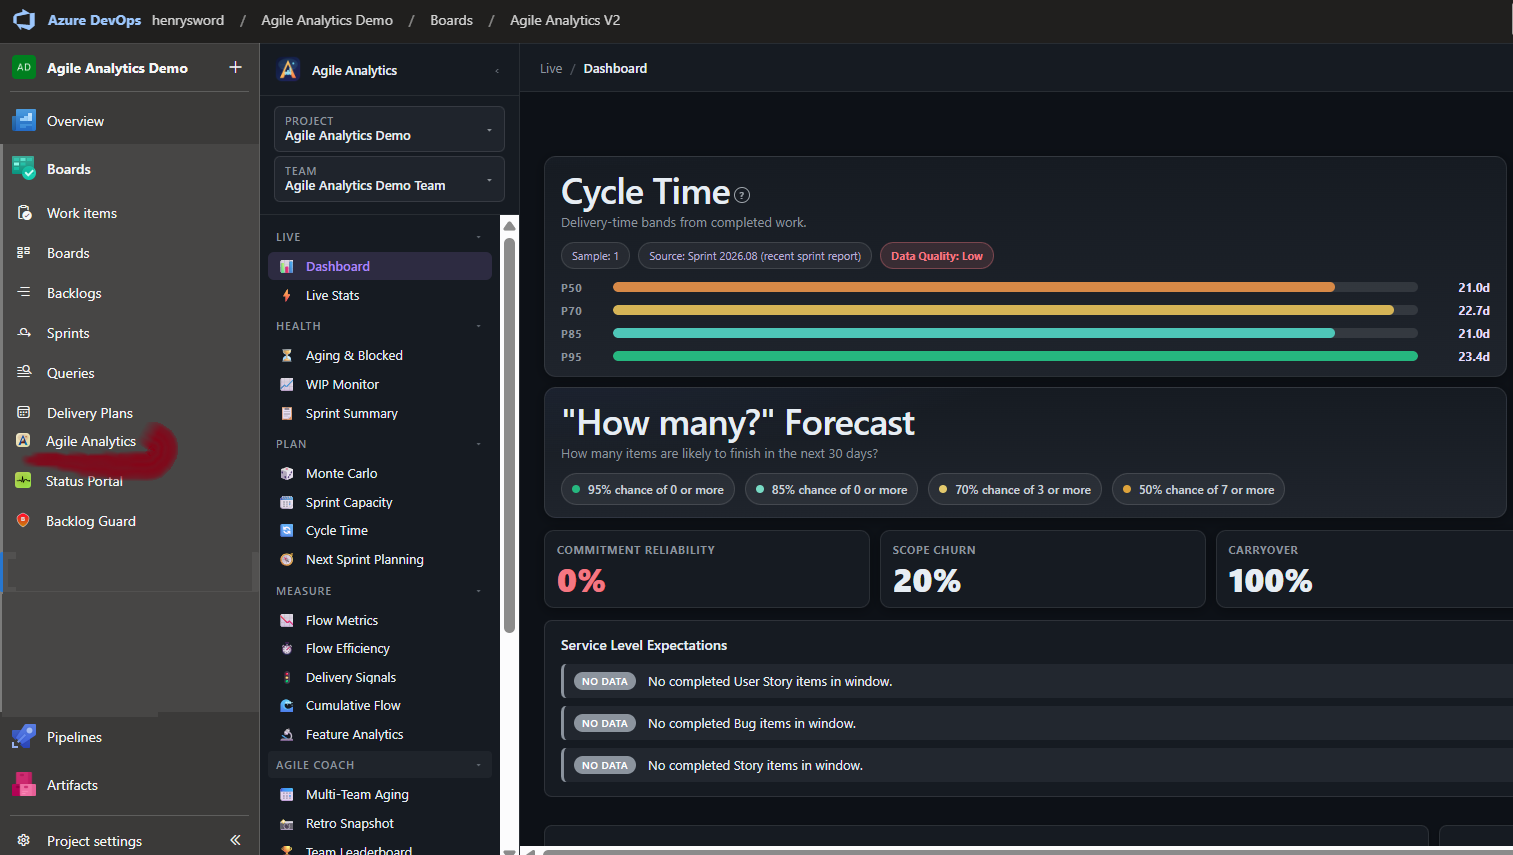
Your work-item data never leaves your Azure DevOps tenantEvery analytics view runs in your browser, against the Azure DevOps REST API, using your existing ADO session. Sprint contents, work-item titles, PRs, code, comments, attachments, customer PII — none of it is sent to a Baytek server. This is structurally different from SaaS analytics platforms (Jellyfish, LinearB, Plandek, Allstacks, Athenian) that require you to grant a PAT or OAuth scope and pipe your ADO data into their warehouse. Agile Analytics installs as an Azure DevOps Marketplace extension — it lives in your tenant, your admin controls it, and your security team can audit it through the Marketplace publisher record. What Baytek does receive: an org ID, the extension version, and operational event names (e.g. "sprint view opened", "error observed") — no titles, no content, no PII. Used to fix bugs and bill seats. Full detail in our Privacy Policy. Four read-only ADO scopes. Where to find it after installAgile Analytics adds a new entry to the left sidebar of every Azure DevOps project in your organisation — directly under the project name, alongside Boards, Repos, Pipelines. If you've just installed and don't see it yet, refresh the project page once. The extension is organisation-wide, so it shows up in every project automatically — you do not need to install it per project.
At a glance
The Gap It FillsAzure DevOps has powerful raw data but no built-in answers for the questions that actually matter in sprint planning and retros:
Agile Analytics answers all of these — without leaving Azure DevOps. Who Is This For
Views at a Glance
Sprint Health
Flow Analytics
Delivery & Investment
Portfolio
Agile Coach
AI Governance
Dashboard WidgetsCompanion tiles are available in the Azure DevOps widget catalog under the "Agile Analytics" category. The analytics themselves live in the hub — a tile that cannot reach your data says so and points you there. Tools
How It Compares
This is positioning, not a benchmark — every team's setup is different. The point is that Agile Analytics fills the analytics layer that ADO ships without, with no data-pipeline work and a flat org price. Pricing & Licensing
Three plans, every feature included on each:
All plans are billed annually — a 12-month subscription. Each licence covers a single Azure DevOps organisation; if you run more than one organisation, contact us for multi-organisation pricing. You can upgrade to a higher plan at any time — the unused value of your current plan is credited toward the new one, so you only pay the difference. A seat is an assigned place on your plan. Your extension admin assigns people in Configuration → Access Control; assigned users — admins included — each hold one seat, and seats can be swapped at any time by removing someone and assigning someone else. You can never be billed for more than your plan: when every seat is taken, new assignments are refused until you free one or upgrade, and everyone else still sees the Dashboard with a one-click way to request a seat from your admin. During a trial there are no seats — everyone in your organisation has full access. 30-day free trial activates automatically on install — no credit card required. During the trial every user in your org has full access. Install from the Azure Marketplace and your trial starts automatically. When you are ready to subscribe, visit https://ado-analytics.baytekdev.com/pricing/. After payment, Baytek emails your licence key and an org admin activates it in Configuration → Admin → License inside the extension. Not ready to commit? Schedule a 15-min call — procurement question, security review, missing feature, pricing for an unusual team size. No slides. Support & Feature Requests: Questions, bugs, rollout help, or missing features? Start here: https://ado-analytics.baytekdev.com/support/ Security, Privacy & ComplianceWhere your work-item data lives. Every analytics view runs in your browser against the Azure DevOps REST API, authenticated by your existing ADO session, the same session ADO Boards uses to render your work-item list. Baytek does not see, request, or store your work-item content: titles, descriptions, comments, or attachments. What Baytek's backend does receive is listed below: a pseudonymous per-user ID for seat counting. If an admin schedules a report, that report's project name, team names, and sprint name reach Baytek too. Industry Benchmarks is different: it sends only bucketed aggregate metrics, never a project, team, or sprint name. What Baytek's backend handles.
Sub-processors.
Sub-processors are listed in the Privacy Policy and the Compliance posture.
Settings storage. All extension configuration (workflow mapping, WIP limits, AI adoption credentials, access control, user preferences) is stored at organisation scope in Microsoft's Azure DevOps Extension Data Service — Microsoft-managed infrastructure that Baytek systems do not access. Configuration survives extension upgrades and is removed by Microsoft on uninstall. Engineering quality bar. Releases are gated through over 10,000 automated tests:
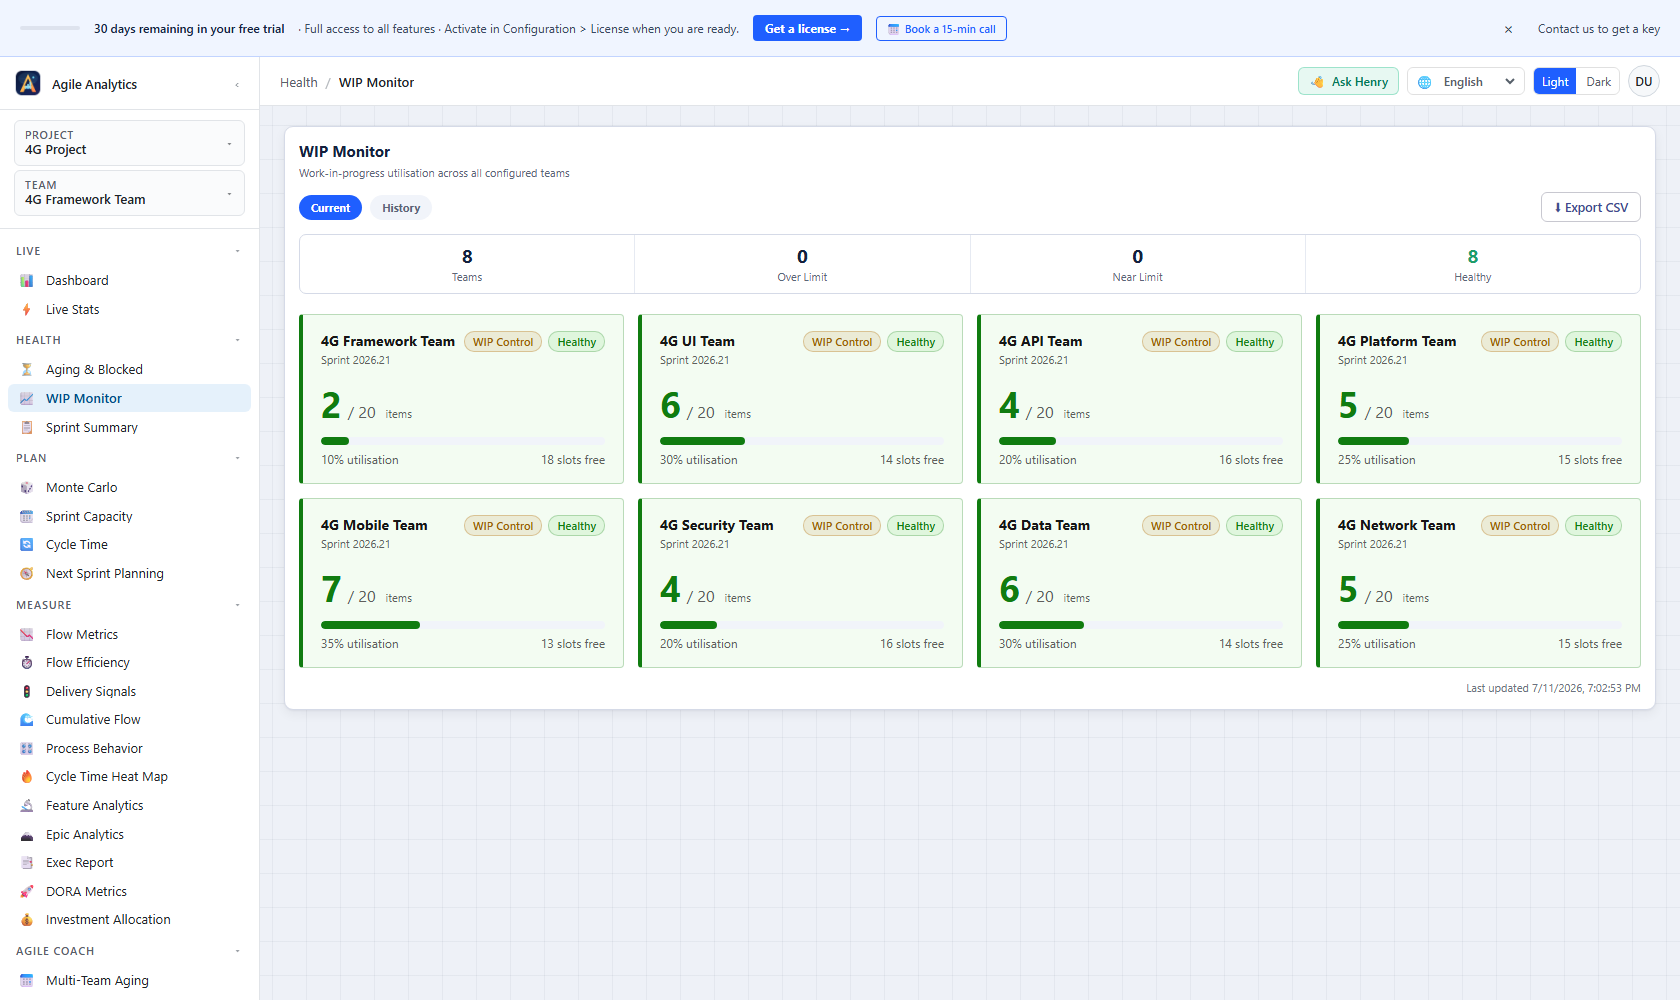
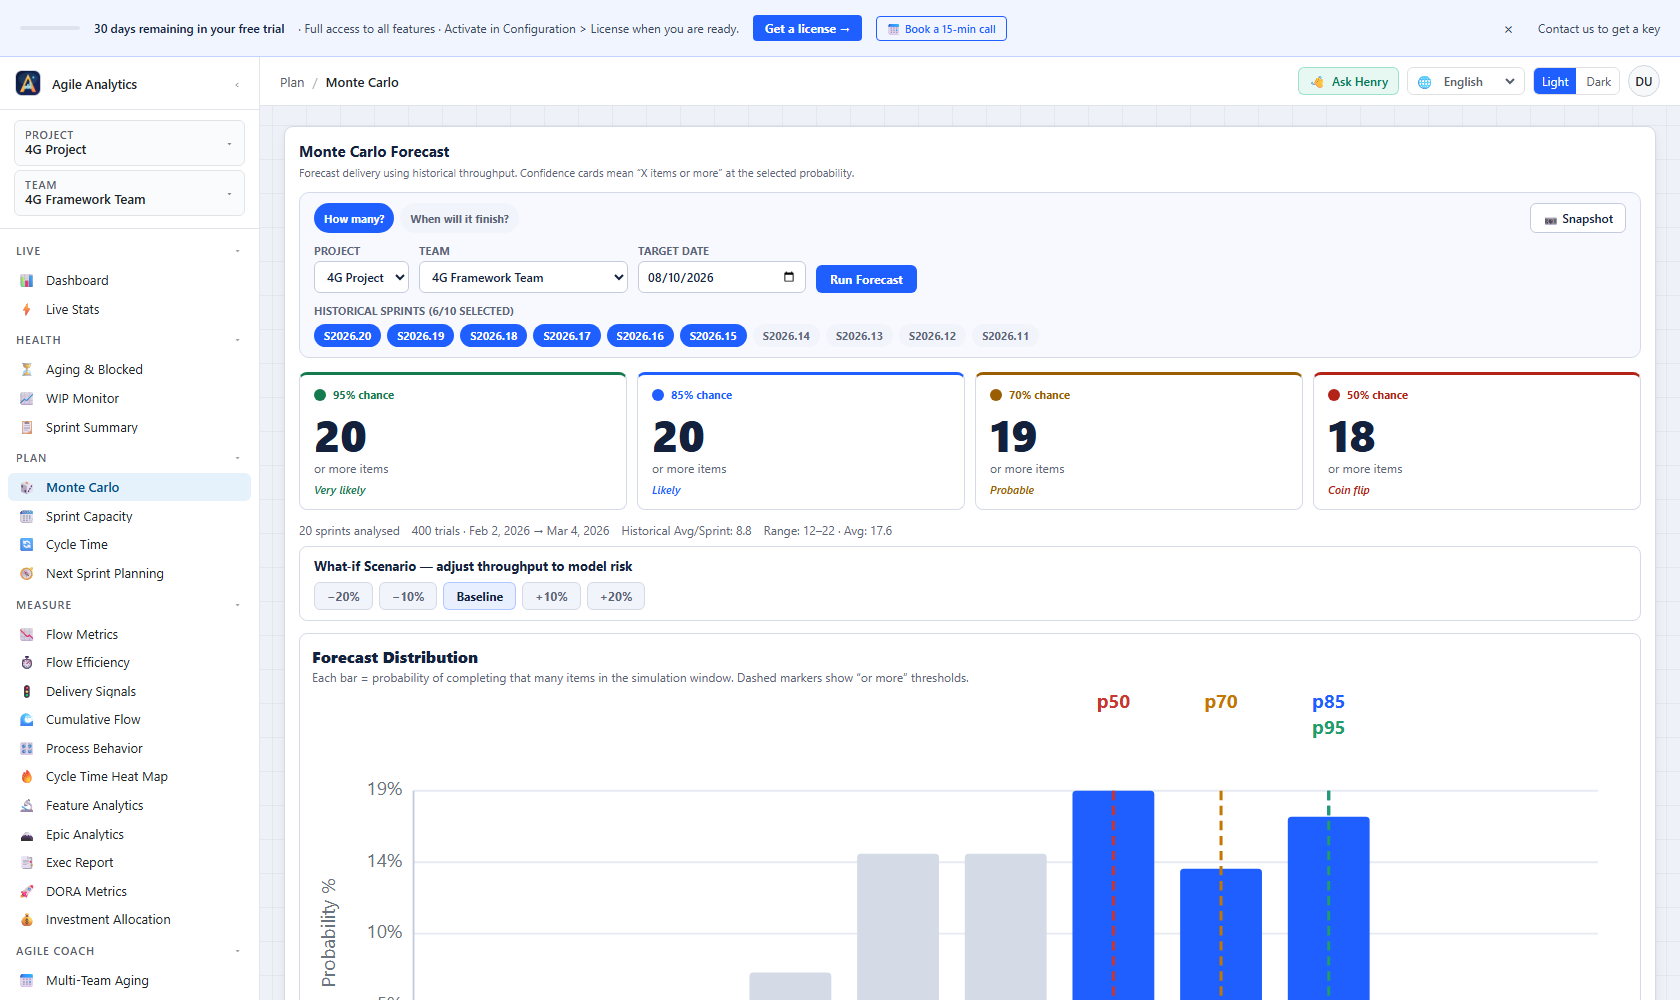
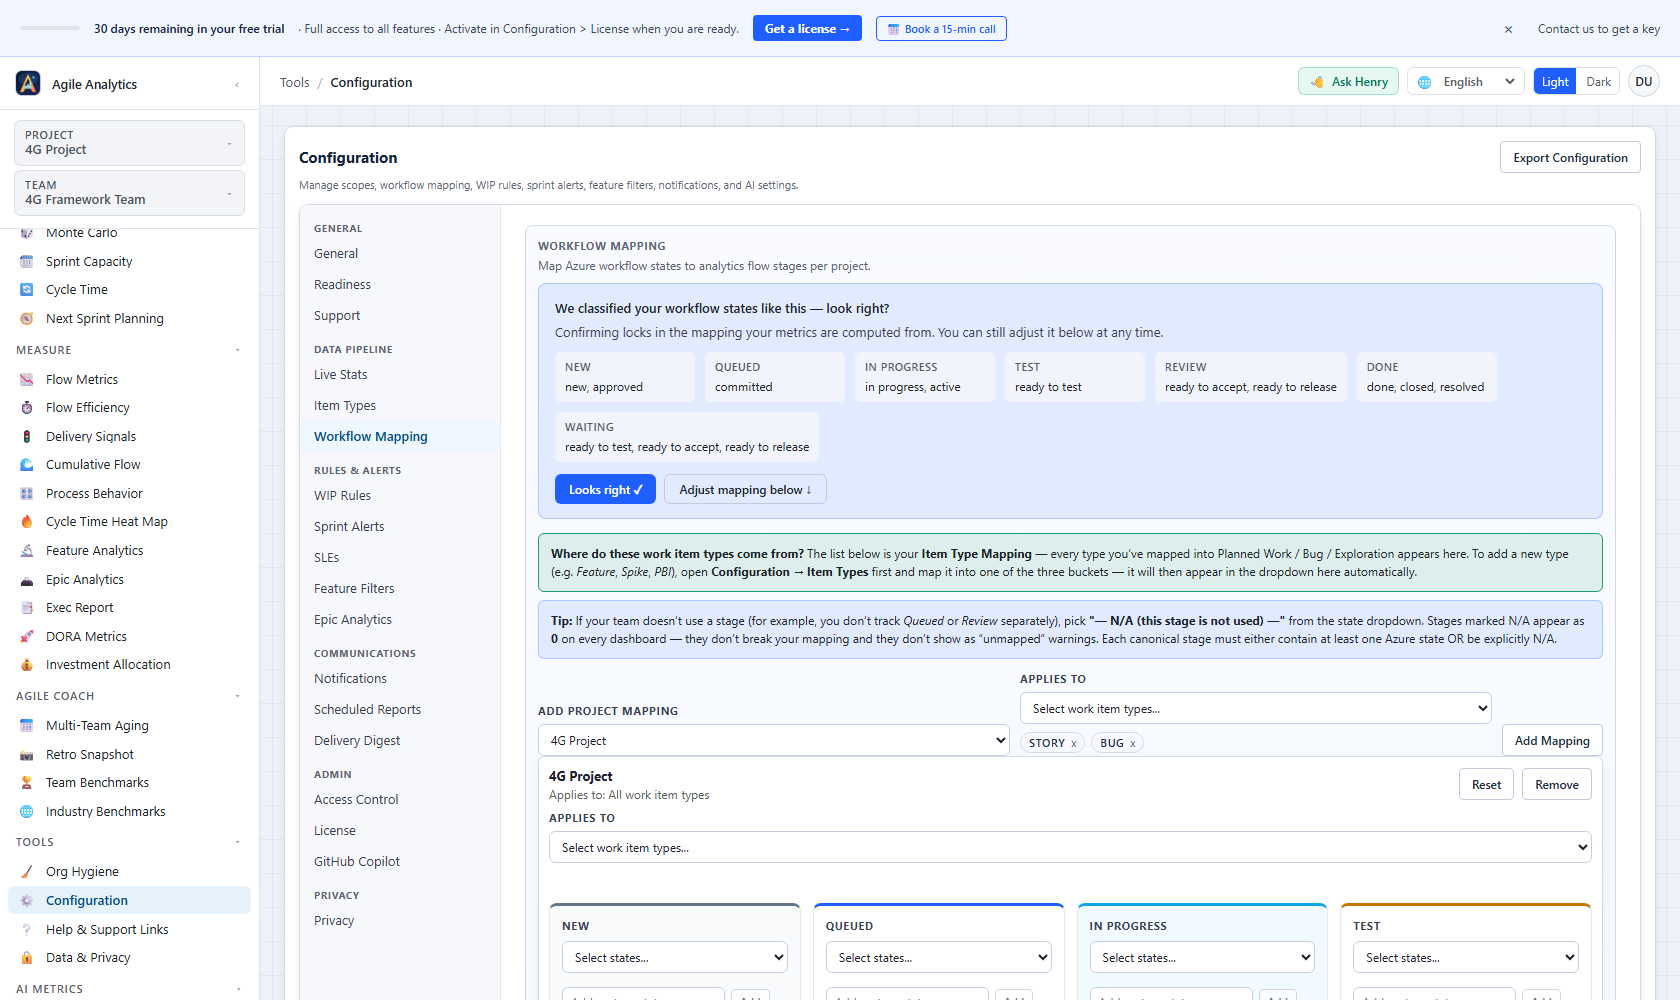
A failure in any layer stops the release from being packaged. What's New in Version 6.50v6.50.0 — Every view shows the numbers you asked for, and a bad moment at Azure DevOps cannot cost you your settings (September 2026)Switching team, sprint, window or project faster than Azure DevOps answers could leave the previous scope's numbers on screen under the new name, with no error and no way to tell: throughput, cycle time, DORA figures, cumulative flow, the heat map, delivery signals, the executive report and the investment split were all affected. Every one of those views now draws only the load you actually asked for. Separately, four stored settings documents (personal preferences, notification webhooks, work item type lists and Investment Tags, and the access-control list) used to treat a failed read as "nothing saved yet" and could then write the built-in defaults over your real document on the next save, with a green "saved" message. A read that fails is now never remembered and nothing is ever written over a document we could not read; you see a plain "nothing was saved, try again in a moment" instead. When Azure DevOps is busy, a sprint that came back short is retried and, if still short, flagged with the "some data could not be loaded" notice on the Dashboard, Sprint Summary, Flow Metrics and Cycle Time rather than presented as complete. Team Benchmarks, Team Health, Delivery Signals and the CSV exports show honest blanks instead of fake zeros, and sprint dates read correctly west of UTC. Feature Analytics and Epic Analytics open far faster and gain a Refresh button, Live Stats loads its teams four at a time, and the hub no longer downloads five languages nobody is reading. Dialogs, tabs, chart descriptions and form controls now work with a keyboard and a screen reader, Configuration, Readiness and the AI Metrics analysis are translated into all six languages, dashboard tiles can be configured again from their Configure panel, and "Export Configuration" now includes your Item Types and Investment Tags setup. What's New in Version 6.49v6.49.2 — Your tag lists reach every team, and stay put (September 2026)If your organisation had set up Investment Tags and a team also had its own Item Types settings, that team never saw the tags. On Sprint Summary its exploration-tagged work stayed in the row its work item type gave it instead of moving to Exploration, so the Exploration figure read low with nothing on screen to say why. Tag lists are organisation-wide settings, edited in one place, so every team now reads your organisation's lists while a team's own item type lists keep working exactly as they did. Sprint Summary figures can move for those teams, and the new figure is the corrected one. Investment Allocation was never affected: it always read the organisation's lists. A team's own Item Types settings now reach every view that shows that team. Sprint Summary and Live Stats already counted such a team by its own work item types, while Cycle Time, the cycle time heat map, Sprint Burndown and Next Sprint Planning counted it by the project's — and where a view only counts the types it recognises, work of a type only the team's own settings named was left out of those views entirely. Figures can move on those views, and only for teams that have their own Item Types settings. Two ways the Item Types tab could save settings nobody chose are also fixed. If you had set up Investment Tags but left your work item types at the built-in defaults, opening Configuration offered to detect the types your process uses and asked you to press Save — and that suggested draft did not carry your tag lists, so saving it dropped them while still reporting a successful save. The suggestion now keeps your tag lists. Separately, choosing a second team briefly showed the previous team's lists under the new team's name while Save stayed available, so a quick click could give a team an item type list nobody picked for it; Save now waits until that team's own lists have loaded. v6.49.1 — A reopened item is measured the same way everywhere (September 2026)Flow Efficiency stopped its clock the first time an item reached done, so an item that was closed, reopened and closed again showed only its last stretch of work: one story read 1.2 days there and 10.2 days on Cycle Time, the heat map and the Executive Report. It now measures from the first start to the final close, like every other view, and the time an item sat closed before someone reopened it counts as waiting rather than as work. The same measurement feeds the dashboard flow-efficiency figure and the Service Level Expectation tables, so those can move for teams with reopened items. On Flow Metrics, the throughput distribution counted the sprint in progress as a finished sample, so a team whose last three sprints delivered 6, 7 and 5 items saw an average of 6.0 above a histogram claiming 4.5 and "high variance"; the histogram now uses the same finished sprints as the average above it. DORA Metrics now says so when your organisation limits deployment frequency to selected pipelines and none of them ran in the project you are looking at, instead of implying every pipeline counts. Azure DevOps also no longer shows its "taking longer than expected to load" banner over a hub that had already loaded. v6.49.0 — Investment Allocation counts your tags, not ours (September 2026)Investment Allocation counted maintenance from a fixed list of seven tags, so a team that tags its maintenance work any other way saw 0% maintenance no matter how much of it it did. Under Configuration → Item Types, an admin can now edit that list: add your own tags, remove ones you do not use. A second list, Exploration tags, starts empty; add the tag you already put on spikes or investigation work and Investment Allocation gains an Exploration share alongside Features, Bugs and Maintenance, with Sprint Summary counting those items as Exploration whatever their work item type. Every item lands in exactly one bucket, and nothing changes until you edit a list — the built-in maintenance tags keep working exactly as before. These lists drive Investment Allocation and Sprint Summary in this release; the views that group by work item type only are unchanged. Saving your Item Types mapping, or reverting a team back to the project default, during a brief connection problem could write a settings document that was missing every other project's and team's mapping. The hub now refuses to save when it could not read the current settings, says plainly that nothing was saved, and lets you try again — the same protection version 6.48.4 added for your other settings. What's New in Version 6.48v6.48.4 — Your settings survive a brief connection problem (August 2026)When Azure DevOps briefly failed to return your saved settings, the hub treated that the same as never having any, showed the built-in defaults, and the next automatic save wrote those defaults over your real settings. The same could happen to your organisation's workflow mapping. The hub now tells the two apart: when it could not read a document it works from a temporary stand-in, never saves over the real one, and reads again a short while later. A save attempted during that moment says plainly, in your language, that nothing was saved, so you can try again. The protection does not depend on Azure DevOps reporting the failure: when a read comes back empty, the hub asks the store to create the document only if it truly does not exist, and the store refuses when it does. Dashboard customization also keeps a widget in place when you show or hide it, and reordering one widget no longer switches on the others. v6.48.0 — Refresh really refreshes (August 2026)Refresh now asks Azure DevOps again. On the Executive Report and on Sprint Summary, the button used to redraw the figures the hub already held, so pressing it after a board change produced the same page. Both now clear those held figures first, and Sprint Summary reloads its teams a few at a time instead of all at once. The WIP Monitor footer stopped claiming something it could not know. It read "Last updated" and moved to the current time whenever you opened the view, even when every number came from figures already held and nothing was fetched. It now reads "Snapshot", which is what that time has always meant. The Help page and the first-run sample card are translated. If you use Agile Analytics in Spanish, Portuguese, Italian, German or French, both were still answering in English. The GitHub Copilot setup note also now names the right kind of token, so following it gets you a token that works. Why Teams Choose Agile AnalyticsNo infrastructure — ever Everything runs in the browser against your live ADO data. No Azure Function, no database, no service connection to configure. Install, claim admin access, map your workflow states once, and it works across your entire organization. Sprint Capacity + Monte Carlo together Plan with capacity-adjusted commitments, then validate with a 10,000-run Monte Carlo forecast. The two views are designed to be used together before every sprint. WIP alerts that actually reach you Set WIP limits per team, connect a Teams or Slack webhook, and get notified the moment a team goes over — with a direct link to their active sprint taskboard. Background Monitor — alerts without the browser open Configuration generates the Azure Pipeline YAML for you. Your admin adds it to a repo, sets a cron schedule, and WIP alerts run automatically — even when nobody has ADO open. Zero external infrastructure, runs entirely within your tenant. Retro-ready in one click Copy any sprint summary in one click, or open the new Exec Report as a print-ready PDF for stakeholders. Paste it into your retro without formatting work. Role-based access control Built-in Admin/User role system with ADO directory search. Keep it open to all project users, or switch to assigned-users-only mode for controlled rollouts. Dark mode Full dark theme — persisted per user, toggled with one click. Getting Started in Under 2 MinutesStep 1 — Install Open the Marketplace listing and install the extension into your Azure DevOps Services organization. Step 2 — Open Navigate to any project → find Agile Analytics in the left navigation bar under your project name. Step 3 — Admin access is claimed automatically If you're a Project Administrator or Organization Administrator, Agile Analytics claims admin access for you the moment you first open it — no click required. If the first person to open it isn't an ADO admin, an admin can claim it manually from Tools → Configuration → Access Control by clicking Claim Admin Access. Step 4 — Review Workflow Mapping (required before broad rollout) The hub auto-discovers your board states on first open, so the views work straight away. Go to Tools → Configuration → Workflow Mapping to check what it found and map each state to an analytics flow stage — that is what makes cycle time and flow metrics accurate for your process, and it is worth doing before you roll the extension out to the team. Step 5 — Select your team and explore Use the team selector in the top-left corner, then browse views using the top navigation. Optional Visit Tools → Configuration to set WIP limits, add Teams/Slack webhook alerts, configure the Background Monitor, and run Readiness checks.
Access ControlAgile Analytics includes a lightweight built-in role system — no Azure DevOps group configuration required.
Settings are stored at organization scope in Azure DevOps Extension Data Service — one configuration shared across all users in the org. Organisation DefaultsMost settings in Agile Analytics are personal: each person picks their own thresholds, watched teams, units and chart controls. Configuration → Enterprise lets an admin set the starting point for all of them, so new people begin configured instead of on an empty setup.
Every admin change to access, seats, settings, workflow mapping, report subscriptions and privacy is recorded in an activity log with a CSV export. The baseline, the pick-up record and the activity log are stored in your own Azure DevOps organisation and are never sent to Baytek.
Notification AlertsConnect to Microsoft Teams or Slack to receive automatic alerts. Seven configurable triggers: Sprint Health
Flow & WIP
Digest
Configure in Tools → Configuration → Notifications. Paste your webhook URL, select triggers, and save.
Background Monitor — Alerts Without the Browser OpenConfiguration → WIP Settings generates a YAML file for your Azure Pipeline. After your admin adds that file to a repo and creates the pipeline, it runs on your chosen cron schedule, checks WIP limits, and posts to Teams or Slack automatically.
Permissions Explained
We request only what we use. No Requirements
FAQDoes this extension store my data anywhere? Your Azure DevOps work item content and sprint data stay in your browser and your ADO tenant — Baytek never sees them. The only data on Baytek systems is your licence record (organisation name, plan, expiry, activation token) and a lightweight install/heartbeat ping (organisation name, extension version, timestamp) so we can count active installs and detect outages. Settings, workflow mappings, AI adoption credentials, and access control are stored in your org's Azure DevOps Extension Data Service — Microsoft-managed infrastructure that Baytek does not access. Full details in the Privacy Policy. Will my settings be lost when the extension updates? No. All settings (WIP limits, workflow mappings, notification webhooks, AI configuration, access control, user preferences) are stored using the ADO Extension Data Service key-value API, which is version-agnostic. Upgrading never resets your configuration. Does it slow down Azure DevOps? No. The extension makes the same REST API calls you would make manually — one view at a time, only when you navigate to it. No background polling, no persistent connections. Why do I see no data on Cycle Time, Flow Metrics, or Flow Efficiency? These views require completed sprints with items in a Done/Closed/Resolved state. As of v6.1.0 your project's custom state names are auto-discovered — open Configuration → Workflow Mapping and assign each of your states to a stage (In Progress / Test / Review / Done). The Cycle Time preview panel under each mapping shows exactly which states will count. How does Sprint Capacity work? Sprint Capacity reads the capacity your team sets in Azure DevOps Boards (the days/hours per member per sprint). It calculates each member's available working days after personal and team-wide days off, computes effective team capacity as a percentage, and multiplies your average velocity by that percentage to suggest a realistic sprint commitment. If capacity hasn't been set in ADO Boards, the view will prompt you to add it there first. Do I need to configure anything before rollout? Admin access is claimed automatically when a Project or Organization Administrator first opens the extension. Before rolling out to the team, complete workflow mapping (Configuration → Workflow Mapping) — that's what makes cycle time and flow metrics accurate. Can I control who sees what? Yes — through the built-in Access Control. Admins can choose open access for all project users or restrict to assigned users only, and control which views regular users can see. Does it work across multiple projects? Yes. The extension installs at organization level and is available in every project. The current plan includes unlimited teams and projects across your organization. Is dark mode supported? Yes. Click the theme toggle in the top-right of the navigation bar. Preference is saved per user. What happens if I uninstall? Your ADO work items, sprints, and boards are completely unaffected — this extension only reads data, never writes to work items. Extension Data (settings, preferences, access control) is deleted on uninstall. What is AI Metrics and who can use it? AI Metrics is a company-wide AI adoption dashboard. It is included in the 30-day trial and every paid subscription. When no live AI source is connected, it shows realistic demo data so you can explore the layout. To connect a live source, go to AI Metrics → Settings (admin required) and enter your GitHub Copilot credentials. What is AIIP? AIIP (AI Improvement & Intervention Panel) is an admin-only companion to AI Metrics. It surfaces automated alerts when users are at risk of disengagement (low usage, high rejection rate, sudden drop), lets admins log interventions and mark them done, celebrates milestones, and can send Teams webhook notifications per team. Is there a record of administrator changes? Yes. The Admin activity log, on the Access Control tab, records configuration actions taken by administrators: access and role changes, seat assignments, workflow mapping saves, scheduled report changes, and the privacy setting. Admins can read it in the product and export it to CSV. It is stored in your own Azure DevOps organisation, so we never receive a copy of it. It is an operational record rather than a tamper-proof audit trail: it is kept in your extension storage, so anyone who can administer the extension can also change it. What are the dashboard widgets? Companion tiles in the Azure DevOps widget catalog, under the "Agile Analytics" category. The full analytics — team selection, history, and configuration — live in the Agile Analytics hub; a tile that cannot reach your data says so and points you to the hub. Frequently Asked QuestionsDoes Agile Analytics need a Personal Access Token (PAT)? No. It runs in your browser using your existing Azure DevOps session and four read-only scopes. There is no PAT to create, rotate, store, or leak — and no service connection to configure. Does my work-item data leave Azure DevOps? No. Every analytics view is computed in your browser against the Azure DevOps REST API. Sprint contents, work-item titles, code, comments, and PII are never sent to a Baytek server. This is the key difference from SaaS engineering-metrics platforms that pipe your data into their own warehouse. How is this different from the built-in Azure DevOps dashboards and Analytics views? Azure DevOps gives you raw widgets and OData feeds — you still have to build velocity, cycle-time, flow, and forecasting reports yourself. Agile Analytics ships 30+ ready-made views — Monte Carlo forecasting, cycle-time percentiles, flow efficiency, DORA metrics, investment allocation, and sprint-capacity planning — with zero query-building. Do I need to configure anything before I see data? No. On first open the hub auto-discovers your workflow states and renders your active sprint immediately. You can fine-tune the state-to-stage mapping later under Configuration → Workflow Mapping; a live preview shows exactly which states will count. Which processes does it support — Scrum, Kanban, SAFe, or a custom process? All of them. It reads your team's own workflow states, so custom Azure Boards processes and renamed columns work out of the box. Can it forecast when we'll finish? Yes. The Monte Carlo view runs thousands of simulations on your real throughput history to answer "how many will we finish?" and "when will this be done?" with P50/P85 confidence bands — no story-point estimation required. Does it work with Azure DevOps Server (on-premises)? Not in this version — Agile Analytics supports Azure DevOps Services (cloud) only. Is there a free trial, and how does pricing work? Yes — a 30-day free trial starts automatically on install, no credit card, and we extend it on request if you need longer to evaluate. After that it is an annual per-seat plan: Team ($300/year, 2 seats), Business ($1,200/year, 6 seats), or Premium ($2,000/year, unlimited seats) — each a 12-month subscription covering one Azure DevOps organisation. Every plan includes every feature. A seat is an assigned place your admin manages in Configuration → Access Control. Data & PrivacyWhat stays in your tenant: Azure DevOps work item content and any AI adoption credentials you enter. Baytek never sees any of this. What Baytek's backend receives: licence records (organisation name, plan, expiry, activation tokens); a lightweight install/heartbeat ping (organisation name, extension version, event type, timestamp); anonymous usage events (view navigation, configuration completion, trial-day milestones, and a pseudonymous per-user ID used to count active users and enforce seat limits; opt out at Configuration → Privacy); and, on Team/Business plans, a mirror of your Access Control list (person + role) so seat limits can be enforced. Plus, later in a trial, the signed-in admin's ADO email address, captured from your existing session to send trial milestone reminders — shown in-product with a short window to undo it, and every reminder carries a one-click unsubscribe link. If you schedule an Exec Report or opt into Industry Benchmarks, that feature's own project/team/sprint or aggregate-metric data reaches Baytek too. See the numbered list above for exactly what each one sends. Optional integrations: when you connect GitHub Copilot for AI Metrics or set up webhook notifications, requests go from your browser directly to that source ( Privacy Policy | Terms of Service | Support & Feature Requests | Getting Started Guide |