Skip to content
| Marketplace
Sign in
Azure DevOps>Azure Boards>Project forecast
Project forecast

Project forecast

Arkadium

|
2,594 installs
| (7) | Preview
Project forecast (#NoEstimates) tool helps teams stay on track, see their performance and be able correctly forecast future deliveries
Get it free

Project forecast (#NoEstimates) tool helps teams stay on track, see their performance and be able correctly forecast future deliveries

References

This tool based on ideas of #NoEstimates and implements statistical methods mentioned here Agile Project Forecasting – The Monte Carlo Method and here #NoEstimates Project Planning Using Monte Carlo Simulation

For a better understanding of how to apply these methods to your project, we recommend that you read these books:
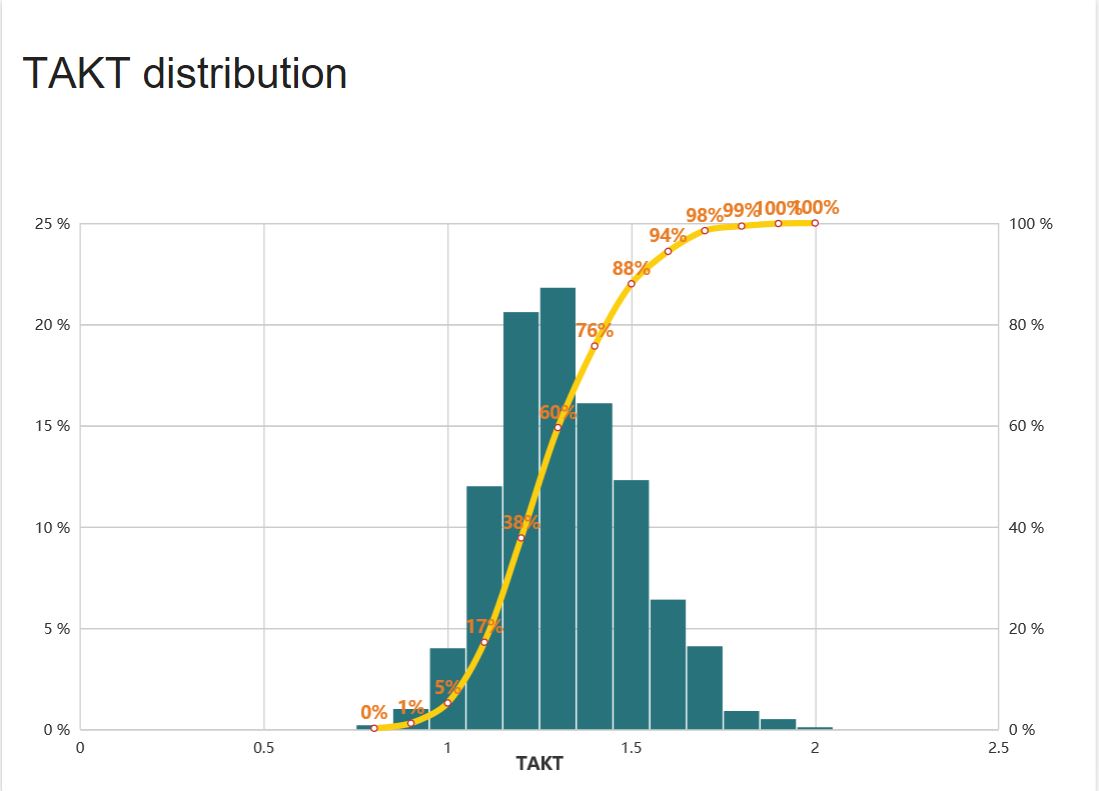
  1. Anderson, D. J. (2003). Agile Management for Software Engineering: Applying the Theory of Constraints for Business Results. Prentice Hall.
  2. Flyvbjerg, B. (2007). Eliminating Bias in Early Project Development through Reference Class Forecasting and Good Governance. Trondheim, Norway: Concept Program, The Norwegian University of Science and Technology.
  3. PMI. (2009). A Guide to the Project Management Body of Knowledge. Project Management Institute.
  4. Savage, S. L. (2012). The Flaw of Averages: Why We Underestimate Risk in the Face of Uncertainty. Wiley.
  5. Taylor, F. W. (2006). The Principles of Scientific Management. Cosimo Classics.
  6. #NoEstimates by Vasco Duarte

What options do I have

Project performance tool uses data from your backlog to generate two charts.

The first one, called, “TAKT distribution”, shows TAKT distribution for your team measured in {days}/{story}. This calculation is derived from your teams completed sprints, and you have the option to specify how many sprints/iterations you wish to take into account. You can use this data to estimate how your team takes to accomplish one user story/backlog item. TAKT Chart

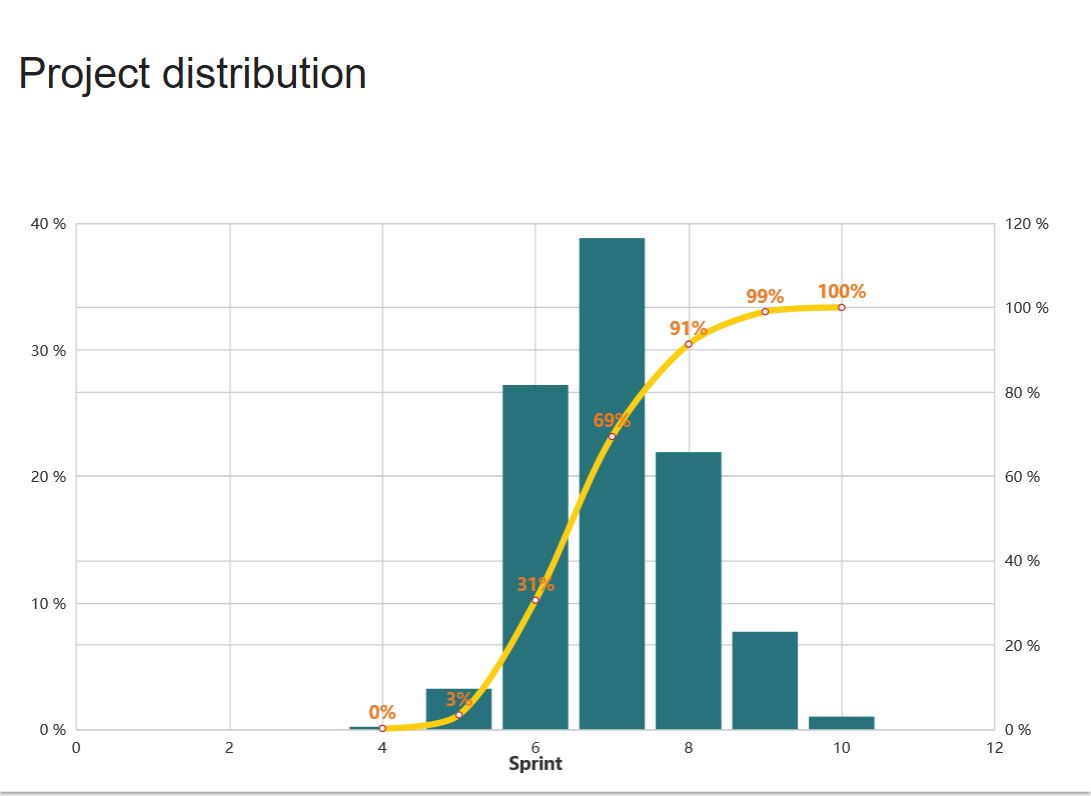
The second chart, called “Project Distribution”, shows how many sprints/iterations (days/date) your team will need to finish work items that are in progress or in your backlog. You can use this data to estimate how long it will take your team to finish the rest of your project! TAKT Chart

Settings panel: Amount of previous sprints. Type number of previous spints to collect your data from. In case of "Sprint" strategy (see bellow) data from current sprint/iteration will not be included. In case of "Day" or "Day (z-curve)" strategies data from current sprint/iteration will be included.

Use custom amount of work items. You can type desired amout of user stories/backlog items that you want to forecast in term of completion.

ID of Feature for forecast. If you need to make a forecast for a single feature only you can filter your results by typing its ID.

There are three strategy to collect your data and make a forecast. Use "Project distribution unit" dropbox to enable one of them.

  1. "Sprint". It's a really accurate approach, because it's pretty simple. Use it by default. But if your data period is too small (e.g. 3 sprints only), this means that your initial sample is really limited, and final forecast could be incorrect. Project distribution chart will show a resulting forecast in sprints.
  2. "Day". The main idea of this approach is that TAKT history is number of week-days between 2 completed user stories/backlog items in a row. So, TAKT history could look like [1,2,0,0,0,1,0,0,0,1,2,0,1,0,0,0]. You can also use this strategy to estimate any partition of work (several user stories/backlog items) to know what amount of days your team needs to finish them. So, you can even avoid using expert estimates for making decision of to go/not to go (if you have enough data). Project distribution chart will show a final forecast in days.
  3. "Day (z-curve)". This approach has own specifics and must be used in appropriate cases. But, if so, it can lead to really accurate forecast. The main idea is described in #NoEstimates Project Planning Using Monte Carlo Simulation. Assumption that a team tends to go by z-curve is taken into account. Same time this supposes that you must use data from very beginning of a project and number of user stories/backlog items to forecast has to relate to real number of left user stories/backlog items in the project. So, we look at the project from very beginning to very end. Project distribution chart will show a final forecast in days. Strategies #2 and #3 have special option. You can check "Dates" checkbox and you will see result of forecasting in dates, not in amount of days.

It's up to you what's strategy to use. But it's recommended to browse through each ones and observe dynamics. If all 3 strategies show similar results it's a good sign. On the one hand this means that your data have small volatility (so, "Sprint" strategy allows to make adequate forecasts). On the other hand you data fit into Z-Curve pattern - so, you have chose right time range for data that you want to build your forecasts on.

You can also highlight a particular percentile on the “Project Distribution” chart. Just to type specific value in "Show percentile" field.

There is a TAKT History under the charts. So, you can use your data outside the extension. Displayed array is exactly the data your forecast was built on. It corresponds to chosen time range and data collection strategy.

  • Contact us
  • Jobs
  • Privacy
  • Manage cookies
  • Terms of use
  • Trademarks
© 2025 Microsoft