FlowVizData visualization, metrics and reporting in Power BI for Agile teams using Azure DevOps |


FlowViz - Data visualization for teams using Azure DevOpsWhat is it?This dashboard is for all Agile teams using Azure DevOps (formerly VSTS), who want to leverage their data to have better conversations and make more informed decisions. It was built due to years of frustration with 'velocity' and other traditional agile metrics. These are centered on flow, as well as providing forecasting techniques you can use to give customers greater confidence/transparency in your delivery. Prerequisites
Connectivity
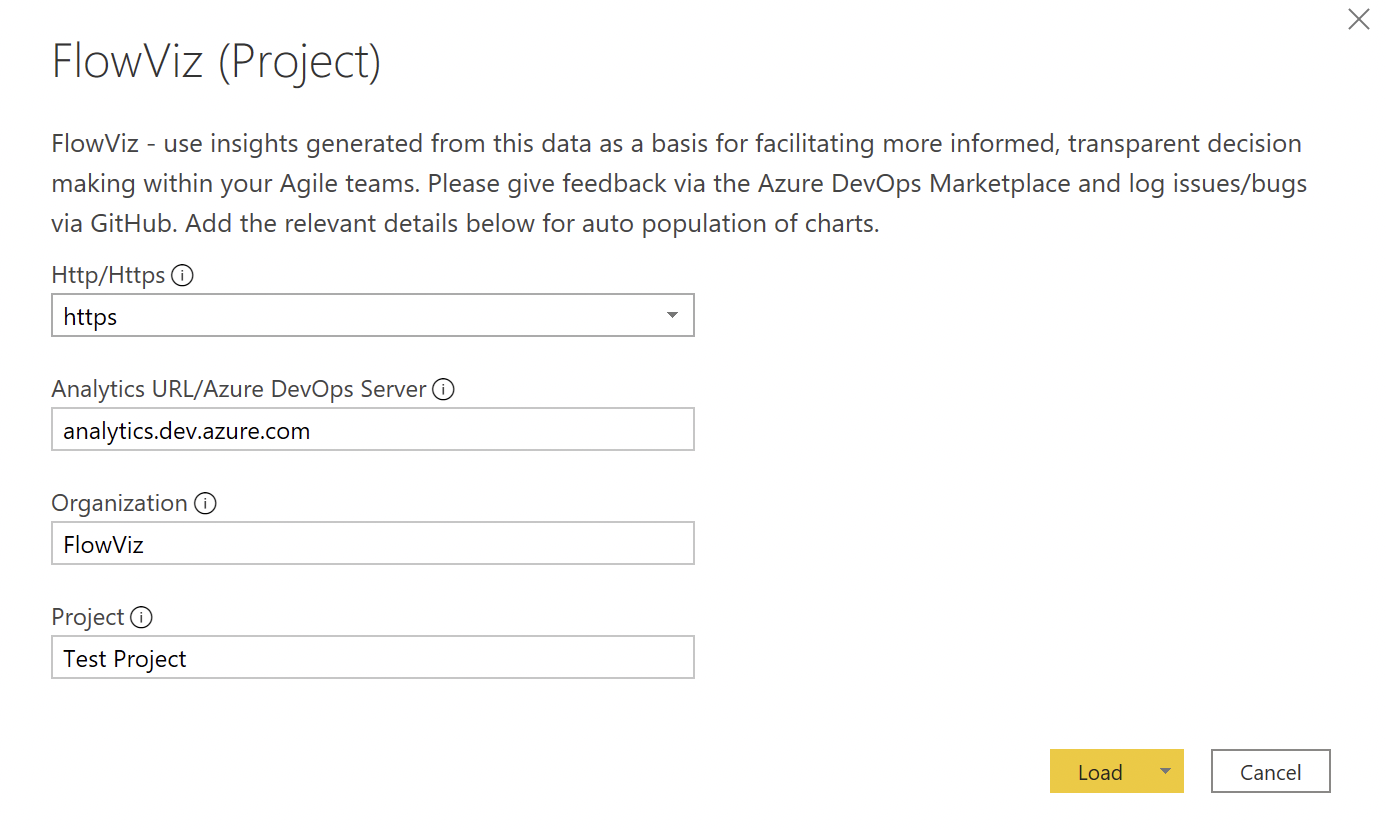
Don’t confuse the team name with the project name, a common mistake. If the URL you use is “http://dev.azure.com/Microsoft-UK/AzureDevOpsTeam/Database”, then Microsoft-UK is the Organization Name, AzureDevOpsTeam is the Project name, Database is the team name. Example - connecting to Azure DevOps Services
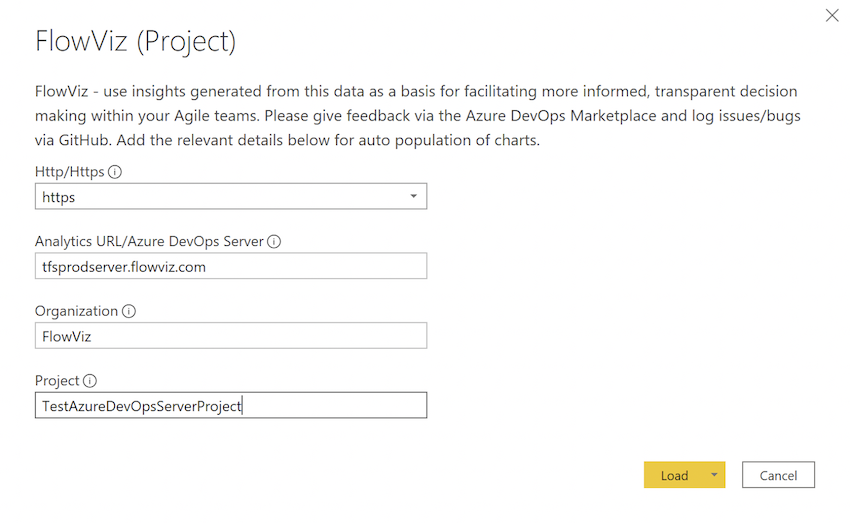
Example - connecting to Azure DevOps Server
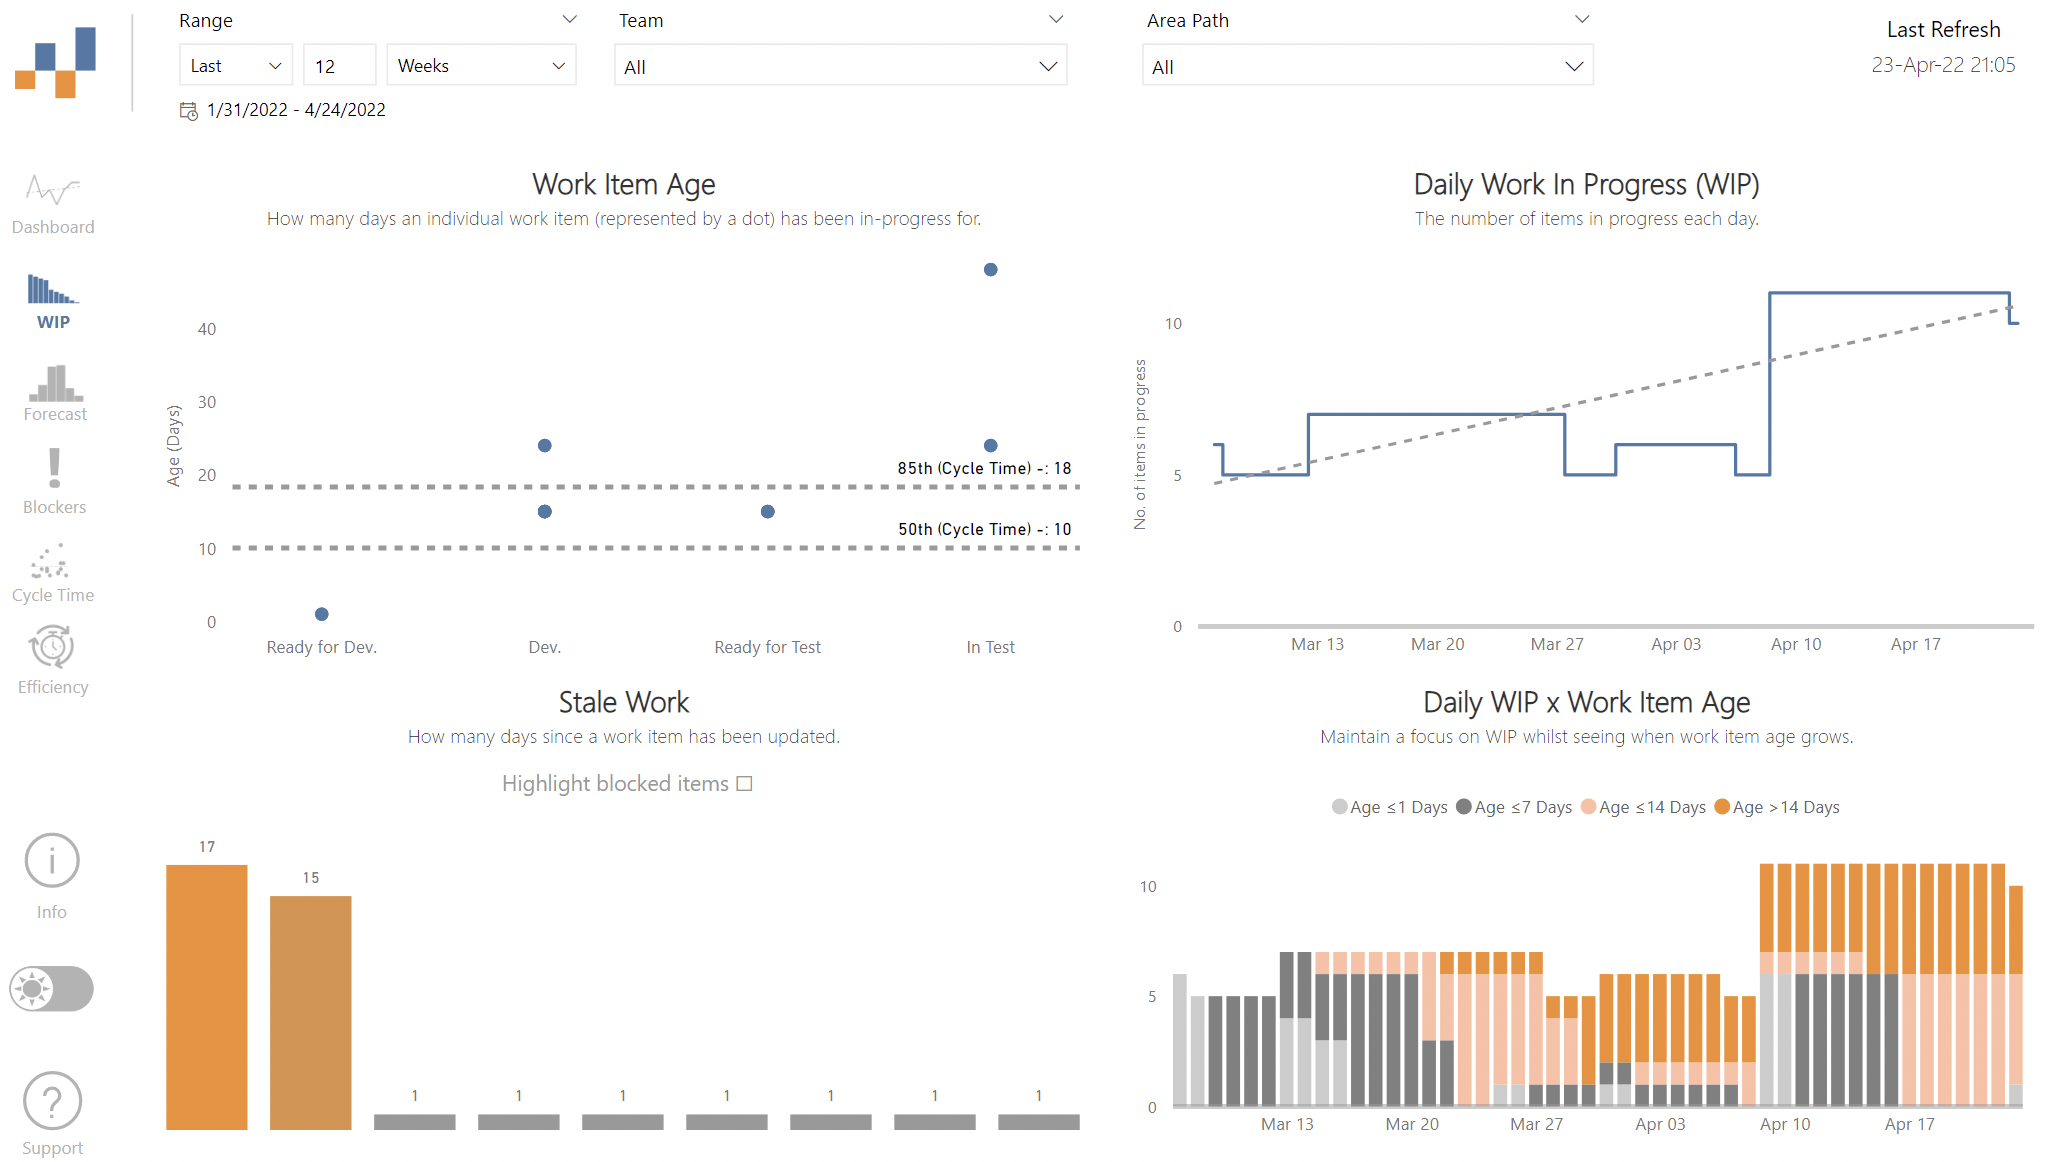
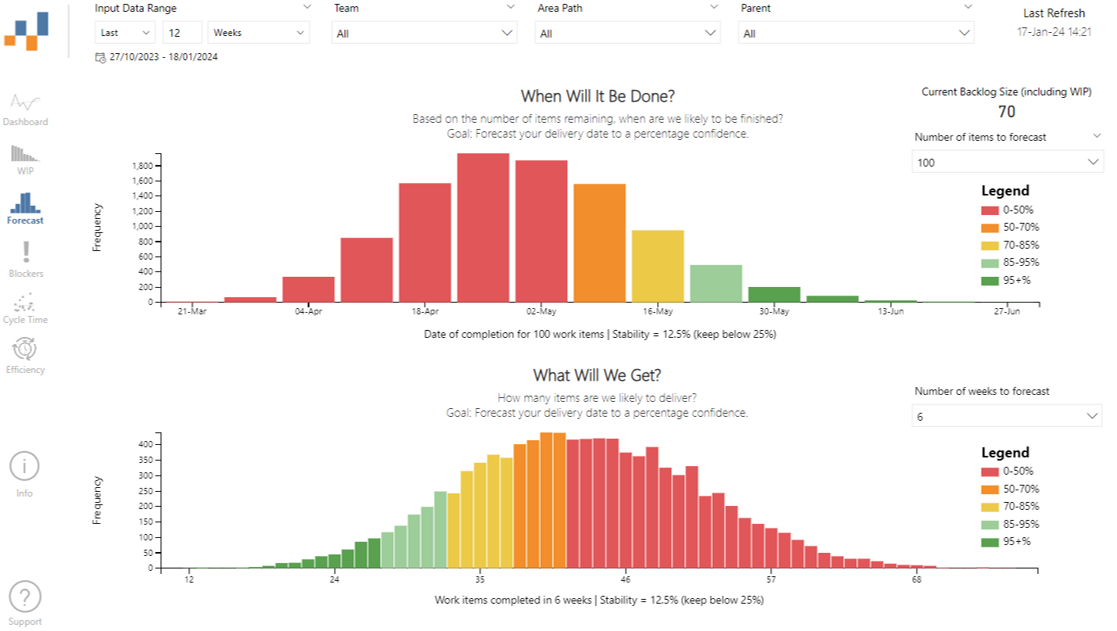
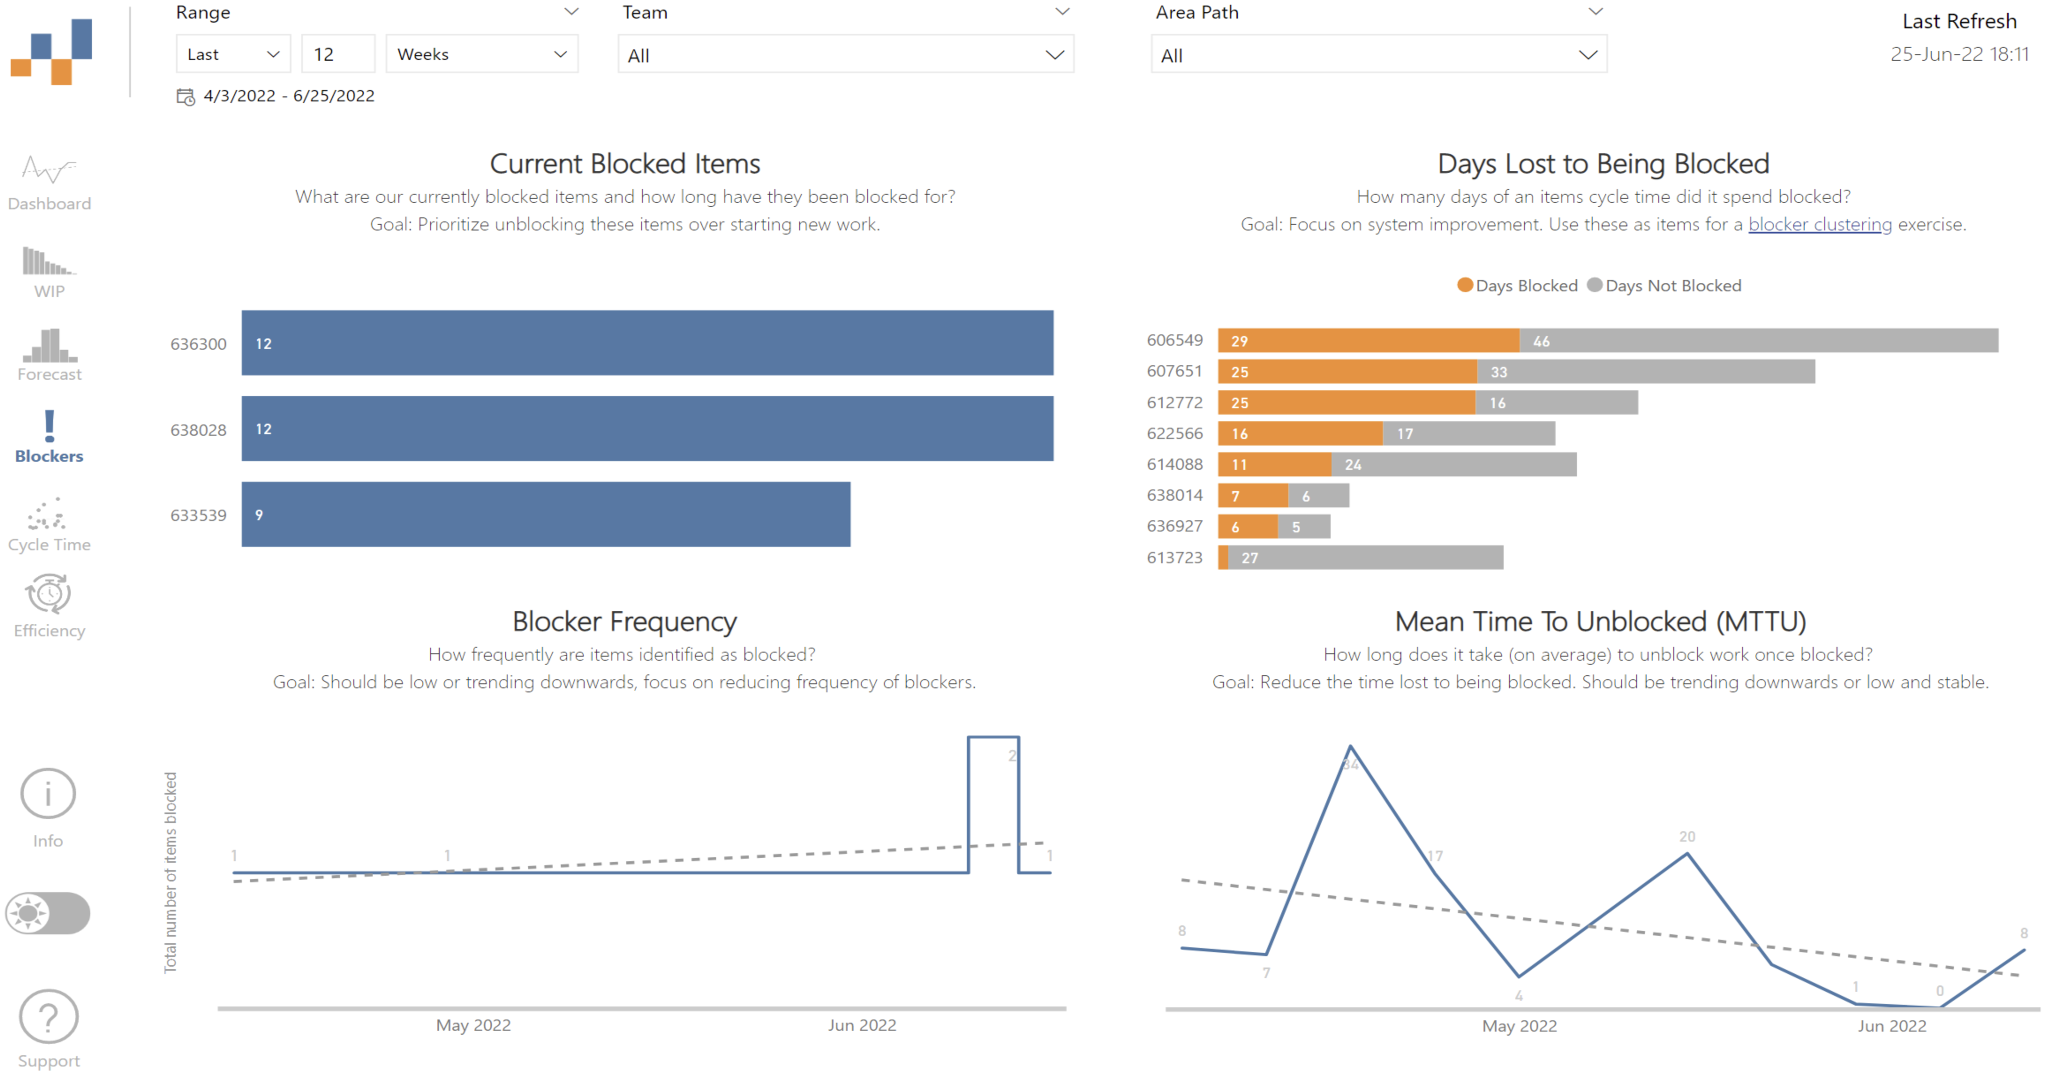
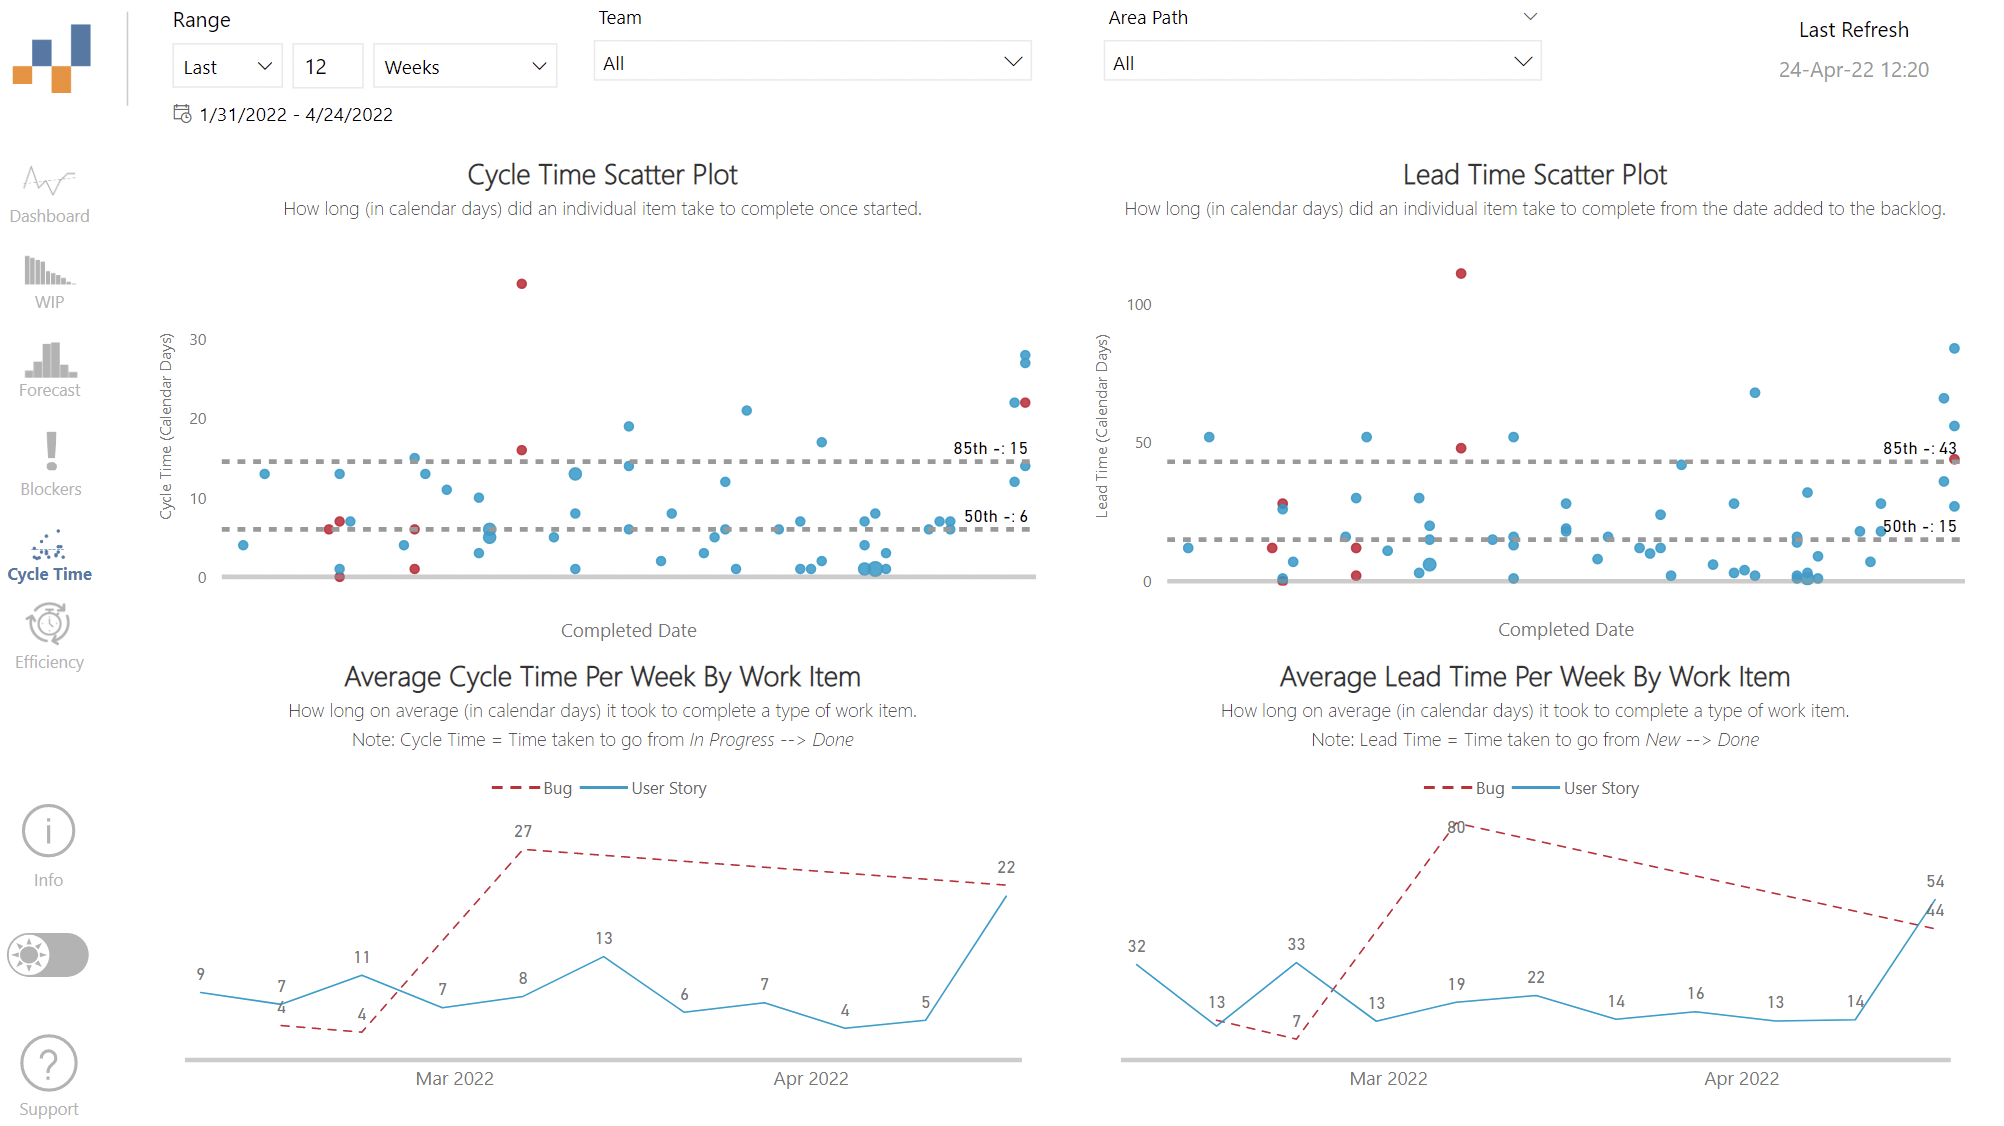
What do these charts mean? How can I learn more?There is a FlowViz Fundamentals course now available. For questions on charts, how to use them and other questions check out the Wiki. If you want to embed these charts into Azure DevOps, check out this brilliant blog for guidance. Screenshots
FeedbackFlowViz is built and maintained by Nicolas Brown and is published using Agile Extensions for assistance (big thank you to them!) Please email nicolas.brown@outlook.com for ideas, improvements and feedback. You can also ask in the #flowviz channel in the Azure DevOps Club Slack community:
Thank youThank you to all the people who helped build this, providing feedback and answering my questions especially: |