Xamarin.Forms Maps – Syncfusion Xamarin UI ControlsThe Xamarin.Forms maps renders map using shapes data or from map providers like OSM, Bing Maps, Google Maps. It has highly interactive and customizable features such as zooming, panning, selecting, le |
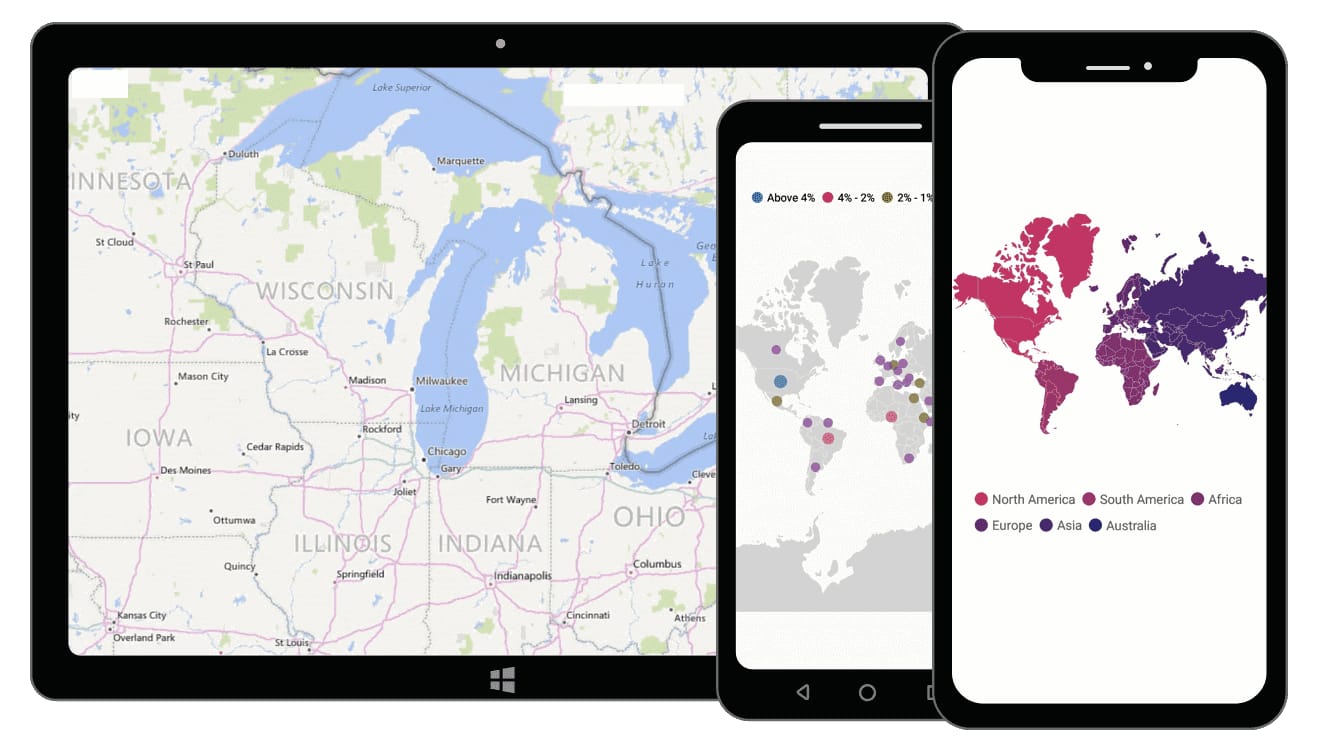
The Xamarin.Forms Maps control is a powerful data visualization component that displays statistical information for a geographical area. It has highly interactive and customizable features such as zooming, panning, selecting, legends, markers, bubbles, and color mapping. Using the maps control, you can render various maps, such as sales, political-boundary, weather, electoral, and route maps, and much more.
Features and BenefitsShape layersShape layers provide options to render geographical shapes or custom shapes on maps. DataShapefiles (.shp) and GeoJSON (.json) data can be bound to maps to render any geometric shape. CustomizationThe default style of a shape can be customized using the color, stroke, and thickness properties. Custom shapesThe Xamarin.Forms Maps control allows you to render any custom shape to make a map look like building infrastructure, a sports stadium, plane or bus seat arrangements, and more. SublayerLoad multiple shape files in a single map view. For example, add a sublayer over a main shape layer to view geographic features of a country such as rivers, valleys, and cities. Imagery layersImagery layers let you visualize satellite, aerial, street map, or other imagery tiles without using shapefiles. OSMXamarin OpenStreetMap (OSM) is a map of the world built by a community of mappers that is free to use under an open license. It allows users to view geographical data in a collaborative way from anywhere on Earth. Bing MapsXamarin Bing Maps is a map of the entire world owned by Microsoft. It supports three types of map views: aerial, aerial with labels, and road. Auto zoomSet the initial zoom level automatically based on map geo-bounds or distance (in kilometers or miles) from a geo-point center value. Data labelsMap shapes can be easily annotated with labels to improve the readability of particular shapes’ names. Label customizationThe look and feel of the default labels can be customized using the font style, size, and color properties. Smart label alignmentsLabels can be aligned smartly within shape boundaries and can be trimmed or hidden to avoid labels overlapping. Heat mapProduce a heat map by customizing the shape colors based on the underlying shape values. Equal color mappingEqual color mapping differentiates a shape’s fill color based on its underlying value and color. For example, colors can be applied to states based on their winning political candidates. Range color mappingColors can be applied to shapes by comparing their values with desired numeric ranges. For example, colors can be applied to states based on their population density. Maps markersMarkers allow you to denote a place with symbols or display some message at a specific latitude and longitude on a map. Marker typesThe marker type can be changed to built-in shapes such as circles, diamonds, rectangles, or squares to highlight a place. Custom markersMarkers can be customized by adding images or any custom shape to highlight a location. Maps bubblesBubbles are used to add additional information to shapes such as population density or land area. They are rendered with various magnitudes and colors based on the underlying data values of the shapes. Color customizationThe default color of a bubble and its transparency can be customized using the fill and opacity properties. Size customizationThe minimum and maximum sizes of a bubble can be customized. Maps legendA legend is used to provide valuable information for interpreting maps with various colors, shapes, or other identifiers based on the data and application requirements. Legend positionThe position of a legend can be changed or moved to any place inside the maps. Icon customizationThe default size of a legend icon can be customized. User interactionsThe end user experience is greatly enhanced by a set of user interaction features such as selection, zooming, and panning. SelectionA particular area or shape can be selected or highlighted on user interaction to bring the center of the view over other shapes in a map. ZoomingZooming allows end users to get a closer look at a particular area of interest on a map by stretching and pinching it. PanningPanning allows end users to move a map around to focus on a specific area and navigate across its regions. Get the Demo ApplicationExplore the full capabilities of our Xamarin controls on your device by installing our sample browser applications from the matching app stores.
Related LinksDownload Free Trial About Syncfusion Xamarin UI ControlsSyncfusion's Xamarin.Forms library offers over 150 UI controls to create cross-platform native mobile apps for iOS, Android, UWP and macOS platforms from a single C# code base. In addition to Maps, we provide popular Xamarin controls such as DataGrid,Charts, ListView, Diagram, and PDF Viewer. About SyncfusionFounded in 2001 and headquartered in Research Triangle Park, N.C., Syncfusion has more than 38,000 customers and more than 1 million users, including large financial institutions, Fortune 500 companies, and global IT consultancies. Today, we provide 1700+ controls and frameworks for web (ASP.NET Core, ASP.NET MVC, ASP.NET WebForms, JavaScript, Angular, React, Blazor, Vue, and Flutter), mobile (Xamarin, UWP, JavaScript, and Flutter), and desktop development (Windows Forms, WPF, UWP, Flutter, WinUI, and .NET MAUI). We provide ready-to-deploy enterprise software for dashboards, reports, data integration, and big data processing. Many customers have saved millions in licensing fees by deploying our software. sales@syncfusion.com | Toll Free: 1-888-9 DOTNET |