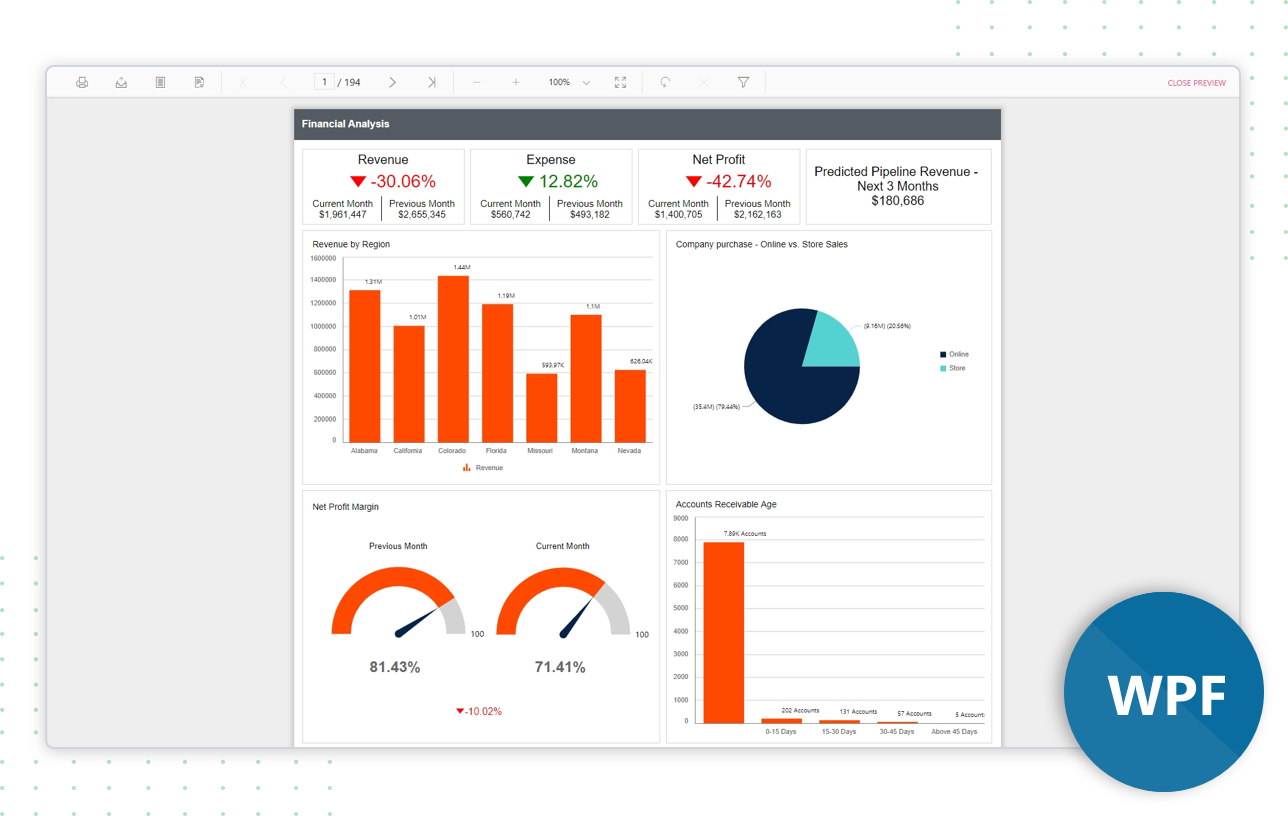
WPF Report Viewer – Reporting Tool BoldReportsThe WPF Report Viewer is a .NET reporting tool that displays SSRS, RDL, and RDLC reports within WPF applications. You can export the report to PDF, Excel, CSV, Word, PowerPoint, and HTML formats. |

Desktop Report Viewer to visualize data in meaningful ways and export SSRS RDL and RDLC reports. It empowers your application with all major capabilities of RDL reporting such as parameters, variables, expressions, code modules, calculated fields, sorting, grouping, filtering, paging, report linking, drill down (toggle item), drill through, hyperlink and more. You can export the report to PDF, Excel, CSV, Word, PowerPoint, and HTML formats.
How the Report Viewer helps? Saving time Features and BenefitsReport data sourceConsume data from a wide variety of data providers that are in local or server databases:
Eye-popping data visualizationVisualize the powerful insights from your data using the a variety of report items:
Presentation-ready reportsVisualize your information with unmatched clarity by highlighting data on demand. Supported data customization options include:
Data shapingView organized and shaped data to make bolder business decisions using the following techniques:
Report parametersParameters are the most widely used functionalities to interact with RDL/RDLC reports at runtime. The following parameter types allow you to modify the data presentation to provide an enhanced user experience:
Interactive reportsDisplay data in data regions that support user interactivity at runtime with features like drill down, drill through, hyperlinks, subreports, and nested data regions. Multicolumn reportsAllows the user to visualize the data across multiple adjacent columns such as mail merge, business cards, newspaper, and more. Print previewProvides support to set up print options like paper size, margins, and orientation of the printable output and preview the result. Print and exportEffortlessly print and export report contents by just clicking the print/export option in the toolbar. The most popular file formats such as PDF, Word, Excel, CSV, PowerPoint, XML, and HTML are supported. CustomizationSupports complete customization to entirely change the appearance of the toolbar and parameter layout to fit your application’s look and feel. Related linksAbout Bold Reports powered by SyncfusionAfter nearly two decades of seeing how companies used its industry-leading components, Syncfusion discovered a need to simplify how enterprises create, store, and share vital business reports. With this in mind, Syncfusion concentrated its efforts on Bold Reports, a web-based report management solution that handles the minutiae, so you can see the big picture. Make and edit reports with the Report Designer, which leverages Syncfusion’s UI expertise to provide dozens of report items, interactive features, appealing styles, and customizable formatting options. Then, use the Report Server to publish and export your reports, manage their access permissions, and deliver them to users on the web. When reports are available anywhere, pertinent stakeholders can collaborate to make better business decisions. Our embedded reporting solution lets you integrate the capabilities of our reporting tools, such as the Report Viewer and Report Designer, into other software applications. Our reporting tools can integrate into leading web frameworks: ASP.NET Core, ASP.NET MVC, ASP.NET Web Forms, JavaScript, Angular, React, Blazor. You can also integrate our reporting tools into WPF and UWP developments. Business reporting doesn’t have to burden your IT team or your budget. Contact us today to learn how Bold Reports can transform the way you present your data.
sales@syncfusion.com | www.boldreports.com | Toll Free : +1 888.936.8638 |