WPF Pivot Grid - Syncfusion WPF UI ControlsThe WPF pivot grid control organizes and summarizes business data and displays the result in a cross-table format. |
The WPF pivot grid control organizes and summarizes business data and displays the result in a cross-table format.
Features and BenefitsHigh performance
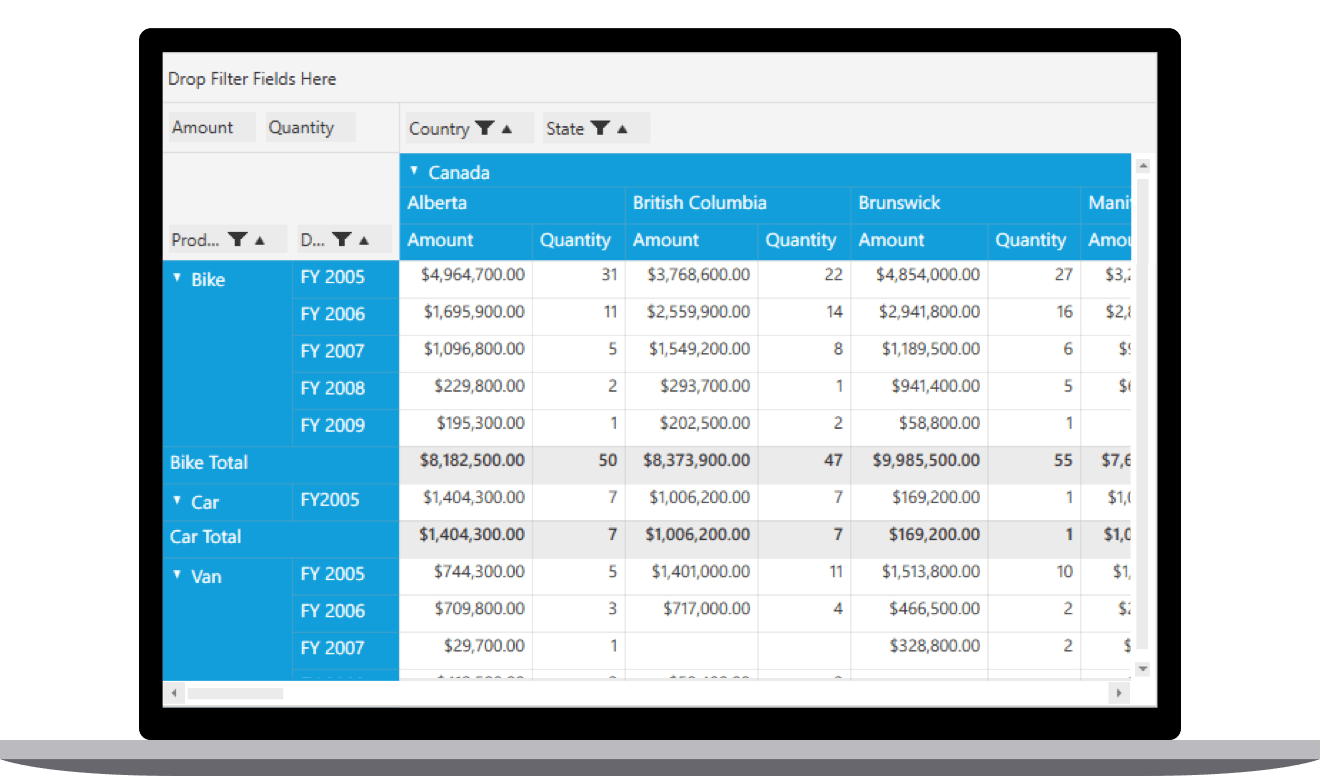
Data bindingThe WPF Pivot Grid control simulates the pivot table feature of Excel. The data source for the control should be either a DataTable, DataView, DataSet from SQL databases or collections like IEnumerable, ICollection, IList, List and ArrayList. Pivot table field list and group fieldsThe WPF Pivot Table field list and Group fields are automatically populated with fields from the bound data source. They later allow end users to drag fields, filter and sort them, and create a pivot report at runtime. Drill down and drill upDrill down (expand) and drill up (collapse) to visualize the pivot information in both abstract and detailed views. Defer updateRefresh the control only on demand and not during every UI interaction. Editing and updating
FilteringBuilt-in header and Excel-like filter UIs with advanced filtering options to easily filter and view data. It is also possible to filter programmatically. It is also possible to filter programmatically.
SortingOrder rows and columns, either based on labels or values.
Summaries and calculations
Calculated fieldThe calculated field, otherwise known as unbound field generates unique field with our own calculated value by executing a simple user-defined formula. Expression fieldExpression field generates data by executing user-defined expressions. The generated data is specific to a few field(s) from the underlying data source. Drill throughIt easily obtains a list of raw items for a particular value cell or summary cell. Cell templateFormat the column header, row header, summary cell, and value cell of the control. Conditional formattingDefine conditions that, when met, format values and summary cells font, color, and border settings. Number formatting and date formattingNumber formatting and date formatting help to transform the appearance of the actual cell value. VisualizationUsers can visualize the control either as a flat grid or a pivot table similar to Excel. Users can also position summaries at the top.
TotalsSubtotals and grand totals are calculated automatically by the pivot engine inside the control and displayed in the pivot grid. This helps users make decision based on the totals. Also, users can show or hide subtotals and grand totals for rows and columns. Column and row
Save and load reportsSettings in the WPF Pivot Grid control can be serialized to an XML format and loaded back through the built-in deserialization options. Exporting and printingThe WPF Pivot Grid control has a rich set of options available for exporting data to Excel, Word, PDF, and CSV, and printing the same. Several options are also provided to customize the exporting and printing operations. Related linksLearn More about WPF Pivot Grid About Syncfusion WPF ControlsSyncfusion's WPF controls library is the only suite that you will ever need to build an application since it contains over 155 high-performance, lightweight, modular, and responsive UI controls in a single package. In addition to Pivot Grid, we provide popular WPF Controls such as WPF DataGrid, WPF Scheduler, WPF Diagram, WPF Docking, and WPF PDF Viewer. About SyncfusionFounded in 2001 and headquartered in Research Triangle Park, N.C., Syncfusion has more than 38,000 customers and more than 1 million users, including large financial institutions, Fortune 500 companies, and global IT consultancies. Today we provide 1700+ controls and frameworks for web (Blazor, ASP.NET Core, ASP.NET MVC, ASP.NET WebForms, JavaScript, Angular, React, Vue, and Flutter), mobile (Xamarin, Flutter, UWP and JavaScript), and desktop development (WinForms, WPF, WinUI, UWP, Flutter, and .NET MAUI). We provide ready-to deploy enterprise software for dashboards, reports, data integration, and big data processing. Many customers have saved millions in licensing fees by deploying our software.
sales@syncfusion.com | www.syncfusion.com | Toll Free: 1-888-9 DOTNET |