JavaScript Stock Chart – Syncfusion JavaScript UI ControlsSyncfusion JavaScript Stock Charts (graphs) library has support to track and visualize stock price over a specific period using charting and range tools. Its rich feature set includes zooming, panning, tooltip, crosshair, trackball, range and period selector functionality. |
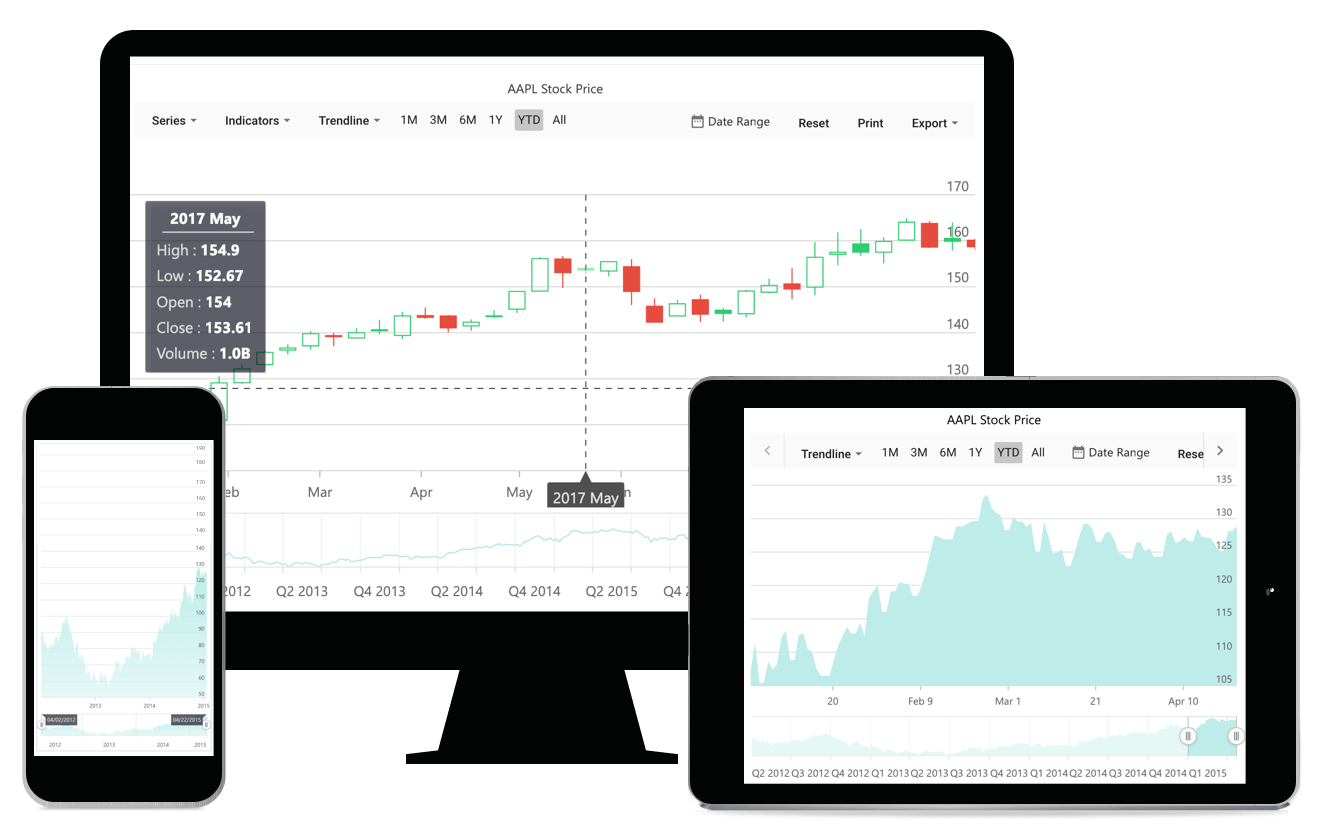
The JavaScript Stock Charts,is a well-crafted, easy-to-use financial charting package. Track and visualize the stock price of any company over a specific period of time using charting and range tools. The component comes with a lot of features such as zooming, panning, tooltip, crosshair, trackball, period selector, range selector, and events to make the stock charts more interactive.
Features and BenefitsHigh performanceSeveral data-rendering optimizations are included for the best possible performance when plotting large volumes of data and handling high-frequency real-time data. Interactive chartsThe end-user experience is greatly enhanced by including a set of interactive features such as zooming and panning, crosshair, trackball, events, and selection. Candlestick with volumeAnalyze both price action and volume at a glance. Multiple seriesPlot multiple series in a single chart to compare different stock values. Enabling the tooltip gives you more information about the individual series. Plot bandDraw special attention to any region of the chart or graph with the help of strip lines. Range selectorUse the range selector in JavaScript Stock Chart to filter a date range for data that needs to be visualized. Period selectorSelect data using predefined periods in the period selector in JavaScript Stock Chart and use the date picker to select a custom range. Series typeVisualize data using different series types like candle, OHLC, HiLo, line, spline, area, and spline area. The Series type in JavaScript Stock Chart can be changed using the series options in the period selector. IndicatorsUse technical indicators in JavaScript Stock Chart to analyze the past and predict the future market trends based on historic price, volume, or open interest. The Stock Chart supports 10 different types of indicators. You can add these indicators to a stock chart using the indicator option in the period selector. TrendlinesPredict future trends with predetermined data for any measurement such as the stock market or target revenue with the help of trendlines. You can add trendlines in JavaScript Stock Chart to a stock chart using the trendlines options in the period selector. Stock eventsJavaScript Stock events are used to show different kinds of market events on the chart. Use a flag, sign, pin, text, circle, or description. ThemesThe JavaScript Stock Chart ships with several built-in themes: Material, Bootstrap, Fabric (Office 365), and high contrast. Print and exportExport JavaScript stock charts to PDF documents or to image formats such as SVG, PNG, and JPEG in the client-side. Print the rendered stock charts and graphs directly from the browser. Globalization and localizationGlobalizationThe JavaScript Stock Chart enables users from different locales to use them by formatting dates, currency, and numbering to suit preferences. Stock charts and graphs use the Essential JS 2 internalization library for handling value formatting. LocalizationAll the stock chart strings in the user interface can be localized as needed. JavaScript Stock charts and graphs use the Essential JS 2 localization library to localize the strings. Web framework integrationRelated LinksLearn More about JavaScript Stock Chart About Syncfusion JavaScript UI ControlsSyncfusion's JavaScript UI controls library is the only suite that you will ever need to build an application since it contains over 155 high-performance, lightweight, modular, and responsive UI controls in a single package. In addition to Stock Chart, we provide popular JavaScript Controls such as JavaScript DataGrid, JavaScript Charts, JavaScript Diagram. About SyncfusionFounded in 2001 and headquartered in Research Triangle Park, N.C., Syncfusion has more than 38,000 customers and more than 1 million users, including large financial institutions, Fortune 500 companies, and global IT consultancies. Today we provide 1600+ controls and frameworks for web (Blazor, ASP.NET Core, ASP.NET MVC, ASP.NET Web Forms, JavaScript, Angular, React, Vue, and Flutter), mobile (Xamarin, Flutter, UWP and JavaScript), and desktop development (Windows Forms, WPF, WinUI, UWP, Flutter, and .NET MAUI). We provide ready-to-deploy enterprise software for dashboards, reports, data integration, and big data processing. Many customers have saved millions in licensing fees by deploying our software. sales@syncfusion.com | Toll Free: 1-888-9 DOTNET |