JavaScript Maps – Syncfusion JavaScript UI ControlsThe interactive JavaScript Maps control renders map using GeoJSON data or from the map providers like Bing, OSM, and supports wide range of features like markers, bubbles, data labels, navigation lines, tooltip, zooming, drill-down and much more. |

The JavaScript Maps is a data visualization widget, which renders map using GeoJSON data or from map providers like Bing, OSM, and supports tooltip, zooming, drill-down and many more features. Also it provides support to render your own custom shapes.
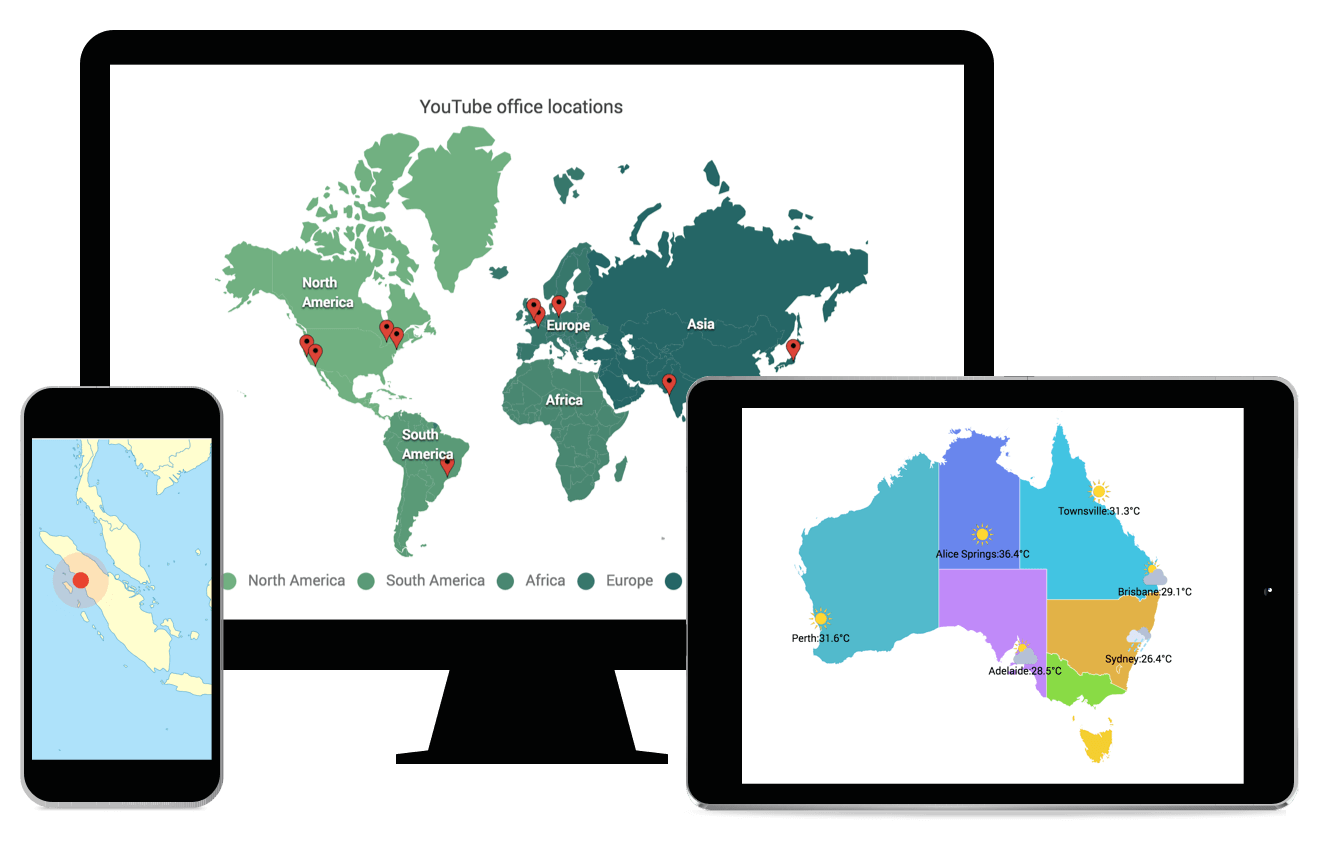
Features and BenefitsGeoJSON and Geo-imagery layerBind GeoJSON data to the maps to render any geometric shape in SVG (Scalable Vector Graphics) for data visualization of shapes. For example, render the world map or US map and customize it to the desired look using built-in options in the JavaScript Maps control. Add any number of layers to the maps. Maps elementsDenote more detailed information and improve the readability by adding the built-in map elements such as marker, data labels, bubbles, navigation lines and annotation. User interactionsEnrich the visualization by adding the built-in user interactive features such as tooltip, zooming and panning, drill-down, selection and highlight in the JavaScript Maps control. Custom shapesCreate a JavaScript map with custom shapes by rendering personalised GeoJSON data to indicate building infrastructure, points of interest, flight/bus seat arrangement, cricket stadium, and more. Color mapping and legendCategorize the shapes on a map by customizing their color based on the underlying values. Legends provide valuable information for interpreting the map with various colors, shapes, or other identifiers based on data and application needs. The JavaScript Maps supports two types of legend namely default and interactive. Different projection modesChange the projection of the default rendering map based on the need. The JavaScript Maps control supports various types of projections namely, Mercator, Rectangular, Miller, Eckert3, Eckert5, Eckert6, and Winkel3. Responsive and touch-friendlyThe JavaScript Maps is highly responsive and has a finely optimized design for desktops, touch screens, and smartphones. It works well on all mobile phones that use iOS, Android, or Windows 8 OS. Customizable appearanceCustomize the look and feel of an JavaScript map by changing the fill color, background, border, and opacity of shapes. Almost all the elements in the Maps are customizable. This control also provides built-in palettes with customizable options, by default. Export and printPrint the rendered maps or export it as PDF, SVG and PNG formats, to save a local copy for further use. Web framework integrationMaps control is also available in Blazor, React, Angular, and Vue frameworks. Check out the different Maps platforms from the links below: Related LinksLearn more about JavaScript Maps About Syncfusion Javascript UI ControlsSyncfusion's Javascript UI controls library is the only suite that you will ever need to build an application since it contains over 155 high-performance, lightweight, modular, and responsive UI controls in a single package. In addition to Maps, we provide popular Javascript Controls such as DataGrid, Charts, Scheduler, Diagram. About SyncfusionFounded in 2001 and headquartered in Research Triangle Park, N.C., Syncfusion has more than 38,000 customers and more than 1 million users, including large financial institutions, Fortune 500 companies, and global IT consultancies. Today we provide 1600+ controls and frameworks for web (Blazor, ASP.NET Core, ASP.NET MVC, ASP.NET WebForms, JavaScript, Angular, React, Vue, and Flutter), mobile (Xamarin, Flutter, UWP and JavaScript), and desktop development (WinForms, WPF, WinUI, UWP, Flutter, and .NET MAUI). We provide ready-to deploy enterprise software for dashboards, reports, data integration, and big data processing. Many customers have saved millions in licensing fees by deploying our software.
sales@syncfusion.com | www.syncfusion.com | 1-888-9 DOTNET |