JavaScript Gantt Chart - Syncfusion JavaScript UI ControlsThe JavaScript Gantt Chart Component is a project management tool which provides a Microsoft Project-like interface for scheduling and managing projects. Its intuitive user interface lets you to visually manage tasks, task relationships and resources in a project.
|
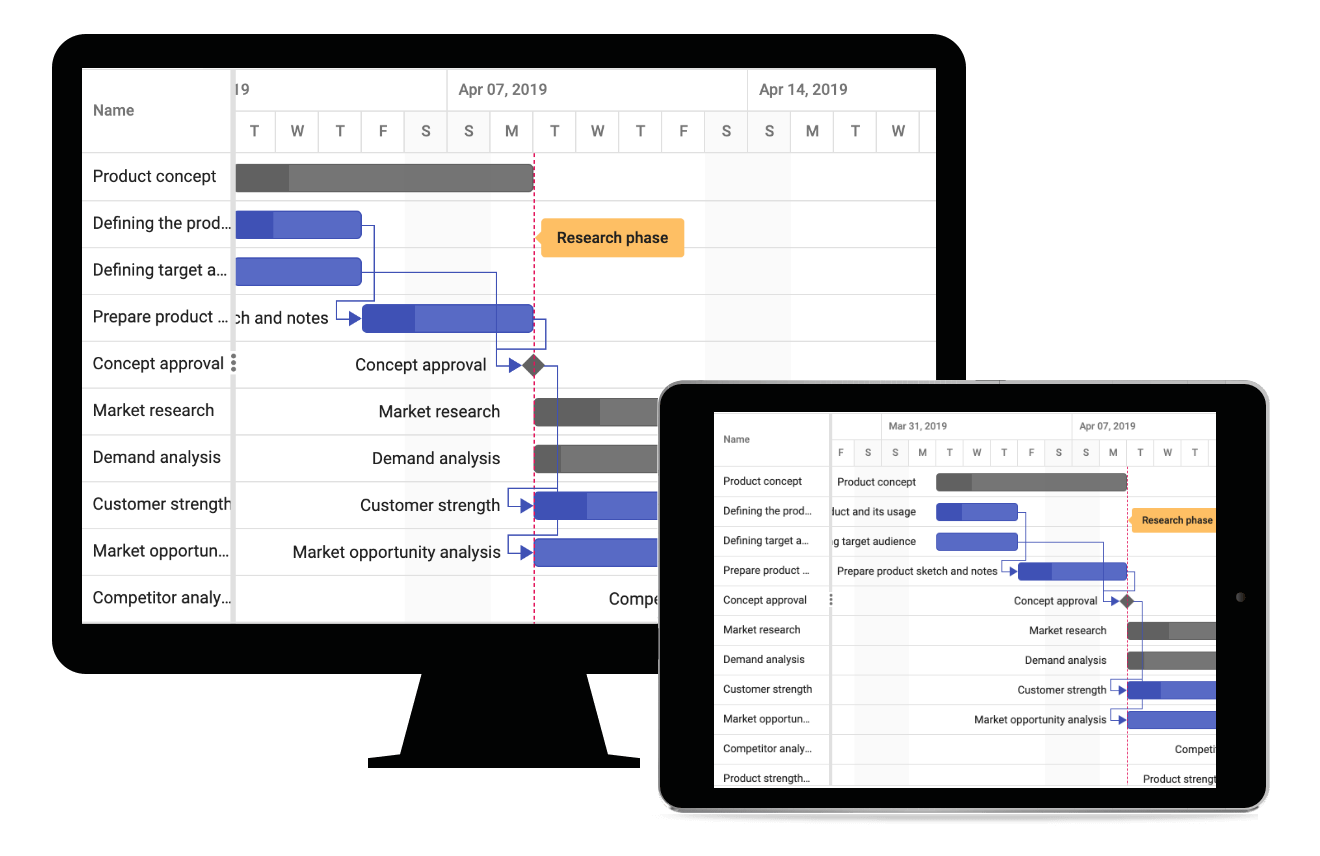
The HTML 5 JavaScript Gantt Chart control, is a project management tool which provides a Microsoft Project-like interface for scheduling and managing projects. Its intuitive user interface lets you to visually manage tasks, task relationships and resources in a project.
Features and BenefitsData bindingGantt chart can be bound to both hierarchical and self-referential data sources in the form of JavaScript object array collections. PerformanceA high volume of data can be loaded along with tasks dependencies without performance degradation by using virtual rendering. The JavaScript Gantt chart allows the user to perform scrolling and other actions without any lag even when dealing with large numbers of records. Task dependenciesRelationships can be specified between the tasks to determine the order in which the tasks need to be performed. The relationship links can be finish-to-start, start-to-finish, start-to-start, and finish-to-finish types. EditingGantt chart supports create, read, update and delete operations (CRUD) on tasks in the project. A task’s fields, such as duration, start date, end date, predecessors, etc., can be edited directly in their respective cells, or using edit dialog, or interactively using taskbars. Timeline modesThe tasks in the project can be visualized with different timeline modes such as hour, day, week, month, and year views. Work weekGantt chart provides support for defining the working days or productive days in a week for a project. It is possible to define both continuous and intermittent days as working days. Highlight days and eventsImportant days or events in a project can be highlighted using event markers in Gantt chart. Gantt also supports highlighting holidays and weekend days in a project. BaselinesBaselines are used to compare the current progress of a task with the original planned or initial scheduled dates. Allocating resourcesEach task in the Gantt chart can be assigned with resources which represents the staff, equipment, materials, etc. Column resize, column reorder and column chooserAlong with the inbuilt columns for viewing the task’s fields, custom columns can also be added in Gantt chart. It also supports column formatting, column resize, column reorder, column chooser and column menu features. ToolbarThe JavaScript Gantt Chart Toolbar contains options for editing, searching, expanding, collapsing, and deleting the selected tasks. It also contains options for adding new tasks. Custom toolbar items can also be added along with the inbuilt toolbar items. Filtering and SearchingJavaScript Gantt Chart Filtering helps to view specific or related records based on filter criteria. Filtering can be performed by using filter menu dialog of specific column and multiple column can be filtered at the same time. Web framework integrationGantt Chart component is also available in Blazor, Angular, React and Vue frameworks. Check out the different Charts platforms from the links below, Related linksLearn More about JavaScript Gantt Chart About Syncfusion ASP.NET MVC UI ControlsSyncfusion's JavaScript UI controls library is the only suite that you will ever need to build an application since it contains over 155 high-performance, lightweight, modular, and responsive UI controls in a single package. In addition to Gantt Chart, we provide popular JavaScript Controls such as JavaScript DataGrid, JavaScript Charts, JavaScript Scheduler, JavaScript Diagram. About SyncfusionFounded in 2001 and headquartered in Research Triangle Park, N.C., Syncfusion has 38,000+ customers and more than 1 million users, including large financial institutions, Fortune 500 companies, and global IT consultancies. Today, we provide 1600+ controls and frameworks for web (ASP.NET Core, ASP.NET MVC, ASP.NET WebForms, JavaScript, Angular, React, Blazor, Vue, and Flutter), mobile (Xamarin, UWP, JavaScript, and Flutter), and desktop development (Windows Forms, WPF, UWP, Flutter, WinUI, and .NET MAUI). We provide ready-to-deploy enterprise software for dashboards, reports, data integration, and big data processing. Many customers have saved millions in licensing fees by deploying our software. sales@syncfusion.com | Toll Free: 1-888-9 DOTNET |