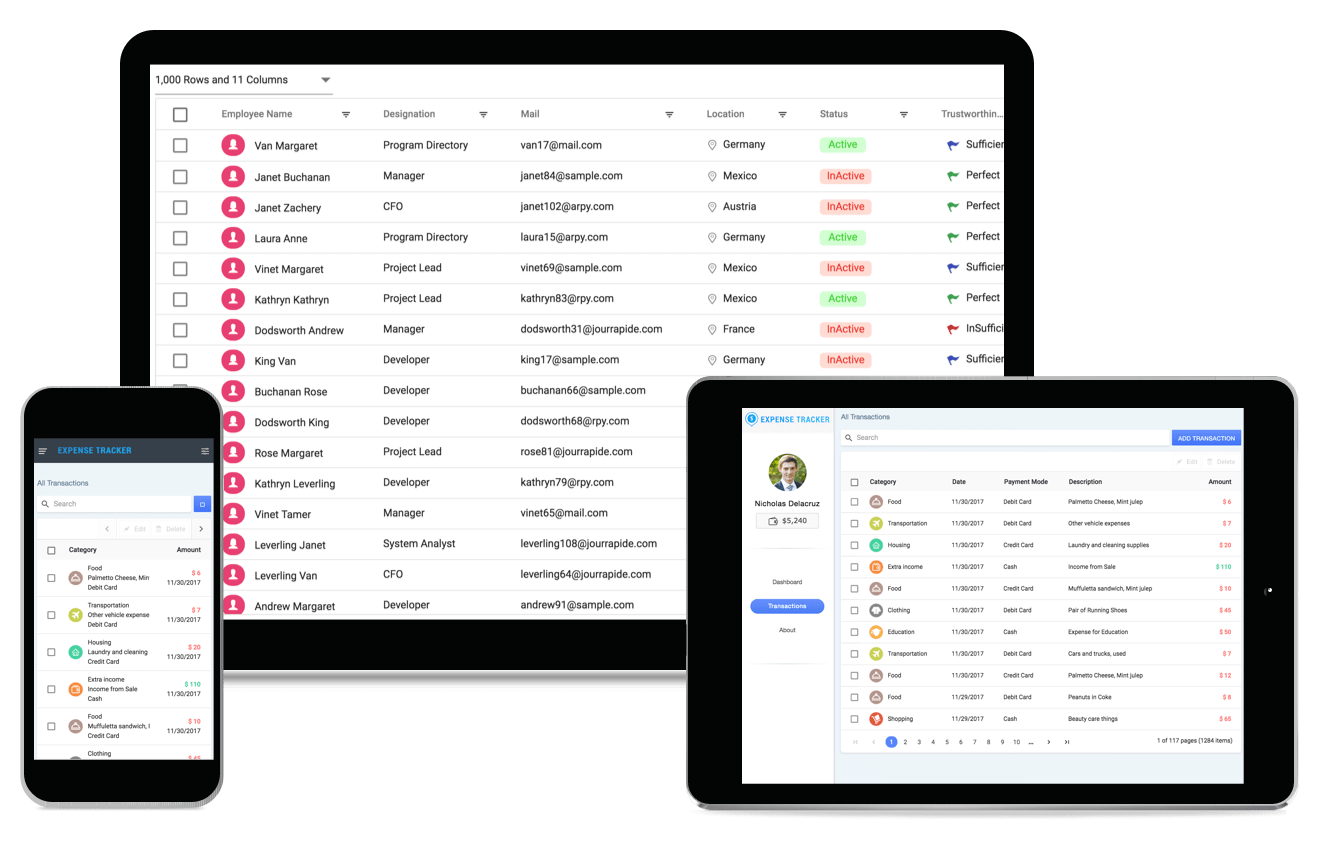
The JavaScript DataGrid or DataTable, is a feature-rich control for displaying data in a tabular format. Its wide range of functionalities includes data binding, editing, filtering, grouping, paging, freezing rows and columns, aggregating rows, and exporting to Excel, CSV, and PDF formats.
Features and BenefitsPerformanceData Grid is designed and optimized for high performance. A high volume of data can be loaded without performance degradation by using row and column virtualization. Data bindingDataGrid can be bound to data from a variety of data sources in the form of JavaScript object array collections. It uses the Data Manager to handle data and supports customizing data requests and processing. EditingDataGrid provides full support for create, read, update, and delete operations (CRUD). It performs editing operations with JavaScript array collection or remote data service with help of data manager. JavaScript Editable Grid provides different edit modes such as inline, dialog, and batch edit (cell editing) for CRUD operations. It has built-in validation support to validate data. Also editing provides custom editor to use editor component. AggregationJavaScript DataGrid Aggregates for column values can be easily displayed using the aggregate feature. Aggregates can be customized to show their value in individual summary rows, individual group summary rows, or in group caption rows. It have built-in aggregates types, user-defined aggregates for custom formula aggregating and reactive aggregate to view live aggregation changes for modified data column. PagingUsing Paging in JavaScript DataGrid, a segment of data can be viewed from the assigned data source. Data Grid offers built-in pager UI with options to customize its entire UI. It also has an on-demand paging mode for effective data retrieval from remote web services. SortingData Grid rows can be sorted against a column simply by clicking the desired column header. Data can be sorted either in the ascending or descending order. Sorting in JavaScript DataGrid have option to do initial sorting and Also we can able to write our own sort function for columns. FilteringFiltering in JavaScript DataGrid allows users to view the required data in the Data Grid. The Data Grid supports various filter types such as filter bar, menu, check box, and Excel-like filter. The appropriate filter type can be chosen based on the application. These filter types support number filter, string filter, date filter, and Boolean filter. Options to customize filter operators, case sensitivity, and diacritics are also available. GroupingJavaScript DataGrid supports row grouping to display data in an organized way. Data can be grouped in the ascending or descending order. Rows can be grouped by dragging and dropping the desired columns in the interactive drop area. SelectionDataGrid supports to select rows or cells. One or more rows or cells can also be selected by holding Ctrl or Command, or programmatically. Also Selection in JavaScript Grid supports to select range of rows or cells and selection by checkbox. TemplatesTemplates can be used to create custom user experiences in the datagrid. The datagrid provides various template options to create custom headers, custom cell contents, custom rows, detail rows, and toolbars. Stacked headersStacked headers allow grouping and visualizing column headers in a stacked manner. There is no limit to the number of columns that can be grouped. The data columns can still be grouped, sorted, and filtered. Column resize, column reorder, column chooser and foreign key columnColumn defines schema of data source in datagrid. Columns in JavaScript DataGrid acts as base for all features. It supports formatting, auto generate columns, column definitions, and column resize, column reorder, column chooser, column menu, foreign key column and other important features. Exporting Excel, Pdf and CSVExport DataGrid data to Excel, PDF, and CSV formats. The exported document can also be customized programmatically. This allows data from the datagrid to be used in other applications. Web framework integrationGrid component is also available in Blazor, React, Angular, and Vue frameworks. Check out the different Charts platforms from the links below, Related linksLearn More about JavaScript DataGrid About Syncfusion JavaScript UI ControlsSyncfusion's JavaScript controls library is the only suite that you will ever need to build an application since it contains over 80 high-performance, lightweight, modular, and responsive UI controls in a single package. In addition to DataGrid, we provide popular JavaScript Controls such as JavaScript Charts, JavaScript Scheduler, JavaScript Diagram, and JavaScript Word Processor. About SyncfusionFounded in 2001 and headquartered in Research Triangle Park, N.C., Syncfusion has more than 38,000 companies and more than 1 million users, including large financial institutions, Fortune 500 companies, and global IT consultancies. Today, we provide 1900+ controls and frameworks for web (ASP.NET Core, ASP.NET MVC, ASP.NET WebForms, JavaScript, Angular, React, Blazor, Vue, and Flutter), mobile (Xamarin, UWP, JavaScript, Flutter, and .NET MAUI), and desktop development (Windows Forms, WPF, UWP, Flutter, WinUI, and .NET MAUI). We provide ready-to-deploy enterprise software for dashboards, reports, data integration, and big data processing. Many customers have saved millions in licensing fees by deploying our software. sales@syncfusion.com | Toll Free: 1-888-9 DOTNET |


