Bold Reports Embedded Reporting
Create and visualize all your data. Embedded Reporting is a complete business intelligence solution with reporting components and a report management system. It lets you embed reporting into any app and gives you in-depth business analysis of your metrics so you can build bolder action plans to meet your business goals.
How the Embedded Reporting helps?
Fast, easy integration
Easily integrate reporting tools into your application.
Connect to multiple sources
Seamlessly connect to the most commonly used Web API, SQL, MySQL and NoSQL data sources.
Pixel-perfect reports
Create and visualize pixel-perfect, paginated business reports using a report designer without writing a single line of code.
Canned reports
Use templates to indicate trends and patterns in your business data and dig deep into your metrics with charts, gauges, tables, KPIs, and maps.
Multiple export formats
Export reports in the most common formats: PDF, Excel, CSV, Word, PowerPoint, XML, and HTML.
Data stays in your server
Create and manage ready-to-use enterprise reports behind your firewall.
REST APIs
Use simple REST APIs to embed reporting in your application.
Effortless SSRS migration
Easily migrate from Microsoft SSRS to Bold Reports.
Reduced need for IT knowledge
Best-in-class drag-and-drop interface allows any user to work easily.
What makes it unique?
Embedded Reporting follows the Microsoft SSRS RDL standards, giving you these benefits:
- Pixel-perfect paginated reports to size and lay out elements with precision.
- SSRS RDL, RDLC reports created with third-party apps can be loaded in Bold Reports or vice versa without additional effort.
- Free onboarding so you can learn how to use the product.
- Extensible and open schema that supports custom extension elements.
- XML schema for report definitions.
Top features
- Integrate reports that elegantly fit in your existing desktop and web apps with easy-to-use developer tools.
- Build any industry solution report in minutes without a single line of code.
- Connect and prepare data queries stress-free through a drag-and-drop query designer.
- Analyze your data in depth in interactive reports with eye-catching visualization.
- View reports from any source: Microsoft SSRS, SharePoint, local systems, external servers, or embedded report files in any application.
- Extend the natively supported data sources and report item functionality or create your own custom data sources or report items.
- Create and view data-intensive reports quickly with best-in-class performance.
- Programmatically save business reports to PDF, Excel, Word, and more.
- Host and distribute reports behind your organization’s firewall or with your own Azure cloud provider with an on-premises report management system.
- Localize and rebrand product for a specific organization or stakeholder.
- Manage costs with a predictable and simple pricing model. Optionally, download Syncfusion Essential Studio components and integrate them into your application.
Effective report management
Implementing a report management platform that can deliver timely, rich, accurate metrics to the correct stakeholders to increase sales revenue is hard work. Thankfully, with Bold Reports Embedded Reporting, you can deploy such a business intelligence reporting solution behind your organization’s firewall or with your own Azure cloud provider. With it, you can:
- Use built-in multitenant architecture that serves multiple customers and quickly isolates resources with a single installation of the report management system
- On-board data from any provider in local or external servers.
- Import and manage user roles to maintain the organization hierarchy with flexible access permissions.
- Synchronize users from Office 365 and Azure Active Directory with third-party logins.
- View on mobile devices using the most common web browsers with responsive design.
- Clone and share reports among multiple tenants.
- Maintain a history of revisions with versioning. It enables users to create, modify, and easily revert to a stable version of each item.
- Govern report and change design with flexible collaboration.
- Empower users with an easy-to-use, web-based user interface to manage and collaborate on reports.
- Secure your system and provide one-click access to all SAML-enabled applications with single sign-on.
- Share reports with unlimited users.
- Schedule and share reports via email at regular intervals to stay on top of your data.
Pixel-perfect report authoring
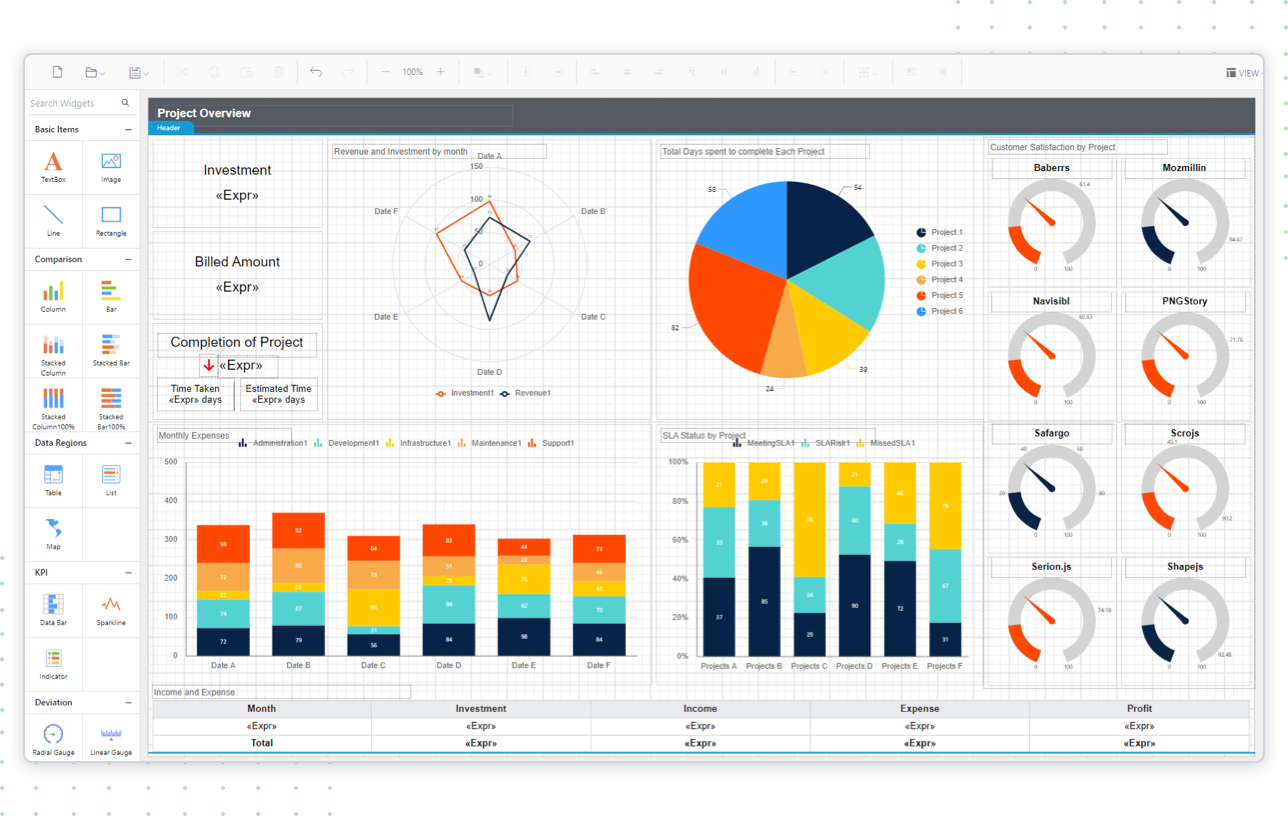
Embed the WYSIWYG Report Designer into any application to create paginated professional reports that suit your business needs. It provides options for:
- Personalizing reports 100% with a user-centric design.
- Using SSRS RDL standard format in reports.
- Connecting to any data source provider in local or server databases.
- Creating data queries with a few clicks using a drag-and-drop query builder.
- Viewing all your data with eye-catching data visualization features:
- Data region items—Tables, matrices (pivot table), and lists.
- Charts—20+ chart types.
- Subreports.
- Radial and linear gauges.
- KPIs—Databar, sparkline, indicator.
- Maps.
- Basic items—Text boxes, images, lines, and rectangles.
- 1D and QR barcodes.
- Analyzing and generating reports for any business process or industry need.
- Quickly building interactive reports using parameters, drill down, drillthrough, hyperlinks, subreports, and nested data regions.
- Taking control of your data appearance with easy-to-use styling and formatting options.
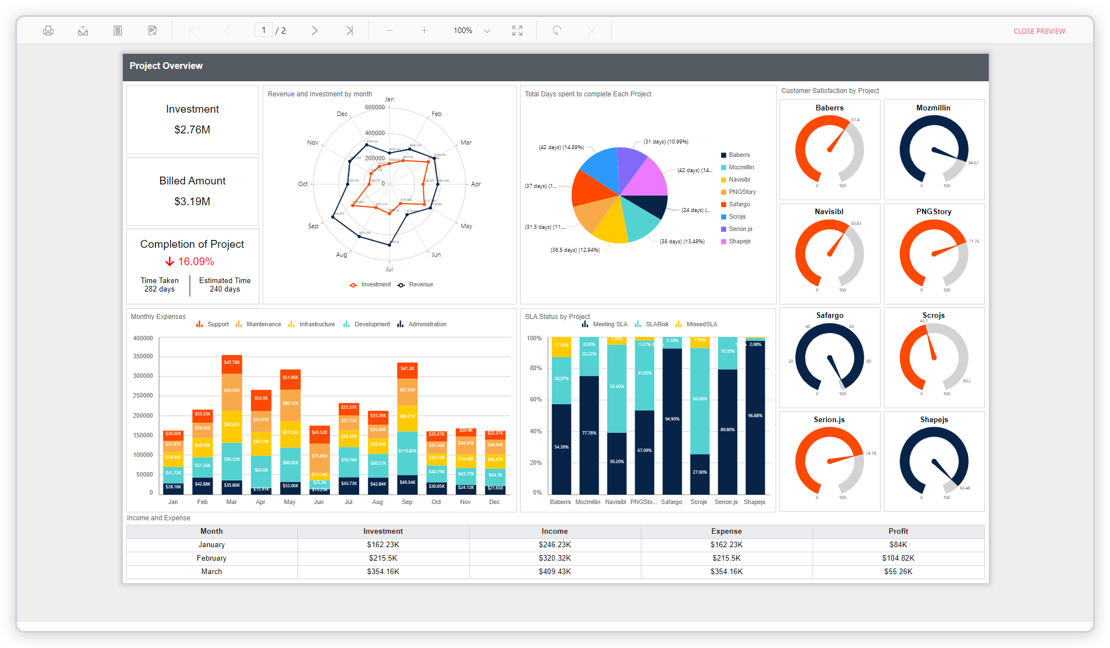
- Viewing and exporting reports and verifying whether the created report displays as required.
- Publishing reports directly to the Embedded Report Server categories.
Deliver visualized data everywhere
Seamlessly integrate Report Viewer into your desktop and web applications to view, print, and export already-created Microsoft SSRS RDL, RDLC reports. From the view results, instantly analyze data in real time to make insightful business decisions and build action plans to meet your goals. The Report Viewer provides the ability to:
- Process and view data-intensive reports with a powerful engine.
- Embed interactive reports to gain deeper insights into your data.
- Filter data and change a report’s appearance on the fly with report parameters.
- Highlight data on demand with unmatched data clarity.
- Precisely format reports for printing to paper.
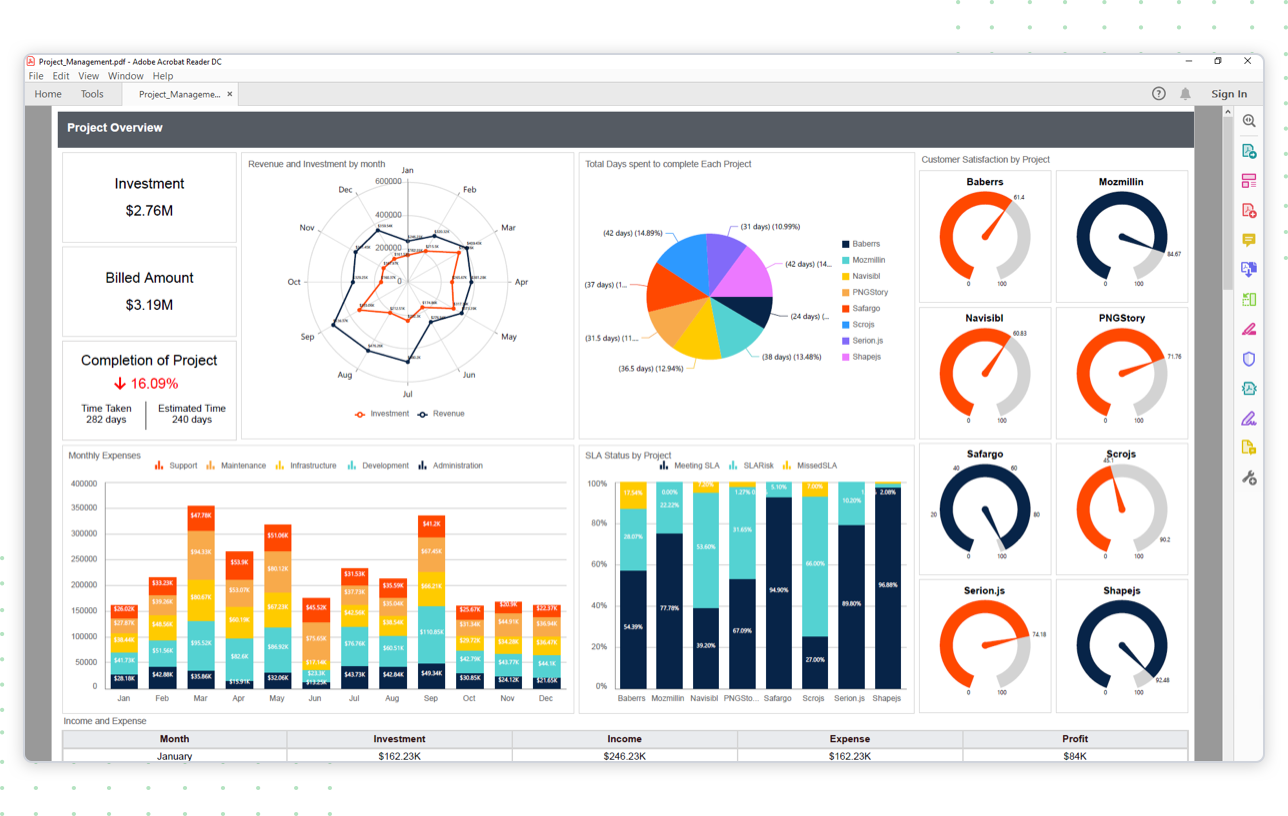
- Export reports to popular file formats.
Save professional reports in the most commonly used file formats and forward them via email to analysts and users so they can build action plans to meet their business goals. Bold Reports lets you:
- Programmatically create and export SSRS RDL, RDLC professional reports to PDF, Excel, Word, and more.
- Securely export documents from an application, spanning a range of low to high encryption standards.
- Encrypt and compress documents for securing data.
- Silently print reports.
Product showcase sample screenshot

What is included
Schedule Free Demo
Download Free Trial
Pricing
Online Examples
Documentation
About BoldReports powered by Syncfusion
After nearly two decades of seeing how companies used its industry-leading components, Syncfusion discovered a need to simplify how enterprises create, store, and share vital business reports. With this in mind, Syncfusion concentrated its efforts on Bold Reports, a web-based report management solution that handles the minutiae, so you can see the big picture.
Make and edit reports with the Report Designer, which leverages Syncfusion’s UI expertise to provide dozens of report items, interactive features, appealing styles, and customizable formatting options. Then, use the Report Server to publish and export your reports, manage their access permissions, and deliver them to users on the web. When reports are available anywhere, pertinent stakeholders can collaborate to make better business decisions.
Our embedded reporting solution lets you integrate the capabilities of our reporting tools, such as the Report Viewer and Report Designer, into other software applications. Our reporting tools can integrate into leading web frameworks: ASP.NET Core, ASP.NET MVC, ASP.NET Web Forms, JavaScript, Angular, React, Blazor. You can also integrate our reporting tools into WPF and UWP developments.
Business reporting doesn’t have to burden your IT team or your budget. Contact us today to learn how Bold Reports can transform the way you present your data.
sales@syncfusion.com | www.boldreports.com | Toll Free : +1 888.936.8638


