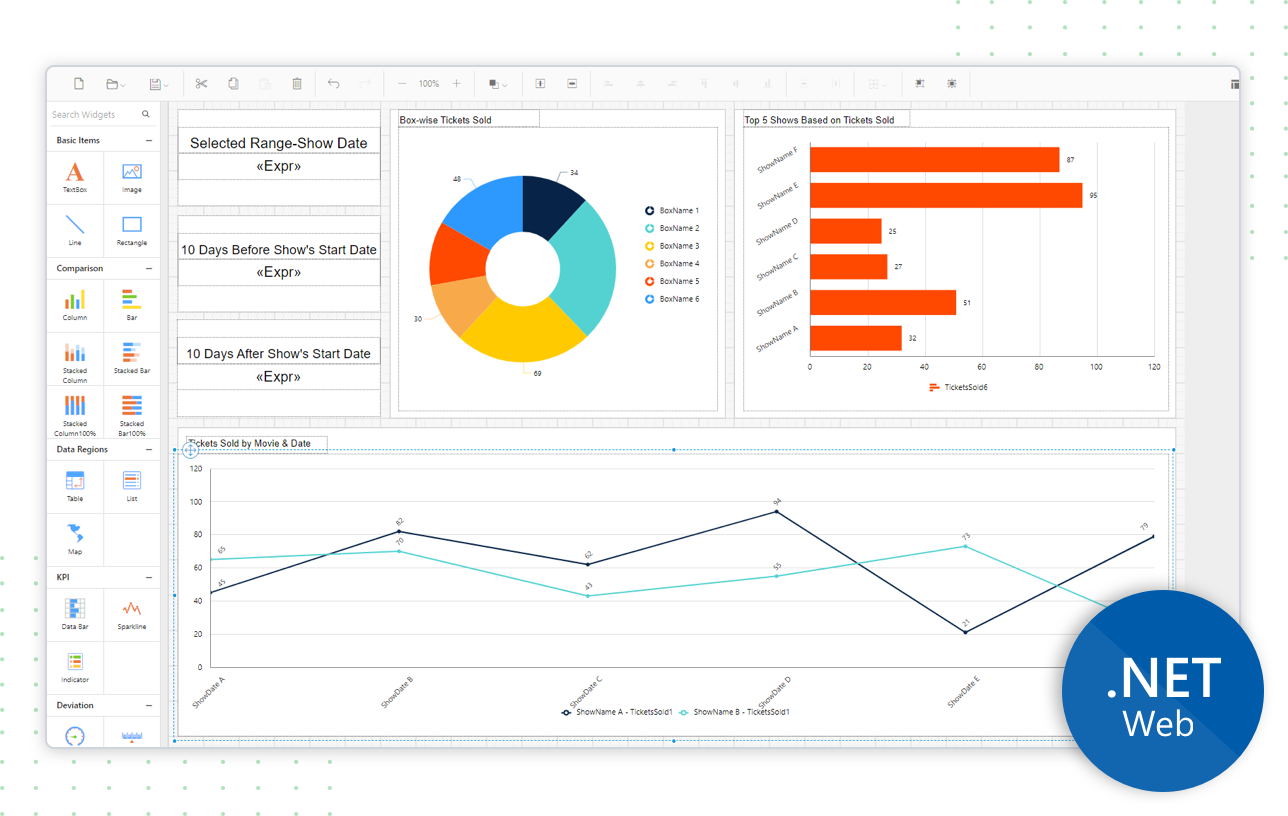
Web-based ASP.NET Web Forms Report Designer that transforms your data into insightful SSRS RDL/RDLC reports without a single line of code. It lets you create, edit and view reports with SSRS RDL reporting features, such as parameters, expressions, sort, group, filter, link, hyperlink, and export to PDF, Excel, CSV, HTML and Word formats.
How the Report Designer helps? Easy integration Features and BenefitsConnect to any data sourceConsume data from a wide variety of data providers in local or server databases. Create an embedded or shared data source by connecting to the most common data sources using the following data providers.
Create data models with an easy-to-use query builderData query preparation consumes most of your time, but with ASP.NET Report Designer, data query generation can be done with a few clicks. The easy-to-use drag-and-drop Query builder helps both technical and nontechnical users to create and view relationships between tables. Eye-popping data visualizationCreate and visualize powerful insights from your data using a variety of report items :
Styling and formatting reportsProvides a rich user-friendly interface to easily transform your data into beautiful reports. The WYSIWYG user interface allows the report to be edited in the same UI it is printed or displayed. Furthermore, you can easily edit a report with mouse, touchscreen, or keyboard interfaces. Report parametersParameters are the most widely used functionalities to interact with an RDL/RDLC report at runtime. The following parameter types allow you to modify the data presentation to provide an enhanced user experience:
Data shapingCreate and view organized and shaped data to make bolder business decisions using the following techniques:
AlignmentThe ASP.NET Report Designer toolbar has enhanced alignment options that allow perfect positioning, sizing, and aligning of report items in a report. Interactive reportsAllows the user to visualize the data across multiple adjacent columns such as mail merge, business cards, newspaper, and more. For more details refer Interactive reports section. Expression builderReport Designer provides an expression builder that allows you to create simple and complex RDL expressions. Expressions are used throughout report definition to vary the content or appearance of a report. The following are some uses of expressions:
View reportsThe WYSIWYG Report Designer provides an option to preview reports and verify whether the created report displays what you require. The reports are displayed using the ASP.NET WebForms Report Viewer. Print and exportEffortlessly print and export report contents by just clicking the print/export option in the toolbar. The most popular file formats are supported, including PDF, Word, Excel, CSV, PowerPoint, XML, and HTML. Save and share reportThe ASP.NET WebForms Report Designer allows you to save reports to Bold Report Server or SSRS Report Server, and to your computer in the Microsoft RDL standard. Publishing a report to the server allows other users who have permission to access the server to view it. Supported frameworksRelated linksAbout Bold Reports powered by SyncfusionAfter nearly two decades of seeing how companies used its industry-leading components, Syncfusion discovered a need to simplify how enterprises create, store, and share vital business reports. With this in mind, Syncfusion concentrated its efforts on Bold Reports, a web-based report management solution that handles the minutiae, so you can see the big picture. Make and edit reports with the Report Designer, which leverages Syncfusion’s UI expertise to provide dozens of report items, interactive features, appealing styles, and customizable formatting options. Then, use the Report Server to publish and export your reports, manage their access permissions, and deliver them to users on the web. When reports are available anywhere, pertinent stakeholders can collaborate to make better business decisions. Our embedded reporting solution lets you integrate the capabilities of our reporting tools, such as the Report Viewer and Report Designer, into other software applications. Our reporting tools can integrate into leading web frameworks: ASP.NET Core, ASP.NET MVC, ASP.NET Web Forms, JavaScript, Angular, React, Blazor. You can also integrate our reporting tools into WPF and UWP developments. Business reporting doesn’t have to burden your IT team or your budget. Contact us today to learn how Bold Reports can transform the way you present your data.
sales@syncfusion.com | www.boldreports.com | Toll Free : +1 888.936.8638 |


