ASP.NET Core Charts - Syncfusion ASP.NET Core UI ControlsASP.NET Core charts (graphs) library has support for 55+ chart types such as line chart, bar chart, pie chart, area chart, stock charts, etc. Its rich feature set includes zooming, panning, tooltip, crosshair, trackball and drill-down functionality. |

The ASP.NET Core Charts, a well-crafted easy-to-use charting package, is used to add beautiful charts in web and mobile applications. It contains a rich gallery of 55+ charts and graphs, ranging from line to financial charts, that cater to all charting scenarios. Its high performing quality helps to render a large amount of data quickly in your user's browser. It also comes with a lot of features such as zooming, panning, tooltip, crosshair, trackball, drill-down, and events to make the charts more interactive.
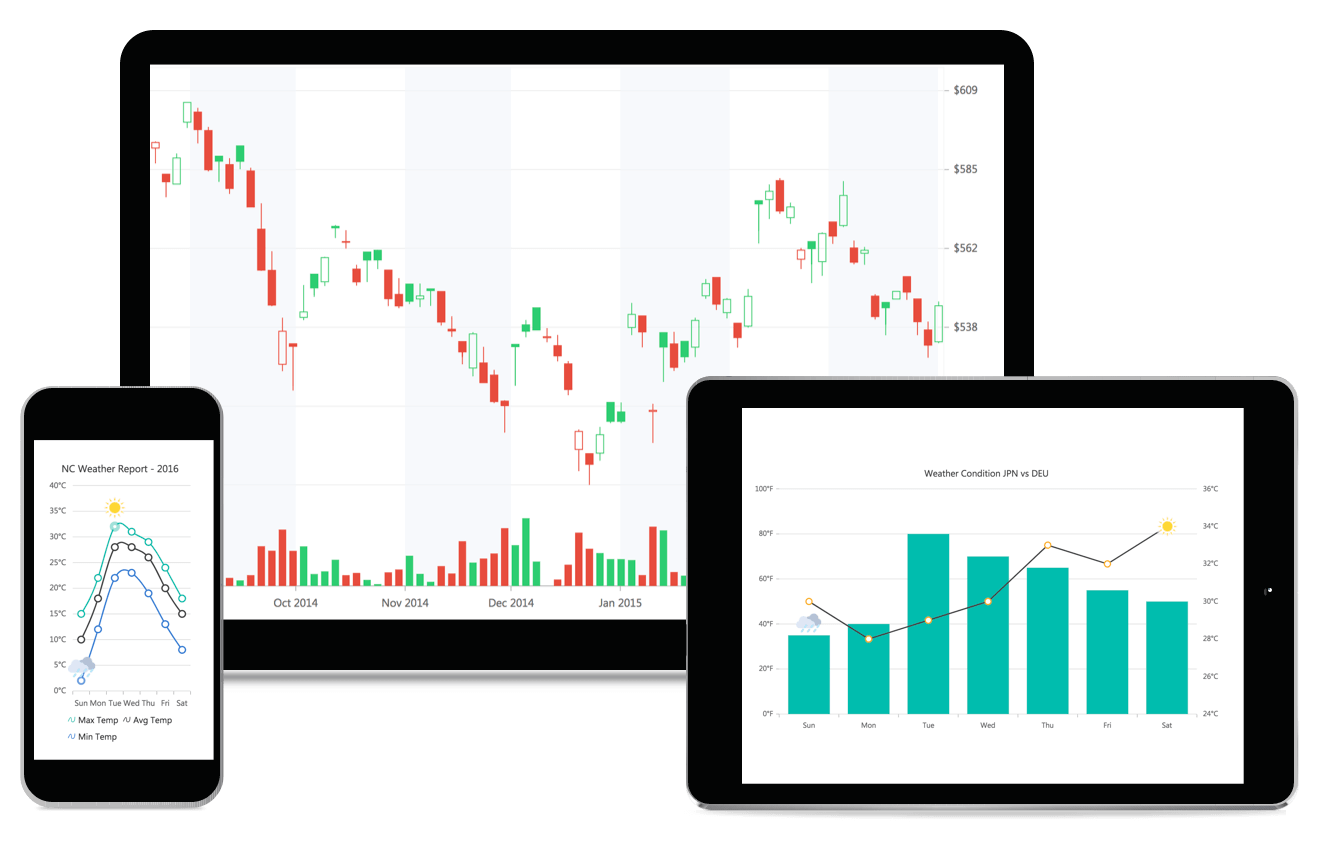
Features and BenefitsChart typesPlots more than 50 chart types, ranging from basic charts like such as line, and column etc. to financial charts like such as candle, and OHLC. Each chart type is easily configured with built-in support for creating stunning visual effects. Data bindingChart can be bound to data from a variety of data sources in the form of JavaScript object array collections. It uses the Data Manager to handle data and supports customizing data requests and processing. PerformanceChart is designed and optimized for high performance. It provides the best performance when plotting large volumes of data and handling high-frequency real-time data. Interactive chartThe end user experience is greatly enhanced by including a set of user interaction features such as zooming and panning, crosshair, trackball, drill-down, events, selection, and tooltip. AxisChart plots any type of data in a graph with the help of different axes types: numeric, category, date-time, date-time category, and logarithmic axis. This chart axis elements can be customized further to make an axis more readable. LegendsLegends allows users to display additional information about the chart series. Legend can be paginated and positioned anywhere in the chart area, to make the chart fit best on the page. Technical indicatorsChart supports different types of technical indicators to analyze the past and predict future market trends based on historic price, volume, or open interest. Real-time data synchronizationChart can be updated dynamically with live data that changes over seconds or minutes like stock prices, temperature, etc. AnimationChart can be animated smoothly on initial rendering, refreshing, and interacting with the chart and graph widgets. Customizable UIAllows you customize the appearance of any part of chart using built-in API's. And comes with several built-in themes such as material, bootstrap, fabric (Office 365), and high contrast. Responsive and touch-friendlyChart has a highly responsive layout and a finely optimized design for desktops, touch screens, and smart phones. It works well on all mobile phones that use iOS, Android, or Windows 8 OS. Export, PDF, SVG, imageChart can be exported to PDF or as image formats such as SVG, PNG, and JPEG in client-side. Web framework integrationCharts component is also available in Blazor, React, Angular, and Vue frameworks. Check out the different Charts platforms from the links below, Related LinksLearn More about ASP.NET Core Charts About Syncfusion ASP.NET Core UI ControlsSyncfusion's ASP.NET Core UI controls library is the only suite that you will ever need to build an application since it contains over 155 high-performance, lightweight, modular, and responsive UI controls in a single package. In addition to Charts, we provide popular ASP.NET Core Controls such as DataGrid, Scheduler, Diagram. About SyncfusionFounded in 2001 and headquartered in Research Triangle Park, N.C., Syncfusion has more than 38,000 companies and more than 1 million users, including large financial institutions, Fortune 500 companies, and global IT consultancies. Today, we provide 1600+ controls and frameworks for web (ASP.NET Core, ASP.NET MVC, ASP.NET WebForms, JavaScript, Angular, React, Blazor, Vue, and Flutter), mobile (Xamarin, UWP, JavaScript, and Flutter), and desktop development (Windows Forms, WPF, UWP, Flutter, WinUI, and .NET MAUI). We provide ready-to-deploy enterprise software for dashboards, reports, data integration, and big data processing. Many customers have saved millions in licensing fees by deploying our software. sales@syncfusion.com | Toll Free: 1-888-9 DOTNET |