Skip to content
| Marketplace
Sign in
Azure DevOps>Azure Boards>OutcomeMap
OutcomeMap

OutcomeMap

OutcomeMet

|
42 installs
| (0) | Free
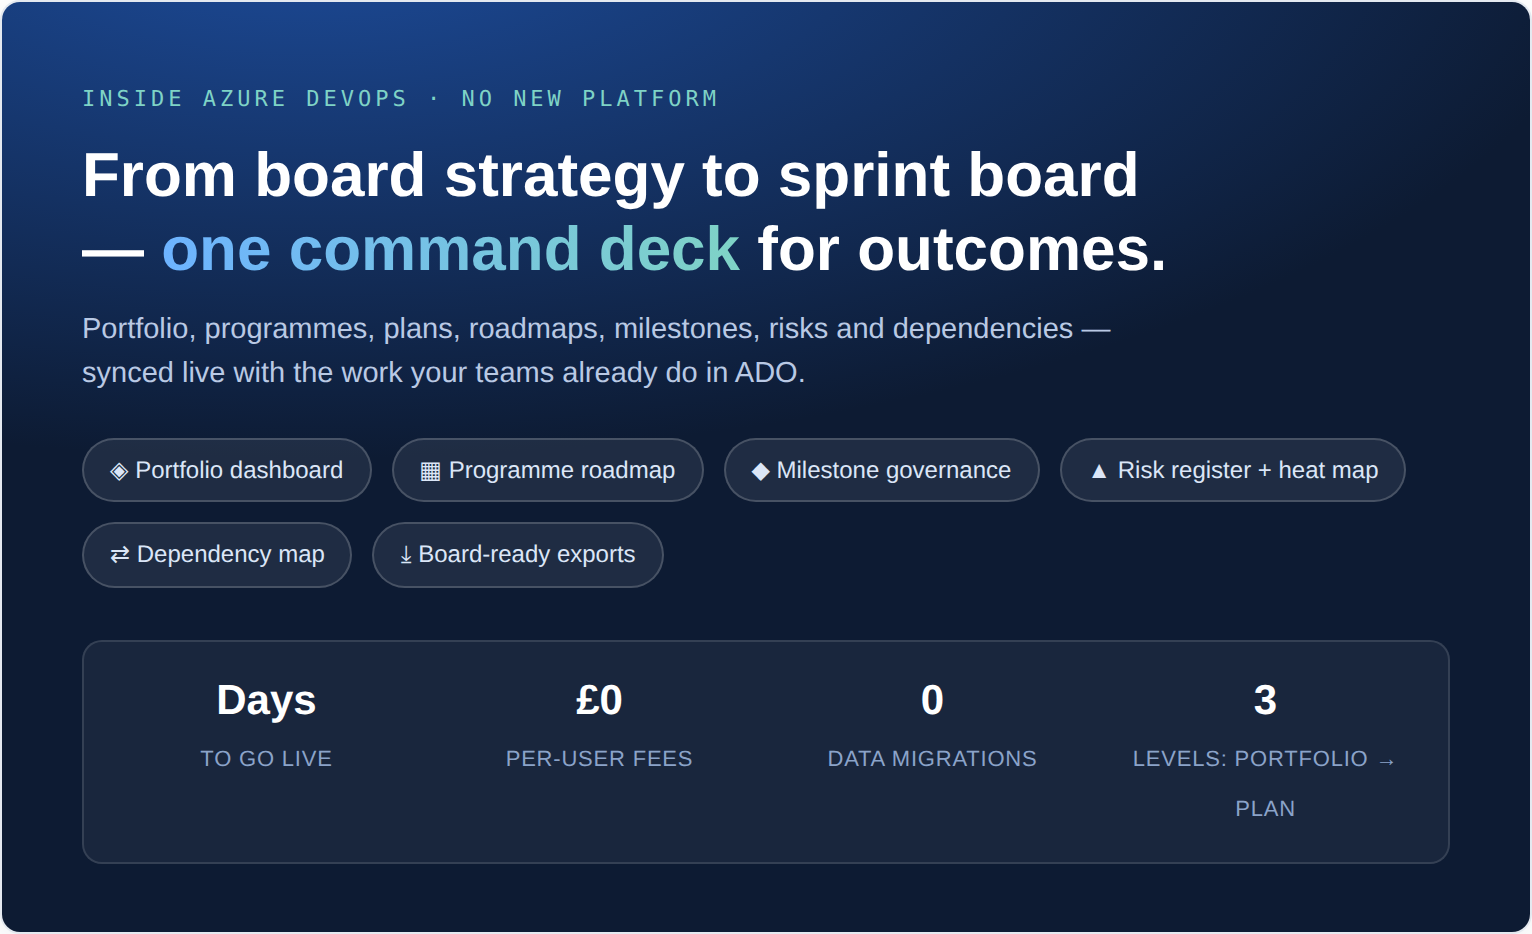
OKRs, Outcomes & portfolio — replaces Project Online. Free, no migration, live in days before POL retirement in Sep 2026. Inside Azure DevOps.
Get it free

OutcomeMap — Strategic Portfolio Execution for Azure DevOps

OutcomeMap connects your strategic goals to programme delivery — entirely inside Azure DevOps. Works with OKR frameworks (Objective → Key Result), Outcomes frameworks (Outcome → Key Measure), or your own terminology — switch modes in Settings, no data change required.

Replace scattered spreadsheets, PowerPoint roadmaps, and standalone portfolio tools with one workspace that syncs with the work your teams are already doing in ADO.


🔶 PROJECT ONLINE RETIRES 30 SEPTEMBER 2026 — ACT NOW

Microsoft is shutting down Project Online with no extension and no grace period. OutcomeMap is the only portfolio management replacement that runs natively inside Azure DevOps — no data migration · no new platform · no 6-month implementation project. Connect to your existing ADO environment and be live in days, not months.

Why OutcomeMap beats every alternative:

✅ No new platform to procure, approve, or learn
✅ No data migration — syncs with work items you already have
✅ No per-user licensing — flat rate per plan, unlimited users
✅ No implementation project — live in days
✅ Import existing POL milestones via XML export


OKR / Outcome Hierarchy & Gantt Roadmap

Build your strategic hierarchy from top-level goals down through delivery — and use the language your organisation already uses:

  • OKR mode: Objective → Key Result → Initiative → Epic → Feature
  • Outcomes mode: Outcome → Key Measure → Initiative → Epic → Feature
  • Custom: define your own labels in Settings

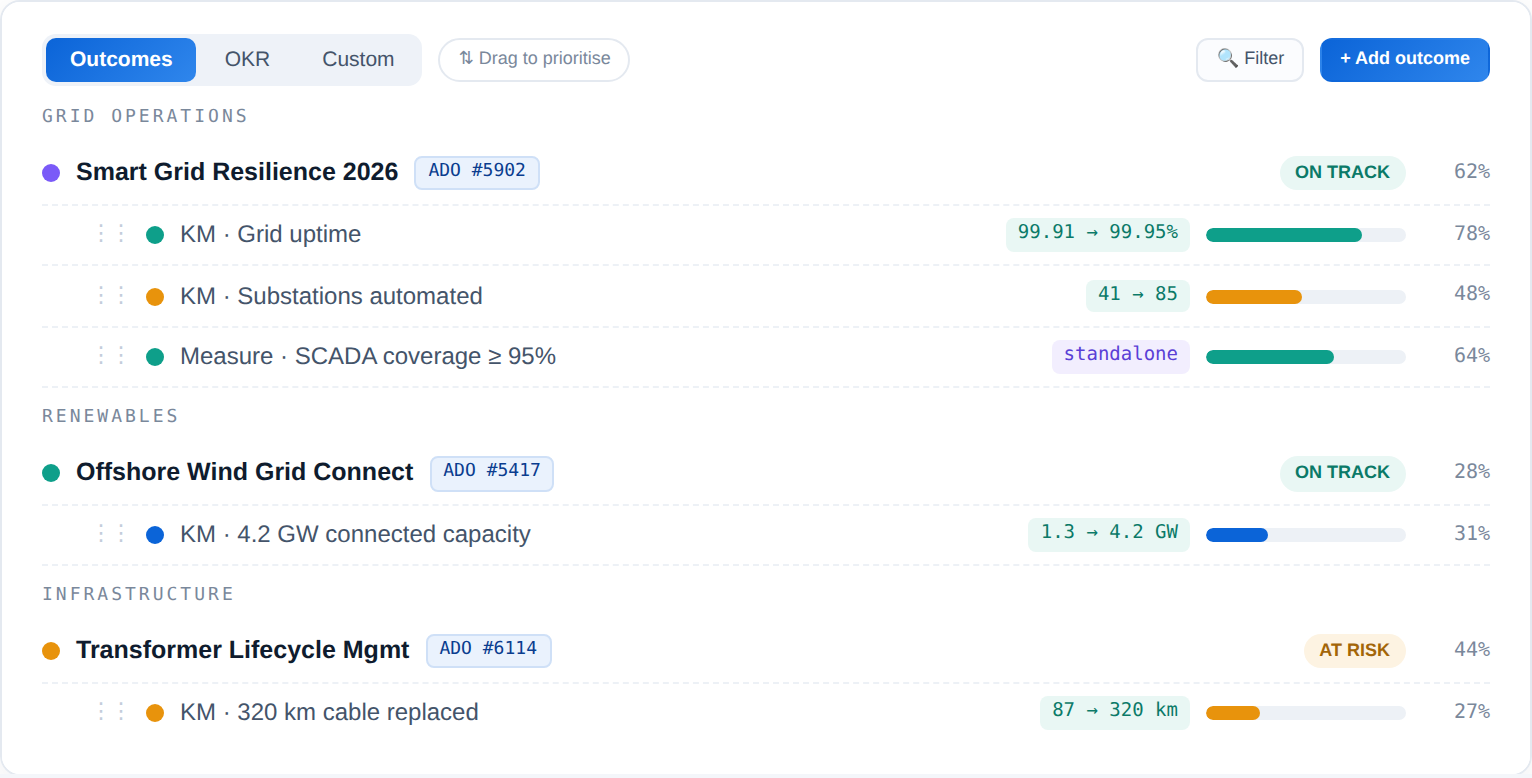
Visualise everything on an interactive Gantt roadmap with drag-and-drop scheduling and RAG-coloured bars.

OutcomeMap Roadmap — OKR hierarchy and Gantt timeline with RAG status


Milestones on the Roadmap

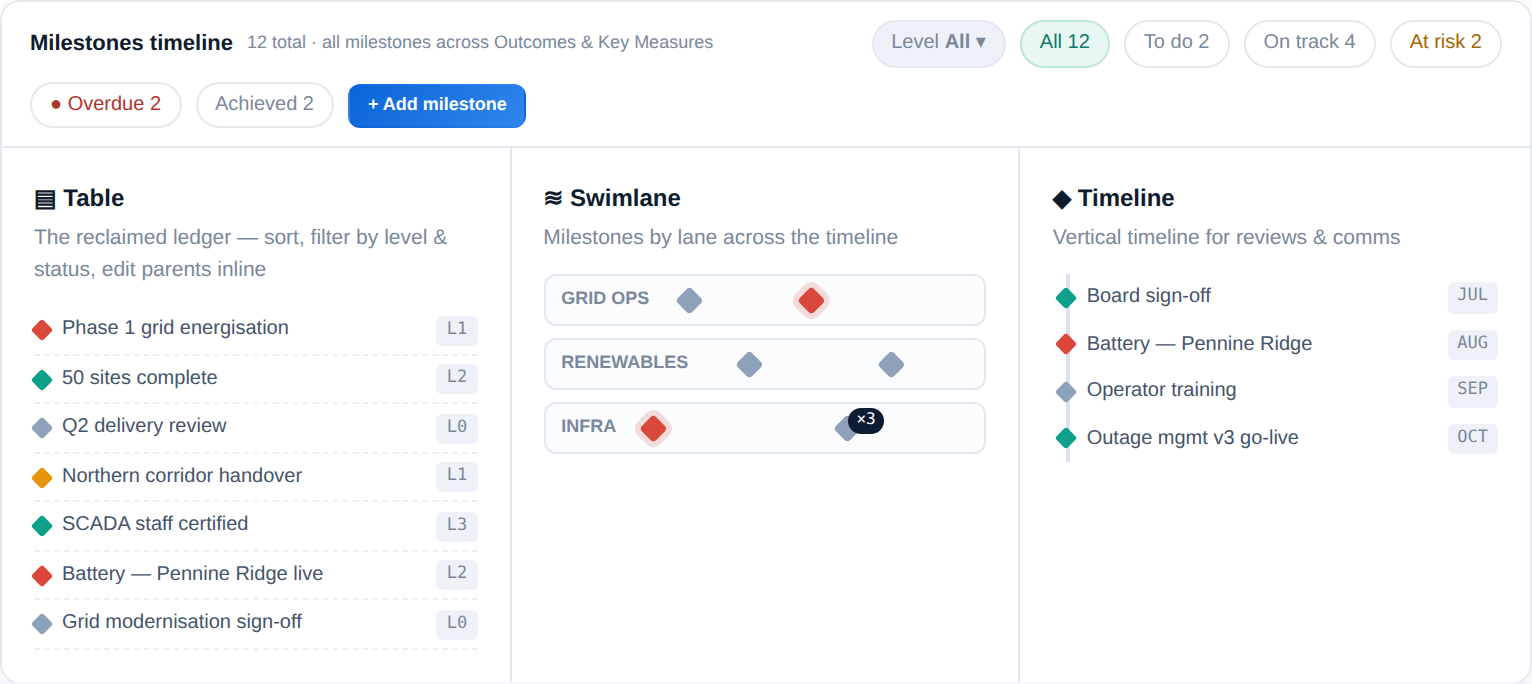
Milestones appear as diamond markers pinned directly to the Gantt. Define L0–L3 levels, target dates, evidence links, and threaded comments. ADO-backed or OutcomeMap-only — your choice. Never miss a delivery gate.

OutcomeMap Milestones — L0-L3 milestone table with dates, status and evidence


Portfolio Dashboard (Enterprise)

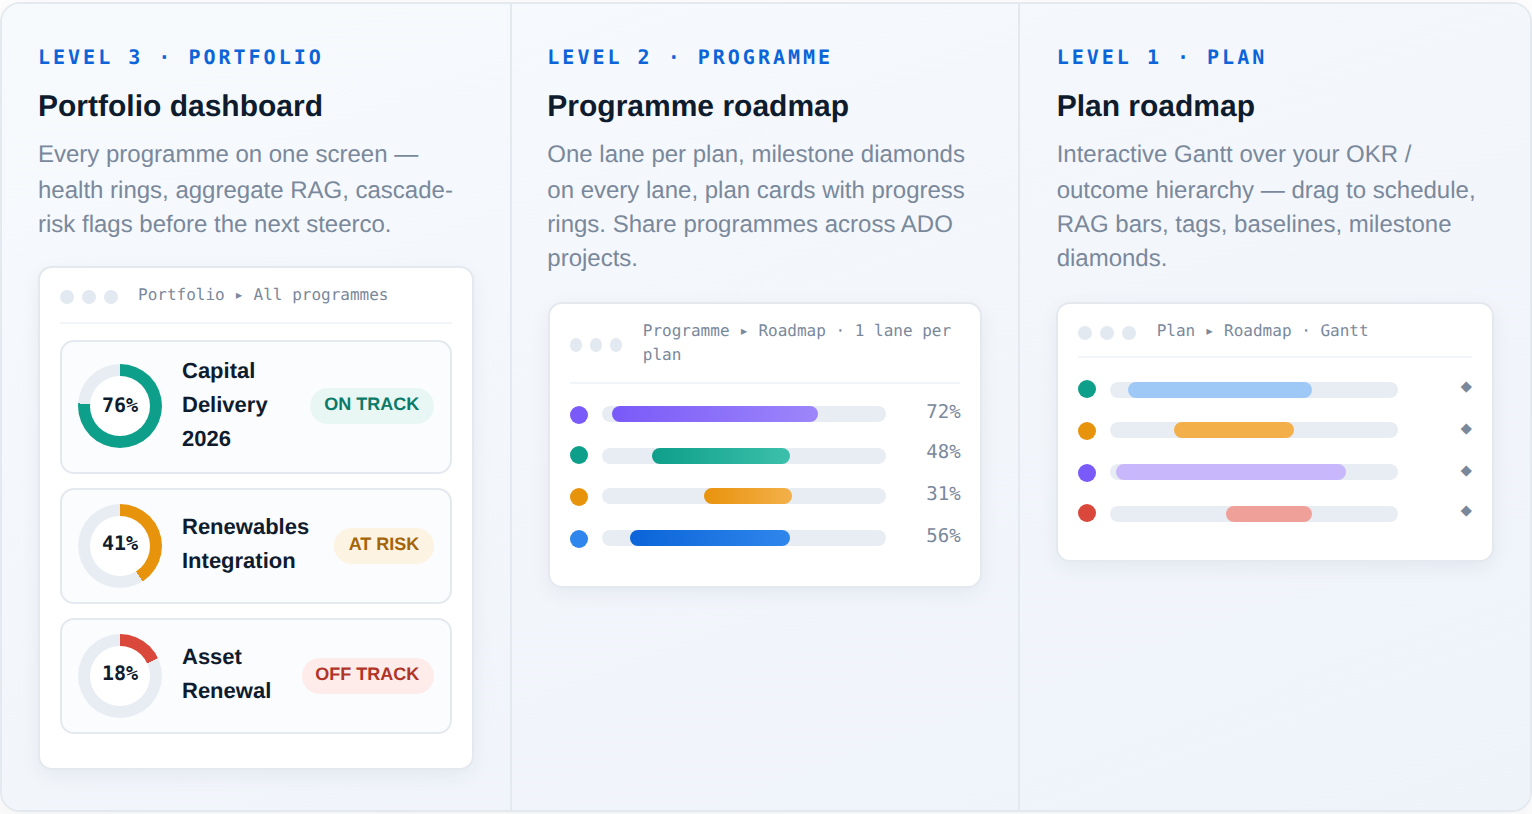
One screen across all your programmes. Programme health strip, aggregate RAG status, cascade risk detection when a blocked milestone slips in another plan, and executive summary — updated in real time from delivery data.

OutcomeMap Portfolio Dashboard — programme health strips and cascade risk detection


Risk Management (Enterprise)

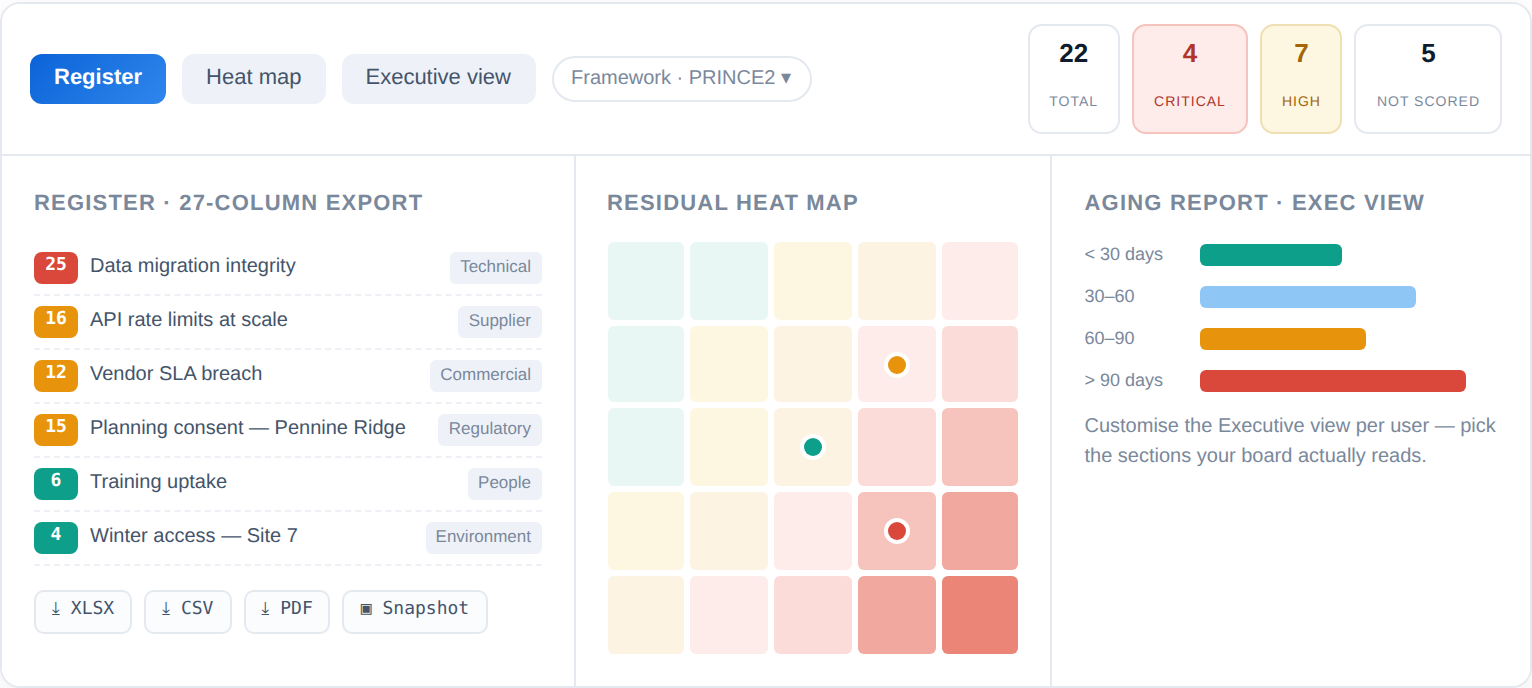
Identify, score, and track risks across your portfolio — without leaving Azure DevOps. Log every risk with likelihood × impact scoring, owner assignment, and status tracking. The interactive heat map shows your residual risk position at a glance, and the executive summary generates board-ready KPIs, mitigation charts, and risk narrative automatically.

  • Risk register — likelihood × impact scoring, owner, category, status, mitigation notes
  • Residual risk heat map — 5×5 matrix, colour-coded by severity, click any bubble to edit
  • Executive summary — KPI strip, mitigation effectiveness bars, top risks table, actions needed

OutcomeMap Risk Management — risk register, heat map and executive summary


Dependency Management (Professional)

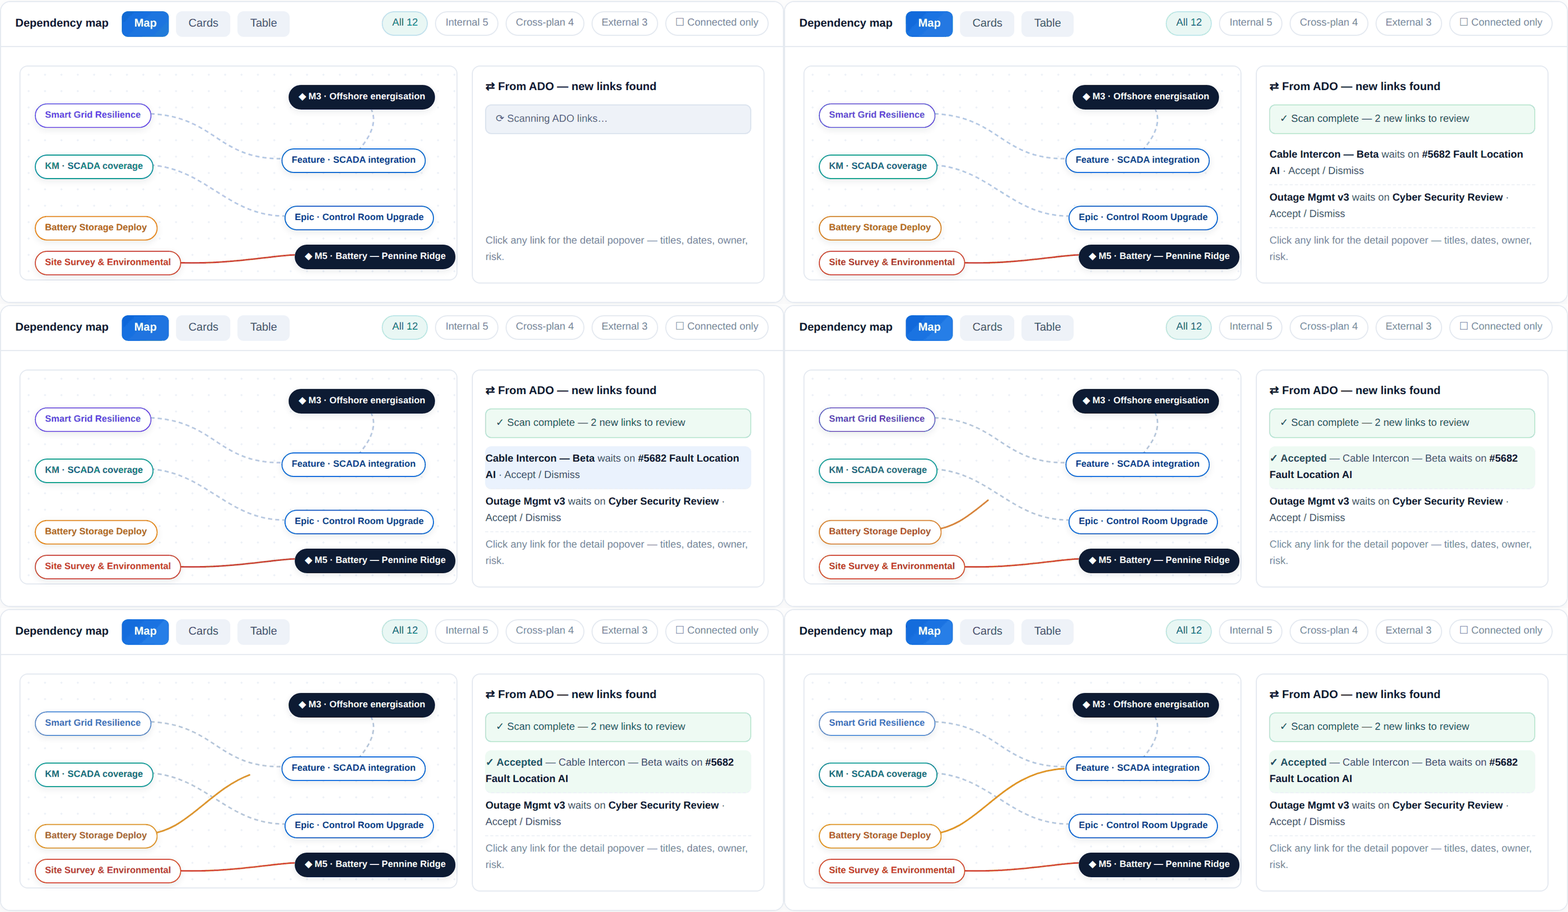
Drag the ● handle on any node to draw a dependency link. Click an edge to delete it. Within-plan and cross-plan dependencies rendered on the dependency map and as dashed connectors on the Gantt timeline.

OutcomeMap Dependency Map — drag-to-link and cross-plan cascade risk


Strategic Prioritisation

Drag outcomes, key measures, and initiatives into priority order directly in the tree panel. Order is preserved across sessions and reflected on the Gantt — so your most important outcomes always appear first. No more alphabetical lists — express strategic priority visually.


FinOps & value realisation

OutcomeMap is the outcome-attribution half of the FinOps lifecycle. Cloud cost tools tell you where the money went. OutcomeMap tells you which strategic outcome it went towards — and how much of that outcome has actually been delivered.

OutcomeMap aligns with the Workloads & Outcomes capability in the FinOps Foundation framework — the part of the lifecycle concerned with attributing investment to delivered business outcomes, rather than measuring or optimising the spend itself.

For finance and PMO teams running quarterly investment reviews:

  • Trace cloud and delivery investment to strategic outcomes — every Initiative, Epic, and Feature rolls up to a named Outcome or Key Result, giving you a defensible answer to "what did this programme buy us?"
  • Cross-plan portfolio view — aggregate progress across programmes so finance leads can spot stalled investment without chasing programme managers for status decks
  • Cascade risk detection — when a delivery slip in one plan threatens an outcome in another, the Portfolio dashboard flags it before the next steerco
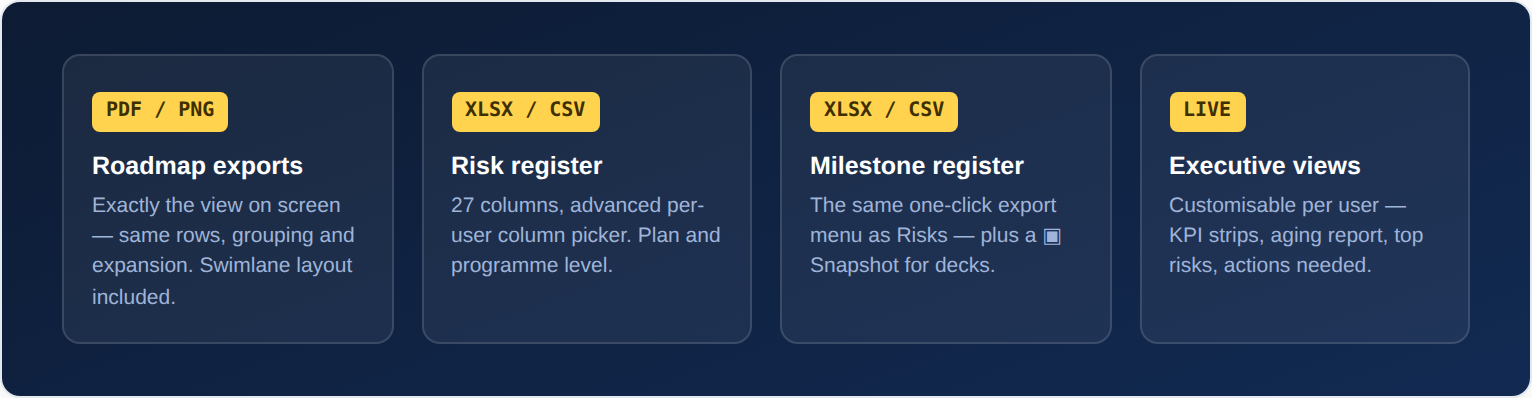
  • Quarterly reporting that doesn't require a separate spreadsheet — export PDF/PNG snapshots of outcome progress, RAG status, and milestone evidence direct from ADO

OutcomeMap doesn't replace your cloud cost management tool — it sits next to it. Together they answer the two FinOps maturity questions: what did we spend? and what did we deliver?


Feature comparison

Feature Starter Professional Enterprise
OKR / Outcome hierarchy (configurable terminology) ✅ ✅ ✅
Gantt roadmap ✅ ✅ ✅
Azure DevOps sync ✅ ✅ ✅
Milestones ✅ ✅ ✅
Within-plan dependencies ✅ ✅ ✅
Strategic prioritisation (drag-to-reorder) ✅ ✅ ✅
Plans included 2 plans Unlimited Unlimited
Export & reporting (PDF/PNG) ❌ ✅ ✅
Milestone comments ❌ ✅ ✅
Project Online (POL) import ❌ ✅ ✅
Cross-plan dependencies ❌ ✅ ✅
Portfolio dashboard & health strips ❌ ❌ ✅
Cascade risk detection ❌ ❌ ✅
Risk management (register, heat map, exec reporting) ❌ ❌ ✅
Executive reporting ❌ ❌ ✅
SSO / SAML ❌ ❌ ✅
SLA & dedicated support ❌ ❌ ✅
G-Cloud eligible ❌ ❌ ✅

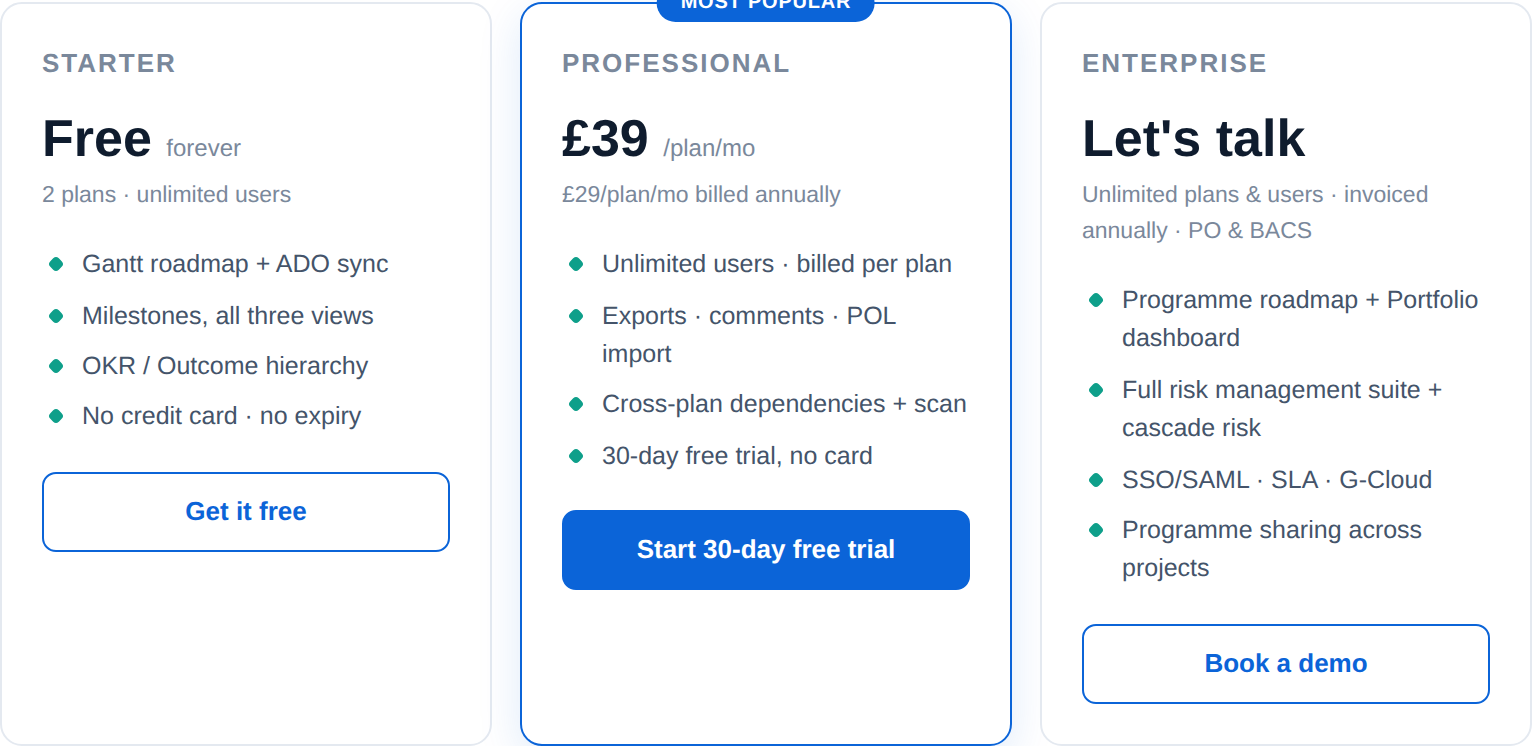
Pricing

💡 No per-user fees. Pay per plan. Start free — scale when you're ready.


🆓 STARTER — Free forever

  • 2 plans · Unlimited users
  • Gantt roadmap · ADO sync · Milestones · OKR hierarchy
  • No credit card · No expiry

⭐ PROFESSIONAL — £39 / plan / month (£29/plan/mo on annual)

  • Unlimited plans · Unlimited users
  • Everything in Starter + Export · Comments · POL import · Cross-plan dependencies
  • 🎯 Start your free 30-day trial — no credit card required

🏢 ENTERPRISE — Let's talk

  • Unlimited plans · Unlimited users
  • Everything in Professional + Portfolio dashboard · Cascade risk · Risk management · SSO/SAML · SLA · G-Cloud
  • Invoiced annually · PO & BACS accepted
  • Contact: support@outcomemet.co.uk

💬 Not sure which tier? Start free. Upgrade when you need more plans or features. No lock-in.


Flexible terminology — your framework, your language

OutcomeMap doesn't force you into one planning language. Switch between modes in Settings at any time — no data is changed, only labels:

Mode Level 1 Level 2 Level 3
Outcomes (default) Outcome Key Measure Initiative
OKR Objective Key Result Initiative
Plan / Product Plan or Product — —

This makes OutcomeMap suitable for strategy teams using OKRs, PMO teams using outcome-based delivery, and energy/CNI organisations with their own programme language.


Built for UK public sector & energy organisations

  • 🇬🇧 UK-hosted — Azure UK South/West. No data leaves the United Kingdom
  • G-Cloud eligible — Enterprise tier procurable via G-Cloud framework
  • CNI compliant — no third-party platform dependencies
  • SSO / SAML — integrates with your existing identity provider
  • Regulatory reporting — dashboards designed for DESNZ, Ofgem, and HM Treasury submissions

Technical requirements

  • Azure DevOps Services or Server 2019 Update 1+
  • Manage Extensions permission to install
  • Analytics permissions enabled for projects you want to view
  • Agile, Scrum, CMMI, Basic, or inherited process templates
  • Edge, Chrome, or other Chromium-based browsers

Version history

v1.0.614 — May 2026

  • Fixed: risk audit log now records full field-level detail on every save — score changes include before/after values for each axis (inherent_likelihood, inherent_impact, residual_score etc), general updates list every changed field (title, description, owner, due_date, trigger, mitigation_notes). Multi-field saves generate separate score and updated entries. Legacy entries with no detail still render gracefully.

v1.0.613 — May 2026

  • Fixed: export roadmap now opens showing the exact view from the screen — same row order, grouping, and expansion state. Previously it rebuilt from fully-expanded data which differed from the swimlane view. User filter changes in the modal (team lanes, progress bars etc) still work as before.

v1.0.612 — May 2026

  • Fixed: build errors — dead code after return in AdoSettings and duplicate style prop in Inspector
  • Fixed: Risk tab heading showed "Milestones timeline" instead of "Risk management"
  • Improved: Risk audit log — Variant A stem layout with avatar-as-dot, colour-coded by change type, expandable multi-field diffs, score before/after bubbles, show more/fewer toggle

v1.0.609 — May 2026

  • Fixed: mailto buttons now work in ADO iframe (CSP-safe clipboard fallback with "✓ Address copied!" confirmation)
  • Affected: Contact us button in Risk enterprise gate, Help & support button, demo banner email

v1.0.376 — April 2026

  • overview.md: POL alert upgraded, ✅/❌ in feature table, pricing redesigned, Energy & CNI link fixed

v1.0.375 — April 2026

  • Updated Marketplace screenshots from live app

v1.0.374 — April 2026

  • New logo: Hybrid 1 — stepped bars + connecting route + diamond crown
  • Route line connects bar tops expressing the map/journey concept

v1.0.373 — April 2026

  • Fully rebranded as OutcomeMap with consistent naming throughout
  • New logo: stepped bars + diamond crown mark
  • Hub tab in ADO now labelled "OutcomeMap"

v1.0.371 — April 2026

  • Feature: Strategic prioritisation — drag outcomes, KMs, and initiatives into priority order
  • Real screenshots from live app added to Marketplace overview

v1.0.364 — April 2026

  • Fixed: duplicate plan header on plans list screen
  • Fixed: document title updated to OutcomeMap

v1.0.359 — April 2026

  • Feature: "Start from Project Online import" path in Create plan modal
  • Fixed: POL-only plan milestones now persist correctly to ExtensionData

v1.0.355 — April 2026

  • Rebranded to OutcomeMap
  • Updated 3-tier pricing: Starter / Professional / Enterprise
  • 30-day Professional trial, no card required

v1.0.349 — April 2026

  • Dependency map click-to-delete
  • Drag-to-link dependencies with live preview
  • Milestone source settings (pull from ADO / create in ADO)
  • CORS security hardening, rate limiting

v1.0.336 — March 2026

  • Export to PDF and PNG
  • Cross-plan dependencies with cascade risk detection

outcomemap.co.uk

https://outcomemap.co.uk/outcomemap-energy-cni.pdf

support@outcomemet.co.uk

  • Contact us
  • Jobs
  • Privacy
  • Manage cookies
  • Terms of use
  • Trademarks
© 2026 Microsoft