Debug Capture
Automatic Screenshot on every Breakpoint or Exception
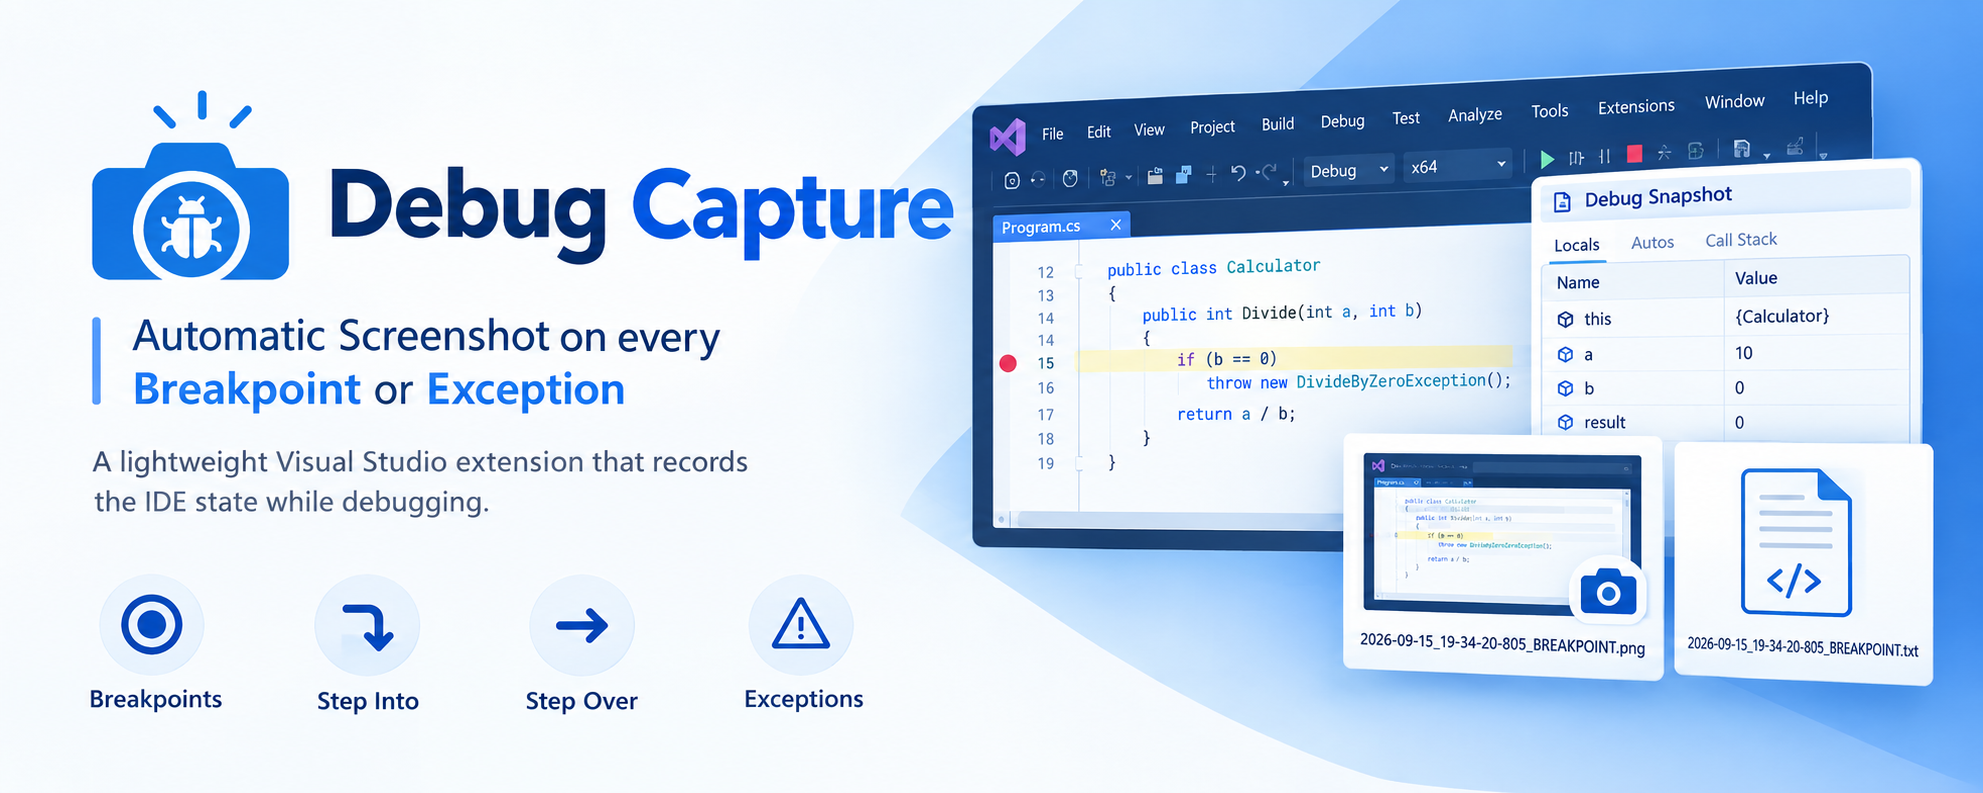
Debug Capture is a lightweight Visual Studio extension that records the IDE state while debugging.
It automatically captures a screenshot of the Visual Studio window when debugging stops at important moments.
The extension is designed for Visual Studio 2022+ and targets the 64-bit VSSDK.
What it captures
- Breakpoints
- Step Into actions
- Step Over actions
- Exceptions when the exception helper window is shown
Screenshots
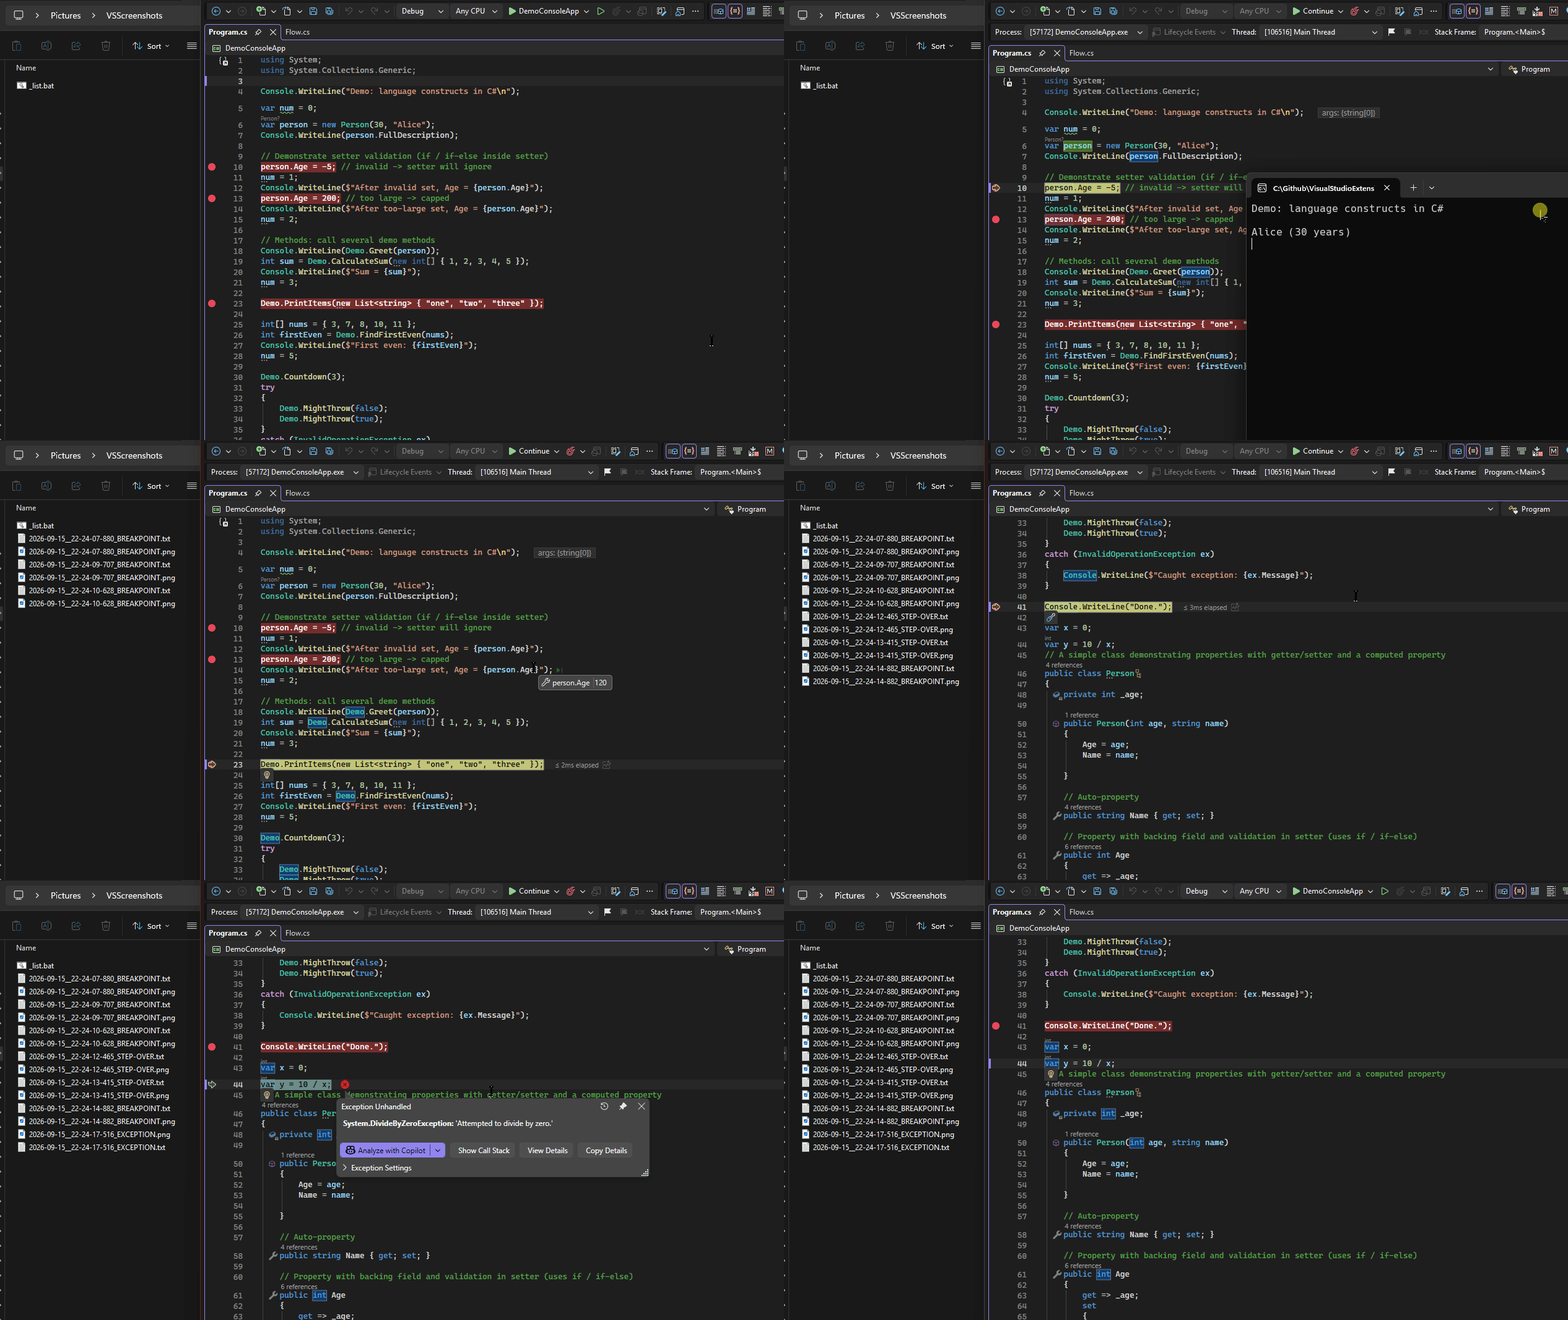
Automatic take screenshots when every breakpoint or exception is hit.
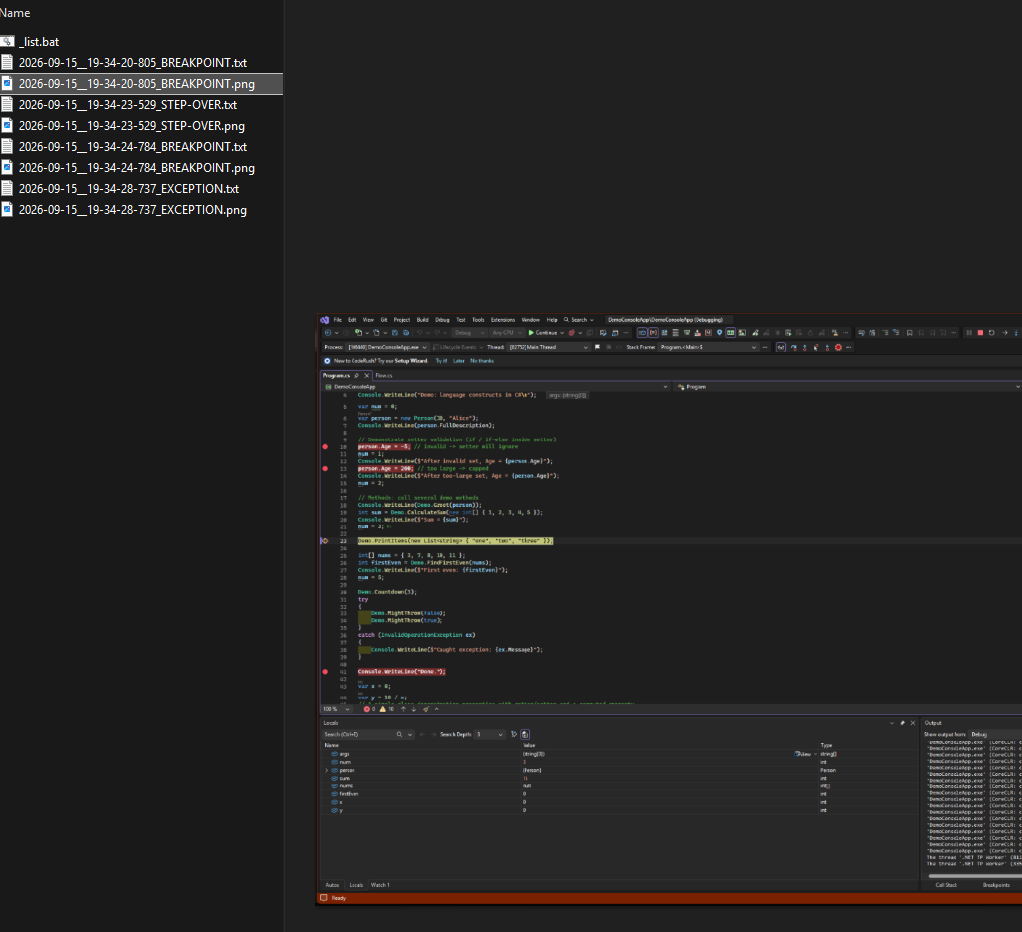
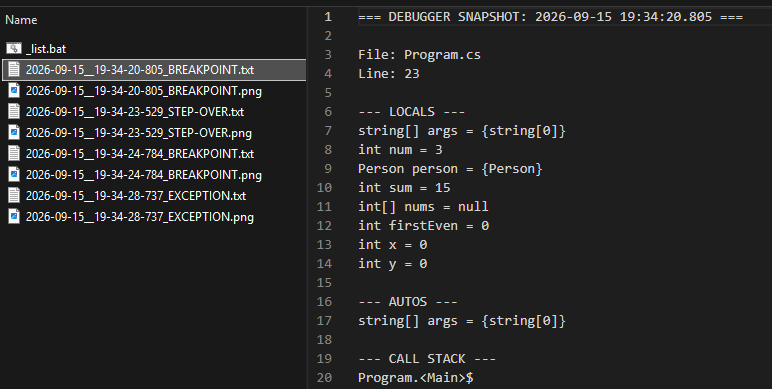
Automatic Dump Locals and Autos when every breakpoint or exception is hit, to a txt file.
Automatic Dump Unhandled Exception details to a txt file.
Video demo
Output files
Each capture creates two matching files in the same directory.
The .png file is the Visual Studio screenshot.
The .txt file is the debugger context captured for that same moment.
Files are saved to:
%USERPROFILE%\Pictures\VSScreenshots
Filename format:
yyyy-MM-dd_HH-mm-ss-fff_ACTION.ext
Examples:
2026-09-15_19-34-20-805_BREAKPOINT.png2026-09-15_19-34-20-805_BREAKPOINT.txt2026-09-15_19-34-23-529_STEP-OVER.png2026-09-15_19-34-23-529_STEP-OVER.txt2026-09-15_19-34-28-737_EXCEPTION.png2026-09-15_19-34-28-737_EXCEPTION.txt
The timestamp and action suffix are shared, so the related screenshot and debugger text file are easy to pair.
Text snapshot contents
The .txt file includes debugger context for the same moment as the screenshot.
It contains:
- Current file path, relative to the project when possible
- Current line number
- Locals window values
- Autos/argument values
- Call stack entries
Variable reads are fault tolerant. If Visual Studio cannot evaluate a value, the error is written into the text file instead of interrupting debugging.
Preview TXT files with FZF
Explanation: this helper script lists the generated .txt snapshot files and opens an interactive FZF picker. The preview pane shows the selected debugger snapshot, making it quick to inspect Locals, Autos, file/line, and call stack data without opening each file manually.
Create _list.bat in the screenshot folder:
powershell -NoProfile -c ls -Name *.txt | fzf --layout=reverse --preview-window=wrap --preview="type {}"
Run _list.bat to browse debugger text snapshots with a preview pane.
- Time Travel Debugging
- Debugging

