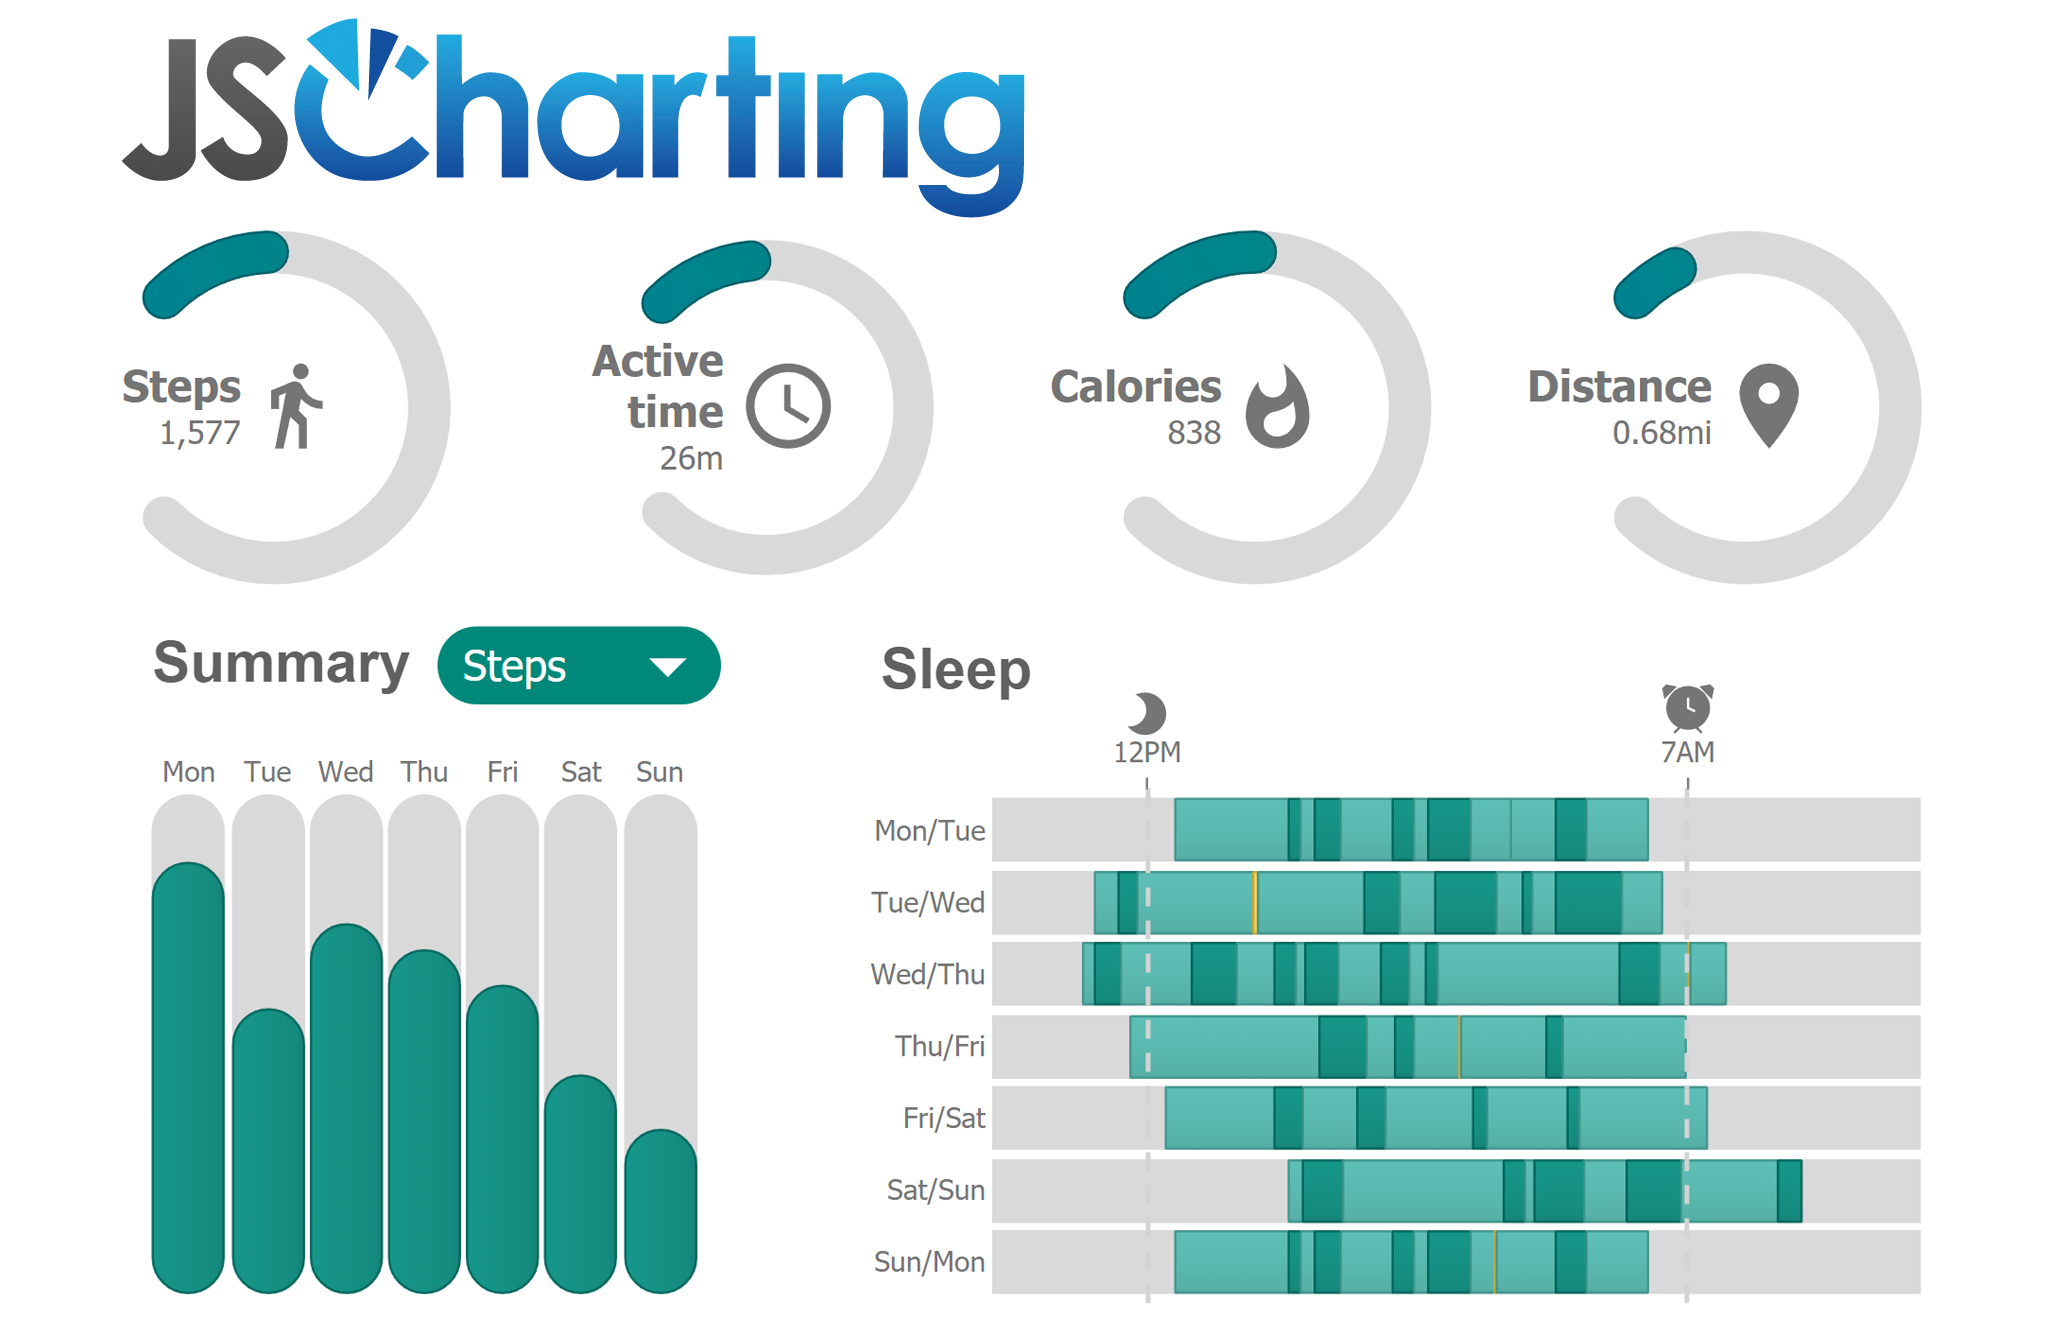
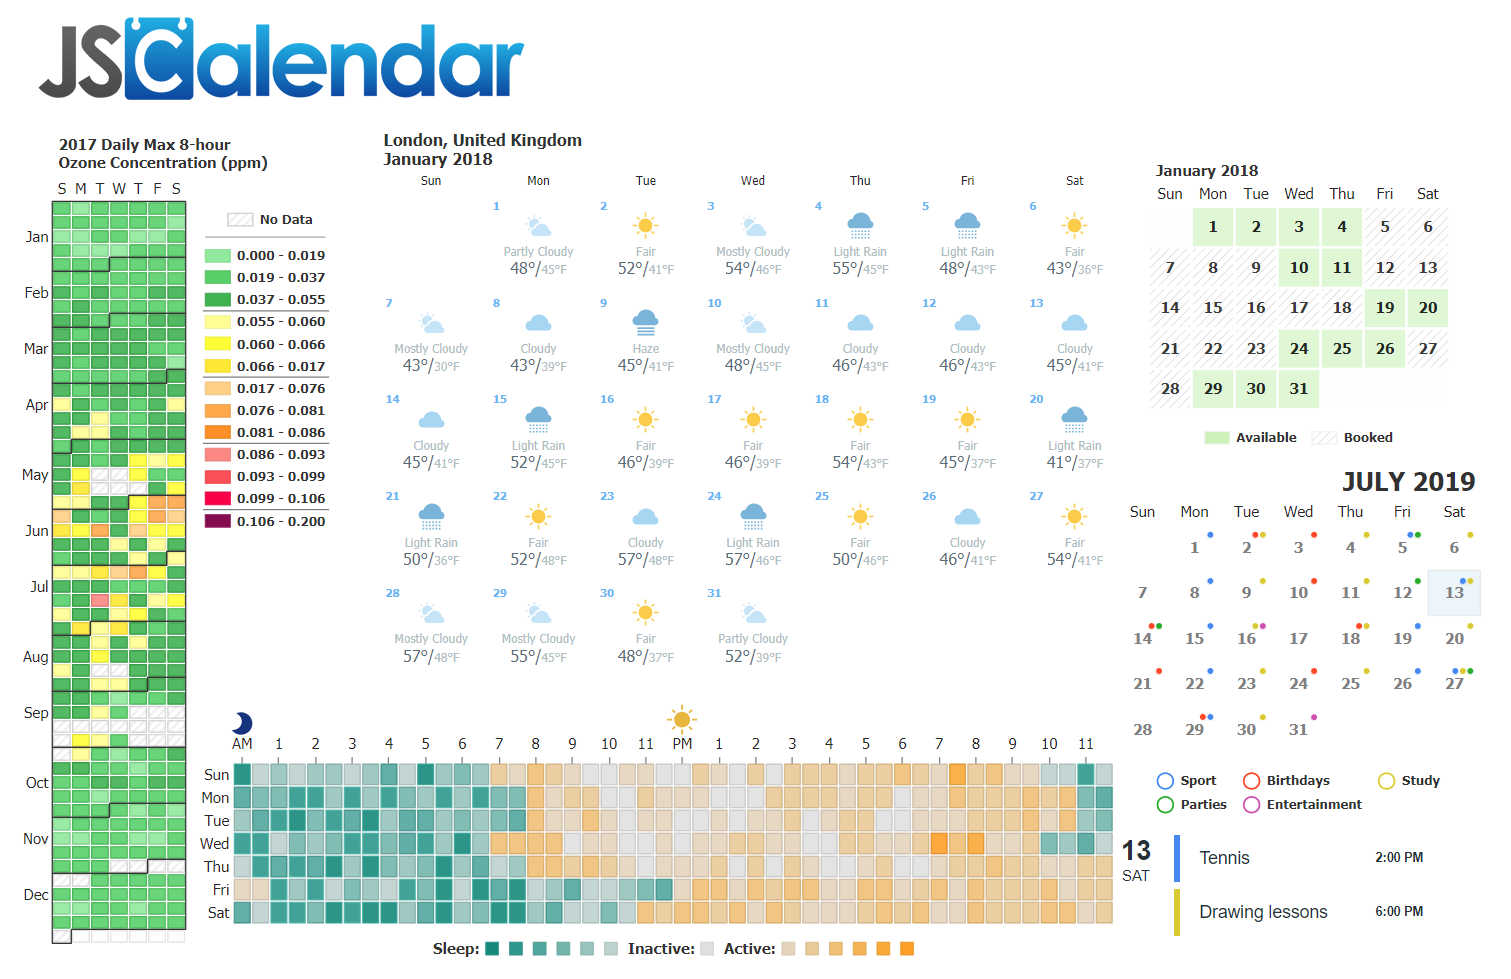
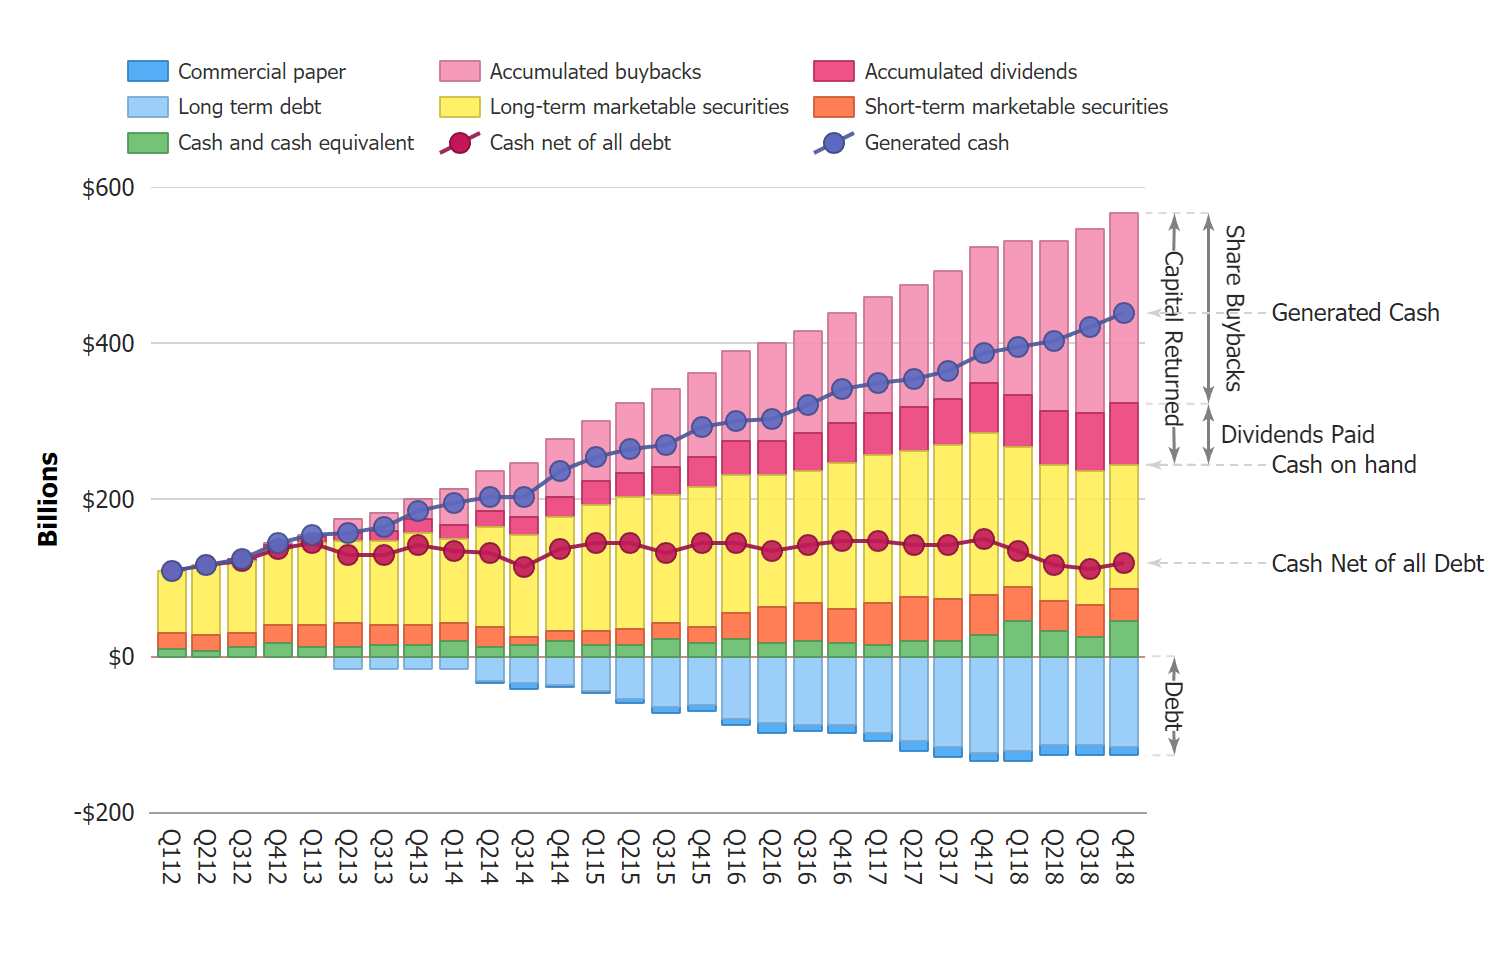
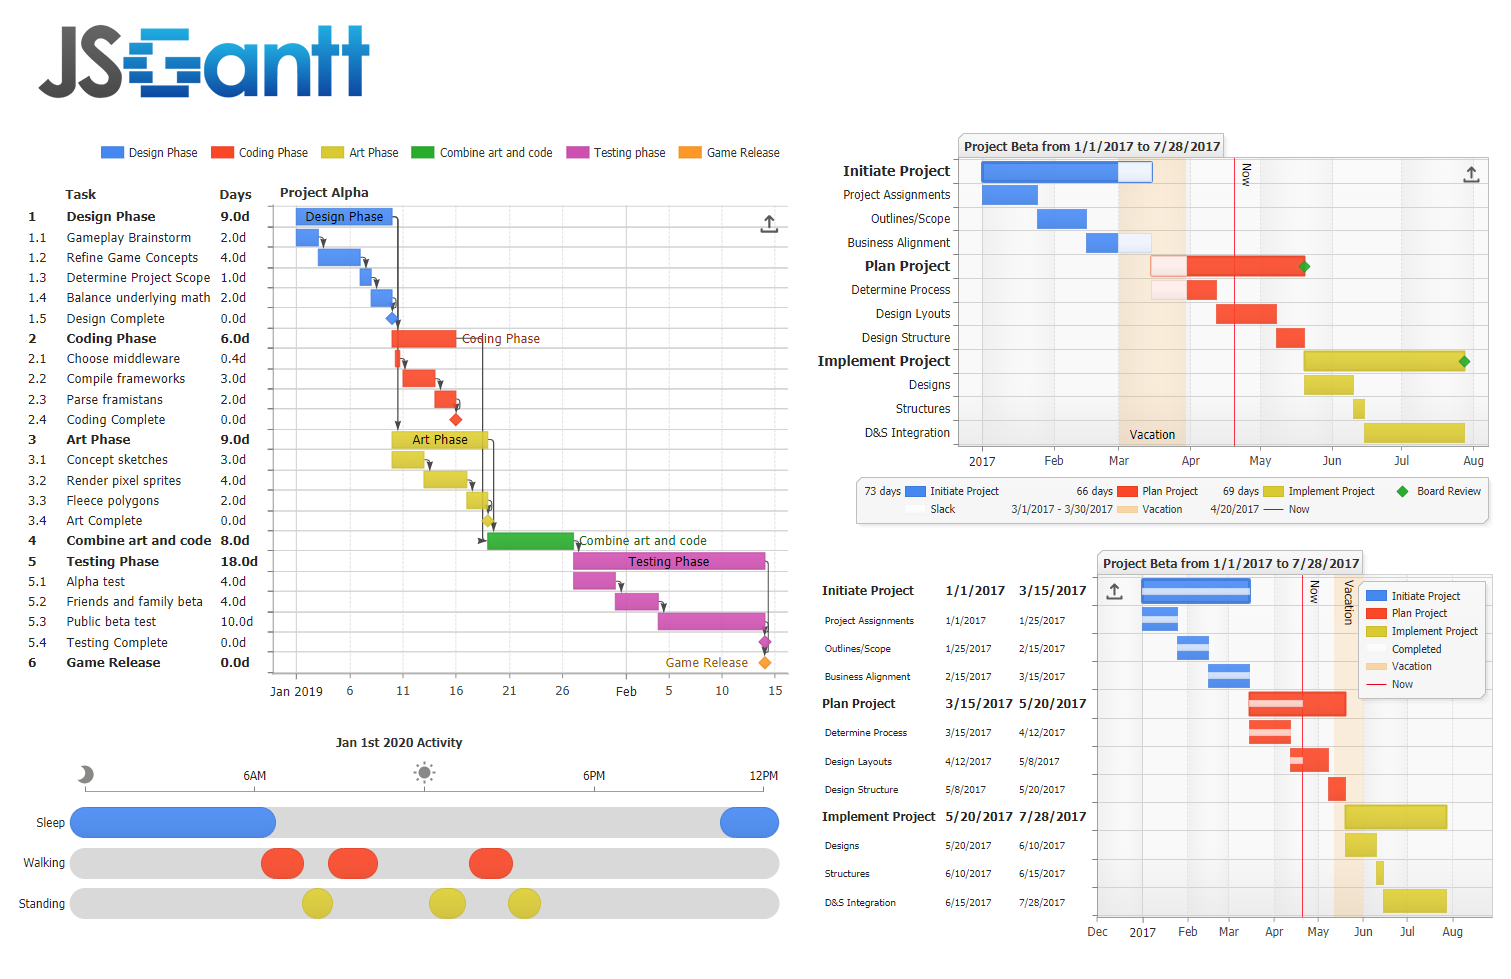
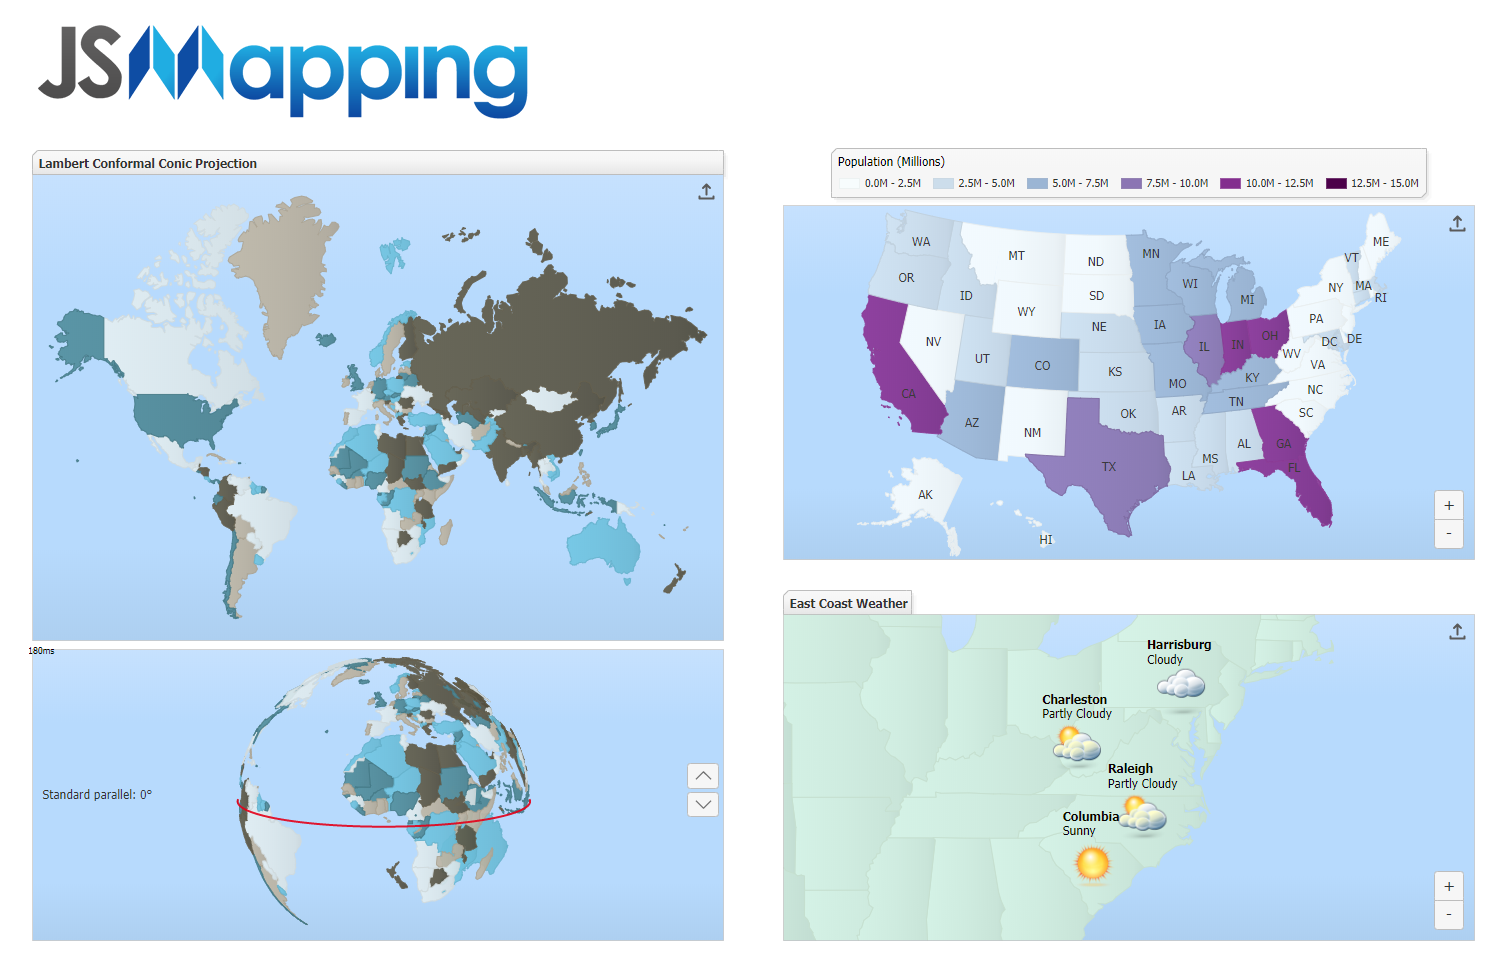
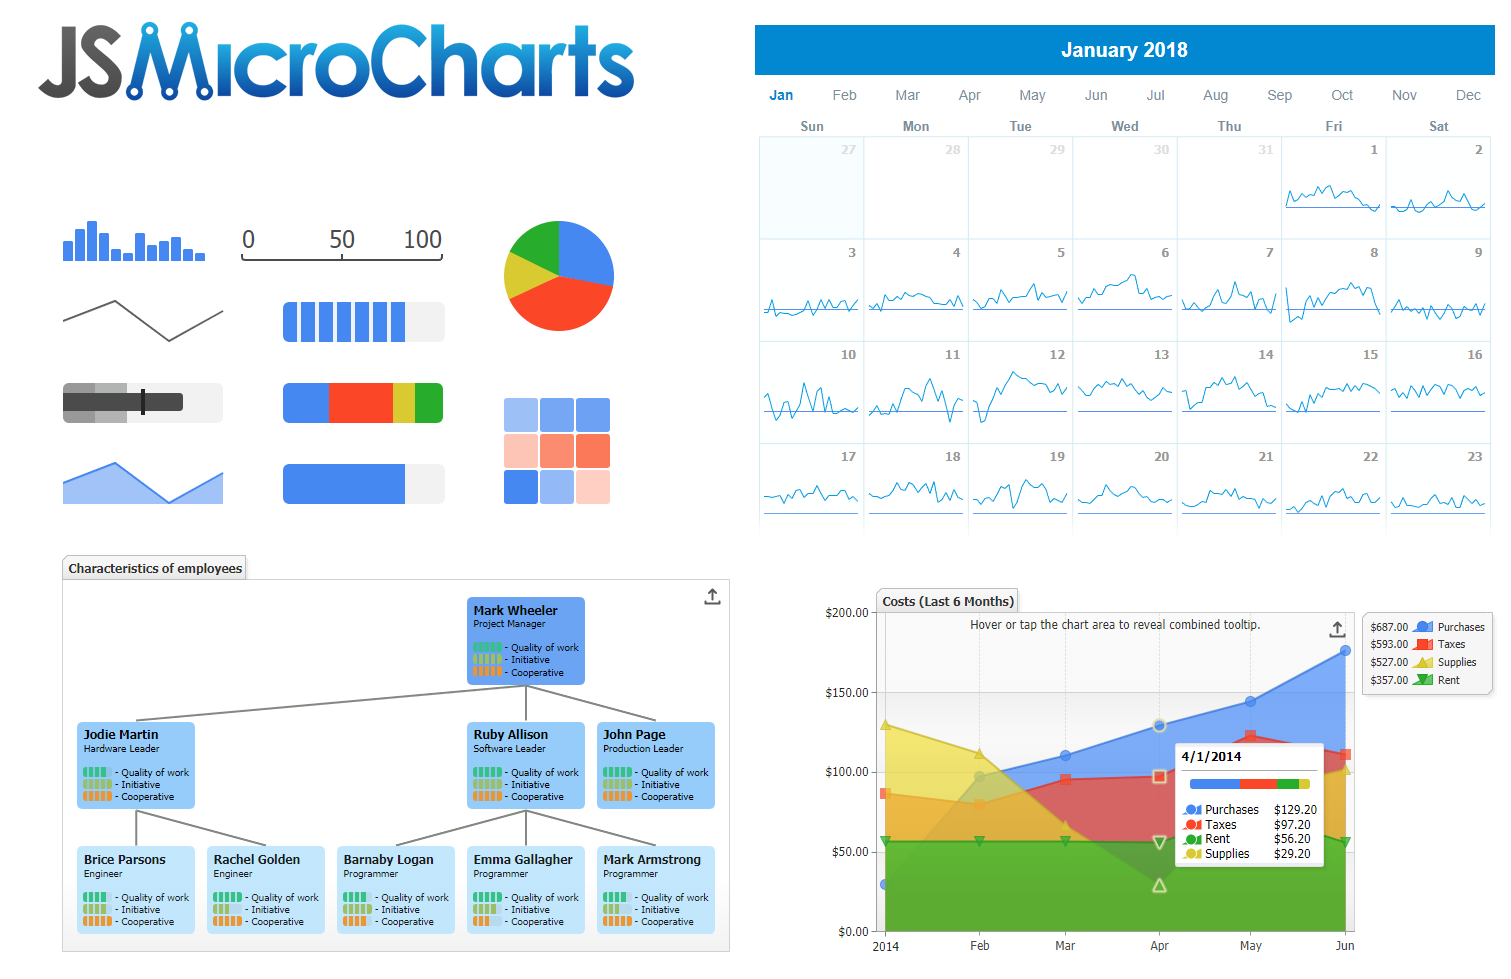
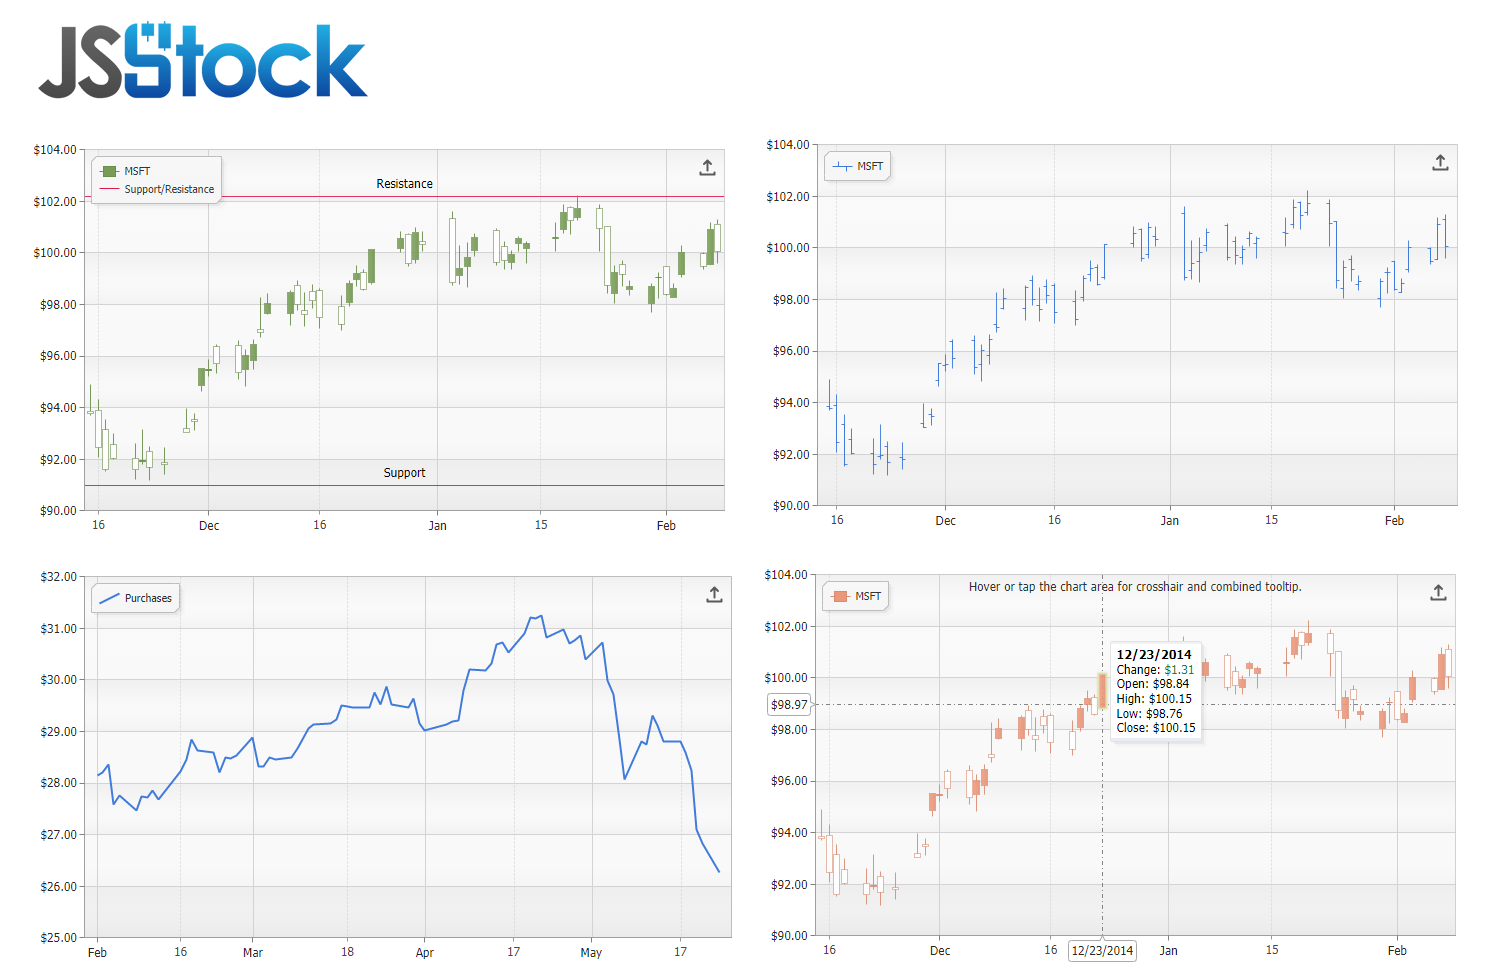
JavaScript Charts for Visual StudioBeautiful JavaScript Charts and Data Visualizations Each JavaScript chart library includes the full suite of 150+ advanced chart types plus JavaScript stock charts, seamless grid and calendar support, JavaScript maps, Gantt charts, gauge charts, and micro charts bundled together in the JSCharting library at no additional charge. The features you need; the speed you demand! JSCharting offers hundreds of features to meet your advanced requirements from globalization and internationalization support to advanced visuals, interactive charts and real-time results via JavaScript, HTML5 and JSON. Advanced time series enables intuitive display of data points with date aggregation for your data-driven web pages and automatic AJAX updates. A chart type for every need, on every device! Including pie charts, line charts, bar charts, area charts, scatter plots, heatmaps, splines, steplines, advanced combination types, finance, stock charts, donut charts, and scatter charts plus new types on every JSCharting release! Beautiful charts rendered with true vector scalable and responsive SVG elements and no HTML5 canvas dependencies. Plugin free works with all angular, jquery available on github but none are required. Server side database helper saves developer time. Chart Type Gallery View a full listing of all the types of JavaScript charts offered in JSCharting.
Typescript definition supports intellisense for JSCharting usage in Visual Studio. Free licenses and trial download available JSCharting provides a free developer subscription to evaluate prior to purchase which can be downloaded here. In addition, free branded licenses and commercial licensing options are available. |


