.NET Runtime Analyzer is an easy-to-use set of tools to investigate various kinds of runtime issues of .NET applications by providing the following tools:
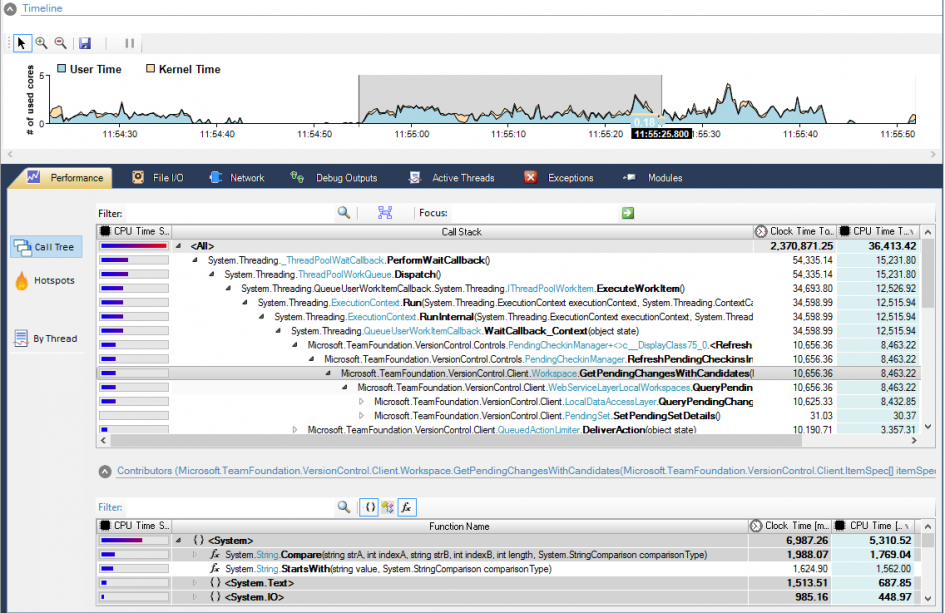
Performance Analyzer
✔
Fastest instrumentation performance profiler with highest accuracy
✔
Line level sampling performance profiler to pinpoint performance bottlenecks within the application
✔
Fast performance profiling with both CPU and clock time consumption information
✔
Focus feature to minimize time to find root cause of issues
✔
Timeline support to investigate performance issues over time
✔
Network- & I/O-Traffic Tracer with Data Capture
✔
Managed/unmanaged code profiling to analyze pure .NET or mixed applications
✔
Minimized snapshot file size to allow long term storage
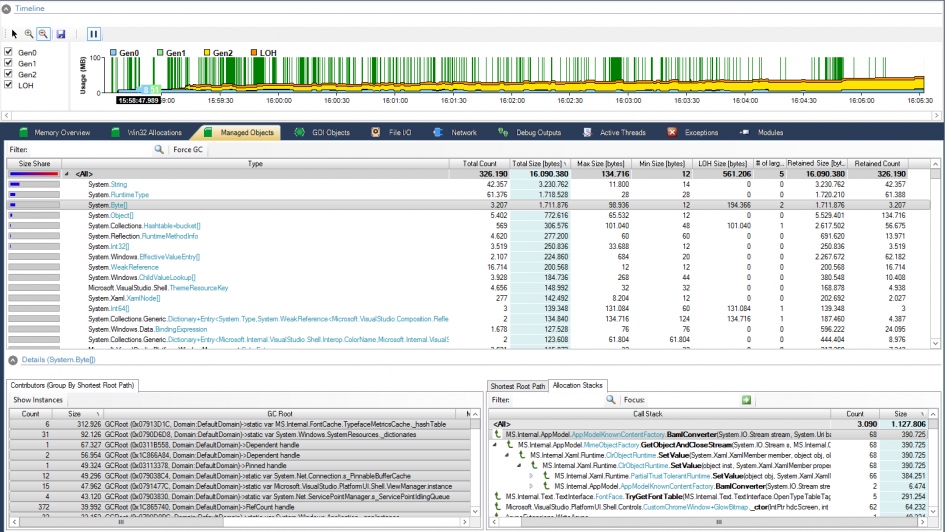
Memory Profiler & Resource Tracker
✔
Provides memory overview to display usage by type (Managed Heap, Win32 Heap, Modules, Mapped Files, Stack etc.)
✔
Displays Managed Memory usage with GC root paths and allocation stacks
✔
Tracks Win32 memory allocations to pinpoint native memory leaks
✔
Provides GDI resource tracking functionality
✔
Support to import memory dump files
System-/Application Event-Tracker
✔
Selectively traces interesting system and application event topics with line level trigger stacks and event time stamp information
✔
Tracks managed/unmanaged event activity with data capture, and error information
✔
File I/O activity including named pipes: .NET Remoting / WCF calls, performed read/write operations including the data read/written
✔
Network activity tracer: WCF calls, Database queries, Web Access with source and target endpoints
✔
Startup-Performance optimizer to analyze JIT compilations, relocations
✔
Concurrency analyzer (Threading Events with trigger stacks, Locks) to pinpoint threading usage
Exception Tracker
✔
Traces application exceptions with line level and timeline information