FlexChart: A WPF Chart ControlEnhance your data visualization with 80+ charts, interactions, and elements for enterprise apps using FlexChart for WPF — a fast, flexible .NET chart control. |
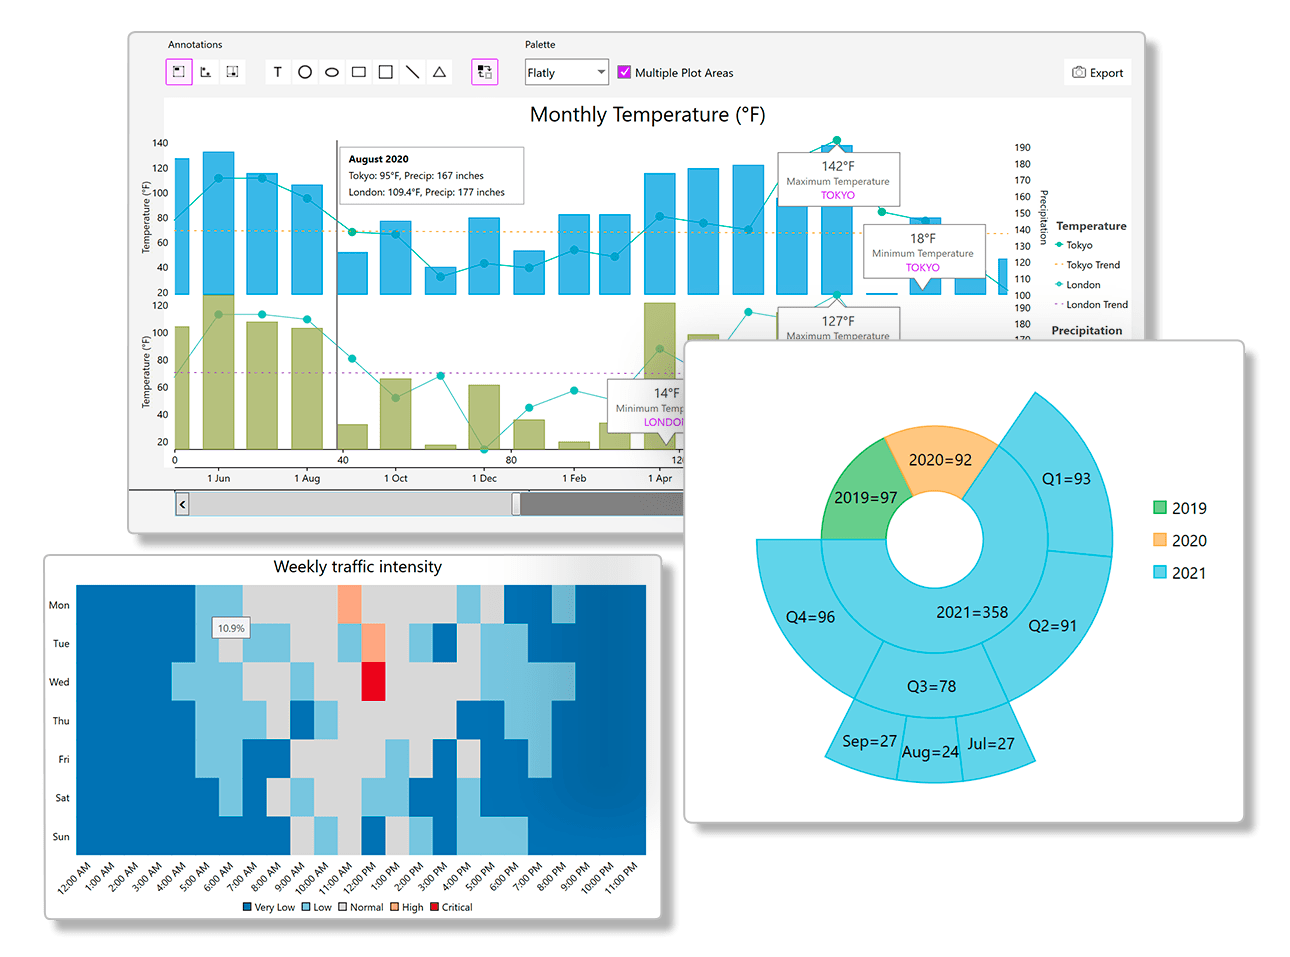
80+ Chart Types, High-Performance WPF Chart Controls
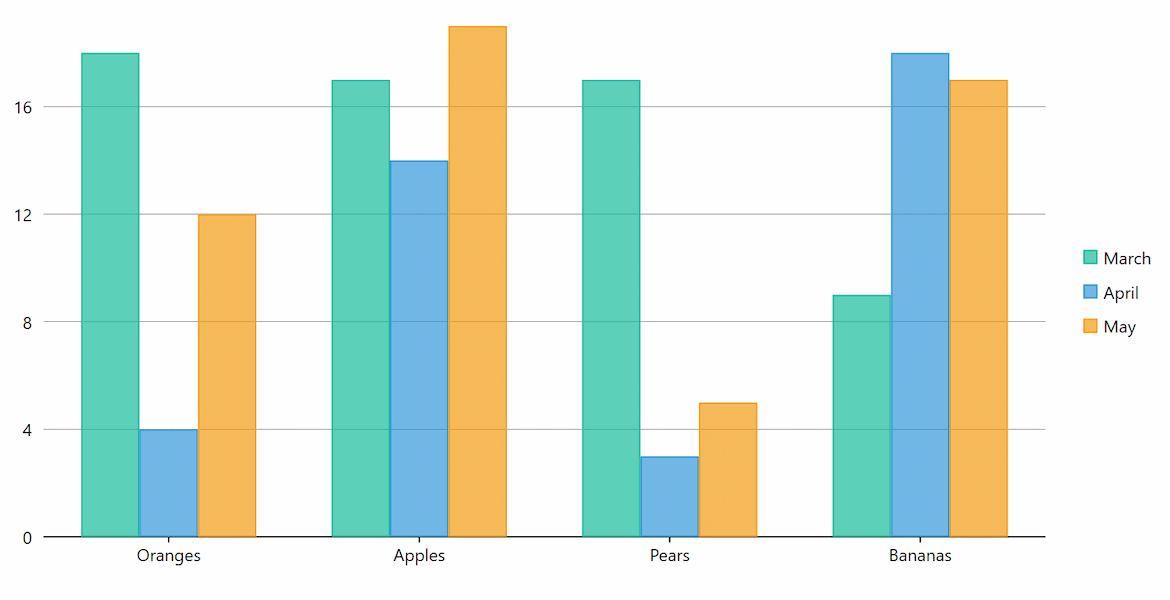
Why Choose FlexChart for WPF?80+ Chart Types and VariationsBuild the exact chart you need with FlexChart's many built-in WPF chart types, combination plots and stacking options. Specialized Chart ComponentsGet optimized WPF chart components for pie, radar, polar, sunburst, treemap, and financial charts. Create Interactive DashboardsBring your data visualizations to life with interactive features like scrolling, zooming, selection and drill-down. Out-of-the-Box Analysis FeaturesWrite less code with built-in data analysis features such as waterfall series, error bars and trendlines. Flexible CustomizationFlexChart exposes flexible event handlers and properties that allow custom styles for data points and labels. Cross-Platform CompatibilityShorten your cross-platform migration using the same chart API across desktop, mobile and web. Popular WinForms ChartsBar and Column ChartsCompare multiple data series over time in a vertical bar or column chart. FlexChart supports displaying negative values below the axis origin.
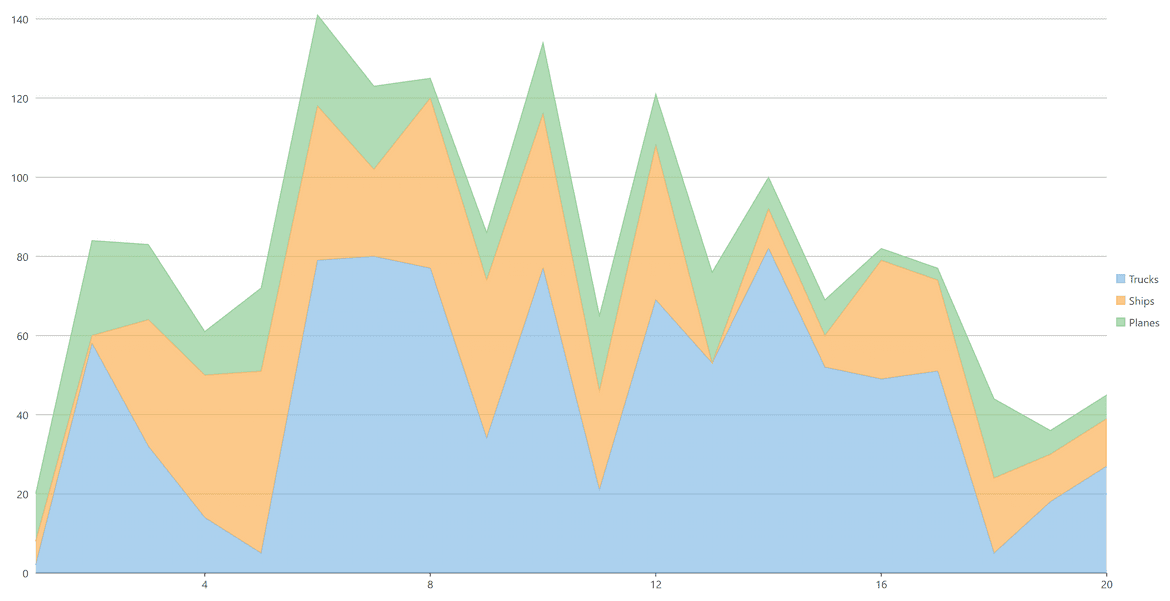
Line and Area ChartsDisplay changes in data over short and long periods of time with a basic line chart with optional symbols.
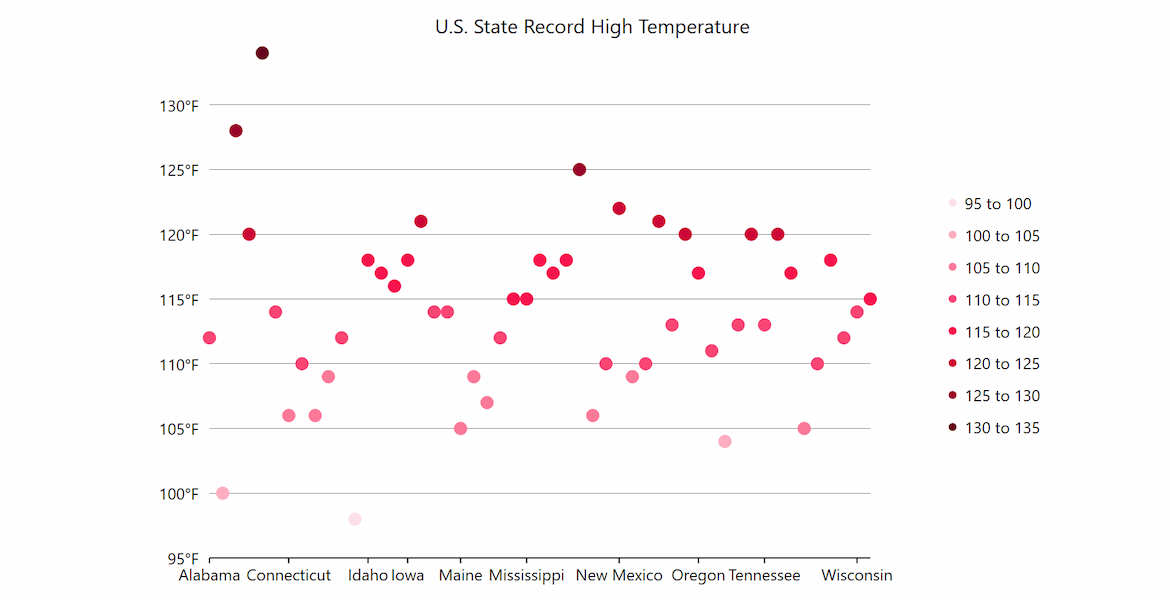
Scatter ChartsDemonstrate correlation between data points and a set of numerical data along the x-axis and the y-axis. WPF scatter charts combine values into single data points and display uneven intervals or clusters.
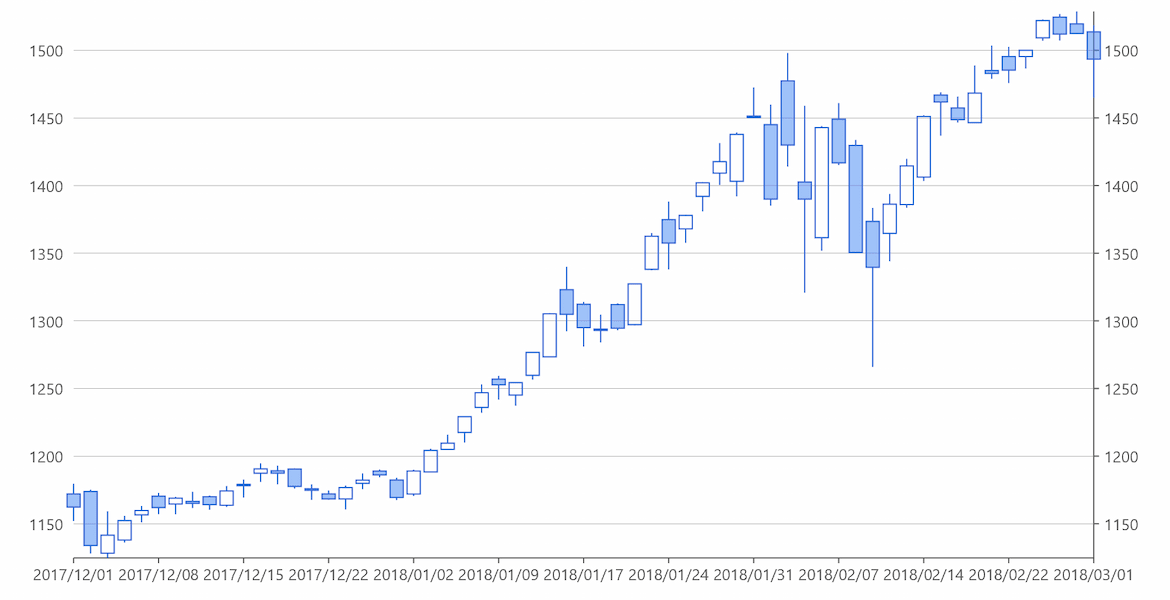
Financial ChartsWith Studio Enterprise you get FinancialChart, which includes 9 additional chart types featuring Candlestick, HLOC, and more.
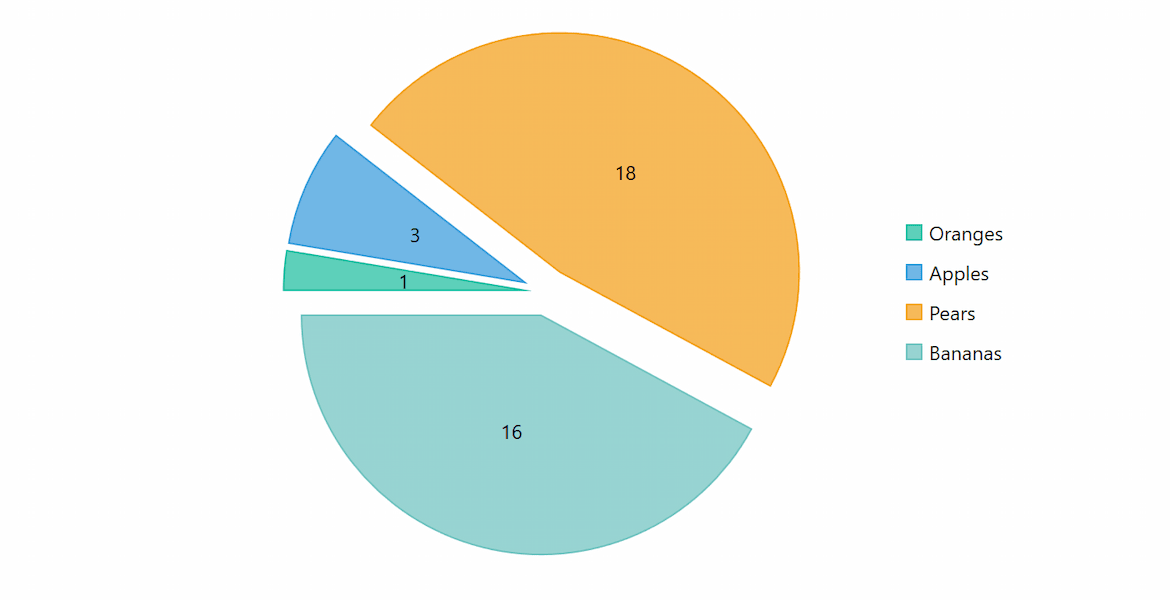
Pie ChartsWPF pie charts show how parts of a whole add up to 100%. FlexPie features include doughnut, exploded slices, animation, selection, and rotation.
Additional ResourcesThe mission of MESCIUS USA is to provide customers with the premier studio of innovative UI controls, tools, and solutions including deep functionality reporting, analysis, and spreadsheet platforms. also provides the best .NET reporting solution available, Active Reports; the fastest, deepest spreadsheet solution, Spread; 400+ .NET UI control collection, ComponentOne; 100+ JavaScript UI controls in Wijmo; and Documents APIs for Word, PDF, and Excel. us.sales@mescius.com | developer.mescius.com | 800.858.2739 | 412.681.4343 ©2026 MESCIUS USA, Inc. All Rights Reserved. |