DataViewsJS - Enhanced Data Presentation Views
Fast! Pure JavaScript, optimized for speed
Choose from a variety of views including: grids, cards, trellis, calendar, Gantt, news feed, timeline and more
Highly customizable
Write customized reports entirely in code
Change layouts with a single line of code
Advanced comprehensive JavaScript data presentation controls
DataViewsJS enables you and your users to easily and professionally customize the presentation of the data. Visualize and provide different perspectives into the data using Grid, Horizontal Grid, Card, Masonry, Kanban, Timeline, and Gantt.
Virtual Loading and Server-Side Paging
You get to make the decision. Only load the specific data that you need from a server as you need it to better optimize the performance of your application.
Standalone Calculation Engine
Leverage the powerful calc engine to perform calculations on any set of JSON data. With our calculation engine, your computing power is optimized for large data and complex calculations. The calculation engine can also be used separately from DataViewsJS.
Full Framework Support
Full Support for JavaScript frameworks. Easy to use and included support for Angular, React, and Vue.
Fast, full-featured, and customizable data grid for efficient data display and editing.
Localization
Includes localized resources for Chinese, Japanese and Korean. Additional languages can be easily added.
Professional Layout Plugins

DataViewsJS interchangeable layouts
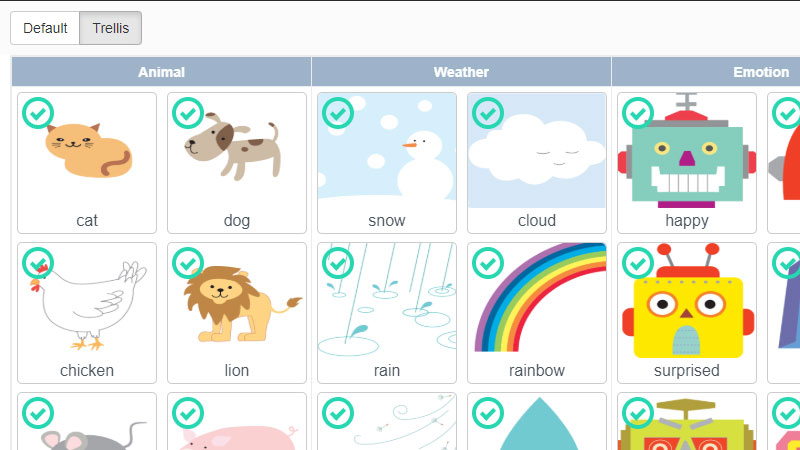
Build advanced data views for your CRM, project management, social networking, eCommerce or any business application. Achieve ultimate flexibility by making layouts, row templates, data fields, calculations, and editing modes completely and easily customizable.
|

Customize Everything
Each layout includes a full set of options and an API, so customization is simple. Decide between vertical or horizontal alignment, determine field placement, or format the overall look. The possibilities are endless.
|

Gantt
Use the Gantt column to visualize project data ranges
|

Custom Presenters
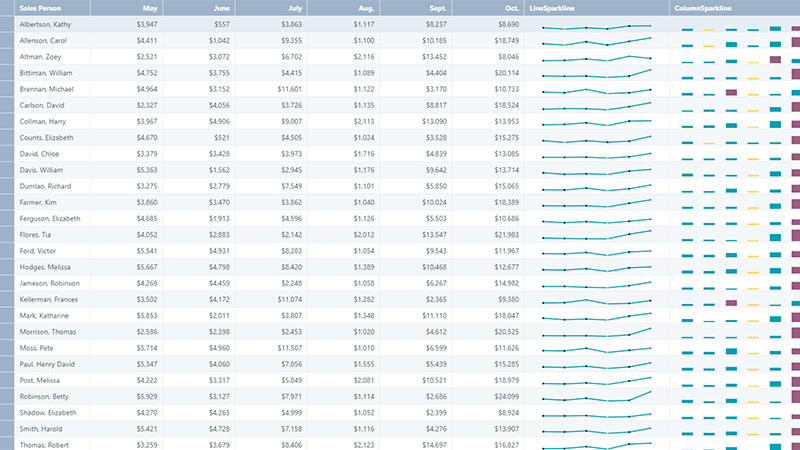
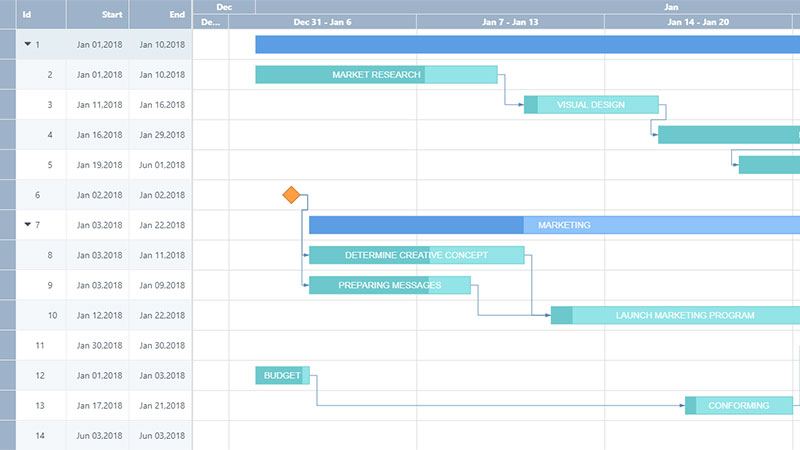
Write your own presenters to format data fields. Useful to format images, visualize numbers, and apply conditional formatting.
|

Dropdown Form Editing
Edit records in a form that appears under the record being edited
|

Calculated Fields
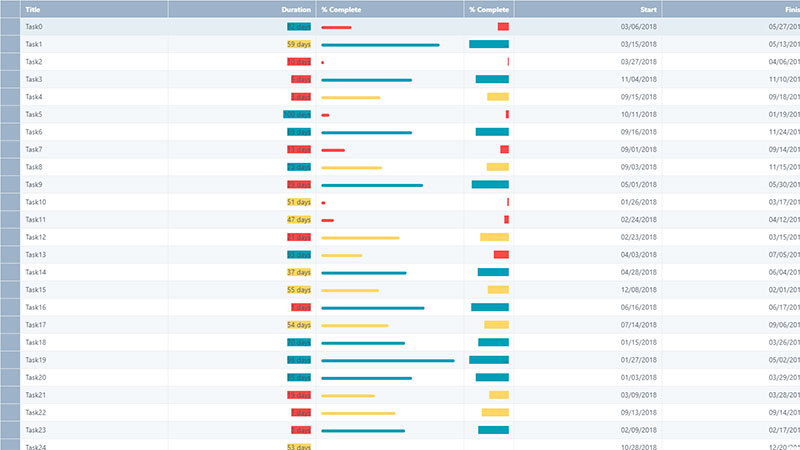
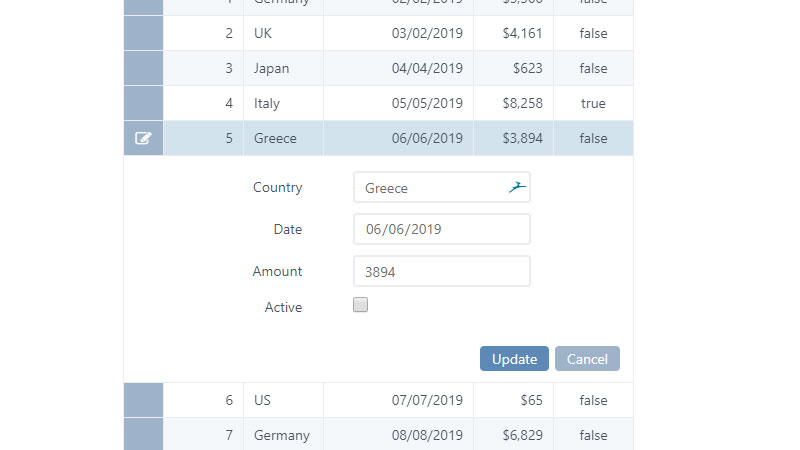
Write functions and display results as numbers, strings, sparklines, and other indicators
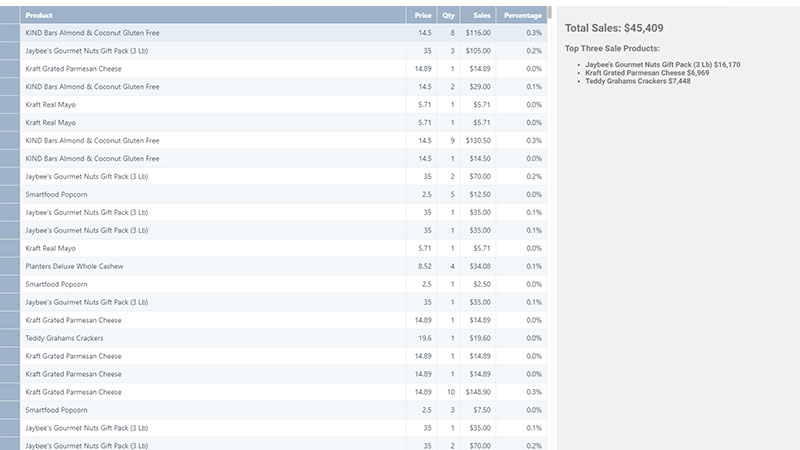
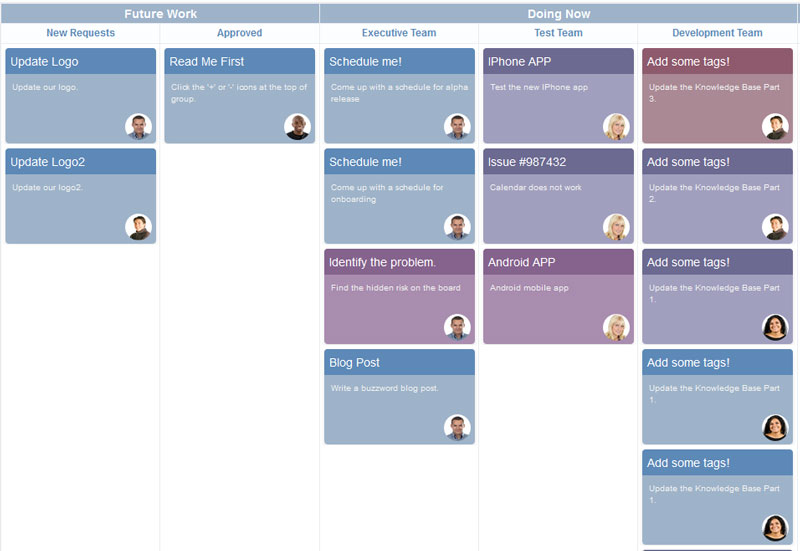
|
This example shows the most basic implementation of DataViews and demonstrates how easy it is to add a DataView component to a page

Explore all of the DataViewJS Features
DataViews Angular Component
Using DataViews in PureJS
DataViews React Component
Referencing DataViews in your npm-based applications
DataViews Vue Component
Creating a Basic Grid
Localization
Using SASS
Themes
Using Touch Support
Using DataViews Libraries
Adding Action Columns
Auto Merge
Binding Multiple Data Fields to a Single Column
Adding Column Presenters
Adding a Column Tool Panel
Defining Columns
Formatting
Adding Multiple Column Headers
Adding Pinned Columns
Reordering Columns
Resizing Columns
Adding a Sparkline Column
Working with Rows
Auto Add Row
Enabling Auto Row Height
Using a Column Header Row
Using Row Templates
|
Grid Functions
Buffered Rendering
CRUD
Calculations using DAX
Filtering
Fixed Header
Grouping
Live Loading
Pagination
Right-to-Left Formatting
Adding a Search Box
Allowing Selection
Using Serialization
Sorting
Using the Tree Grid
Editing Data
Using a Custom Inline Editor
Creating an editForm Template
Using Editor Modes
Using Layouts
Card Layout
Grid Layout
Horizontal Layout
Masonry Layout
Gantt View
Using Grouping Strategy
Calendar Grouping
Timeline Grouping
Trellis Grouping
|
In DataViewsJS, the Trellis grouping strategy combined with the Grid layout engine gives you the power to create this kind of organization. With this implementation, cards are organized into vertical lists in a grid view, allowing the user to drag and drop cards from different columns depending on what is being worked on.
Learn more!

Resources for GrapeCity's Dataviewsjs
Demos
Blogs
The mission of GrapeCity is to provide customers with the premier studio of innovative UI controls, tools, and solutions including deep functionality reporting, analysis, and spreadsheet platforms. GrapeCity provides the best .NET reporting solution available, Active Reports; the fastest, deepest spreadsheet solution for JavaScript and .NET, Spread; 300+ .NET UI control collection, ComponentOne; 80+ JavaScript UI controls in Wijmo; and Documents APIs for Word, PDF, and Excel. |
us.sales@grapecity.com | www.grapecity.com | 800.858.2739 | 412.681.4343 ©2020 GrapeCity, Inc. All Rights Reserved. |
| |