ActiveReportsJS - JavaScript Reporting Tool for Web ApplicationsA professional reporting tool for web applications with cross-platform designer and fast reporting engine to create lightweight analysis, budgeting, and financial reports. client-side exporting and printing with no external dependencies. |
ActiveReportsJS is the reporting tool used by front-end developers to embed reporting functionality within web applications. Integrate our JavaScript Report Designer and Viewer components into web applications to build, preview, export, and print your reports on any platform.
Related LinksTop Features | Download Trial | Demos | Contact Support | Pricing Popular Features & Highlights
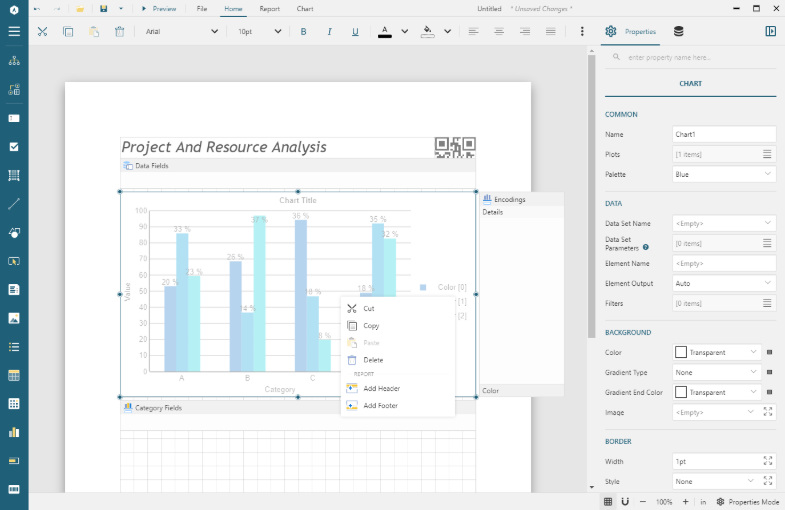
Standalone Report DesignerUtilize our cross-platform report designer to create interactive reports and modify or create new templates.
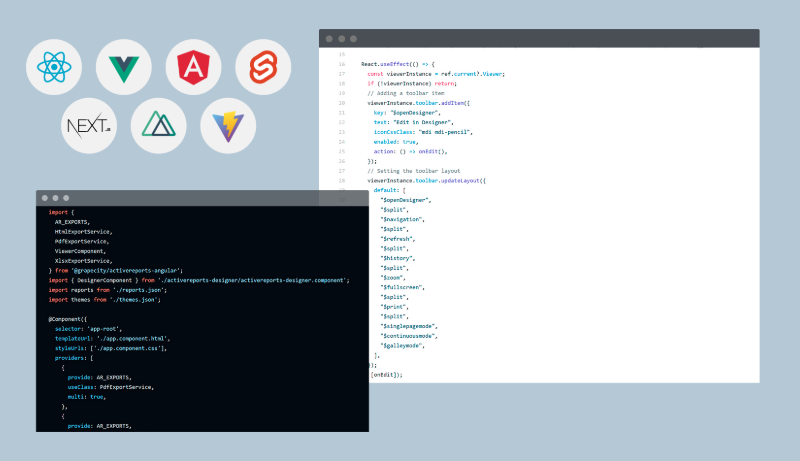
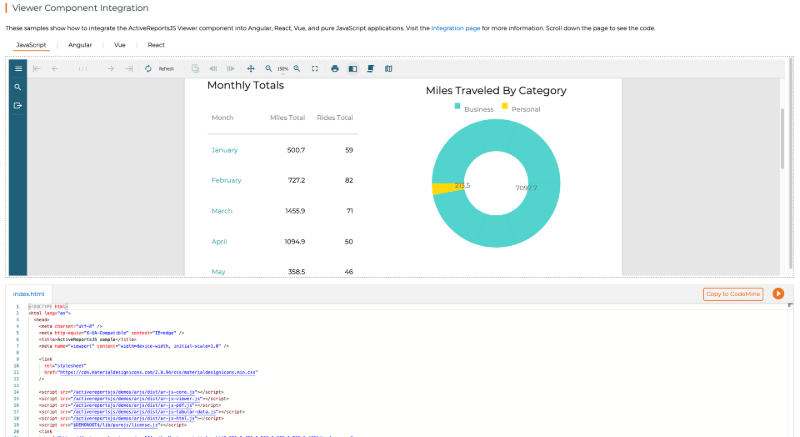
Front-End Framework SupportEasily integrate ActiveReportsJS into your application with built-in support for:
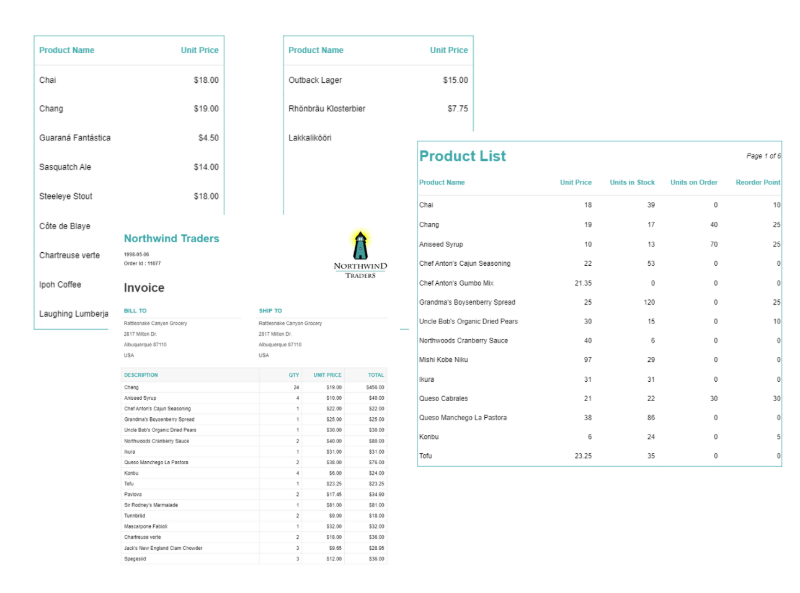
Design Dynamic Report LayoutsDetermine how the report output arranges dynamic content by selecting from our different report layouts:
Branch Out With Multiple Report Types
Build any report you can imagine with our vast controls and built-in templates. Some of our report types include: Serverless ReportingIntegrate our ActiveReportsJS reporting engine into your front-end applications using NPM packages, CDN-hosted, or app-hosted JavaScript code with ZERO server-side dependencies.
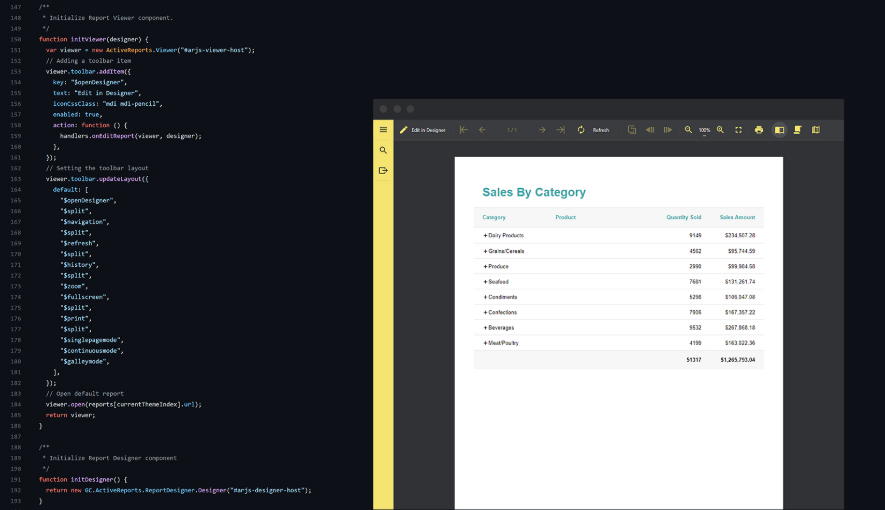
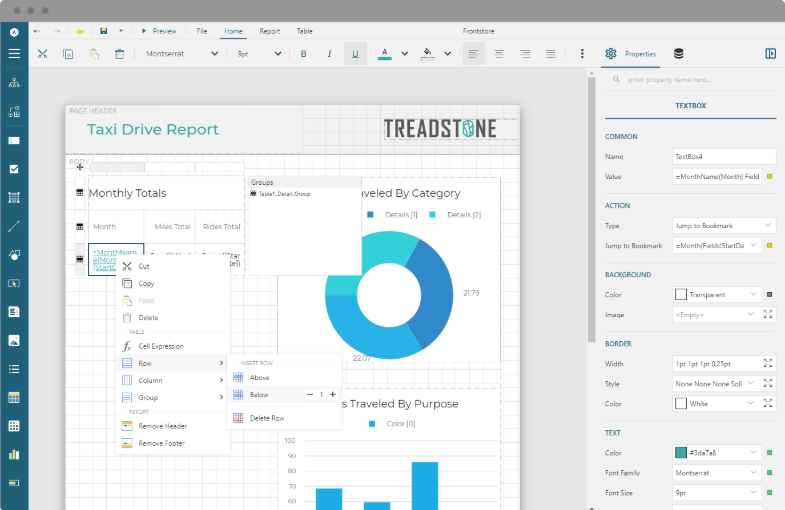
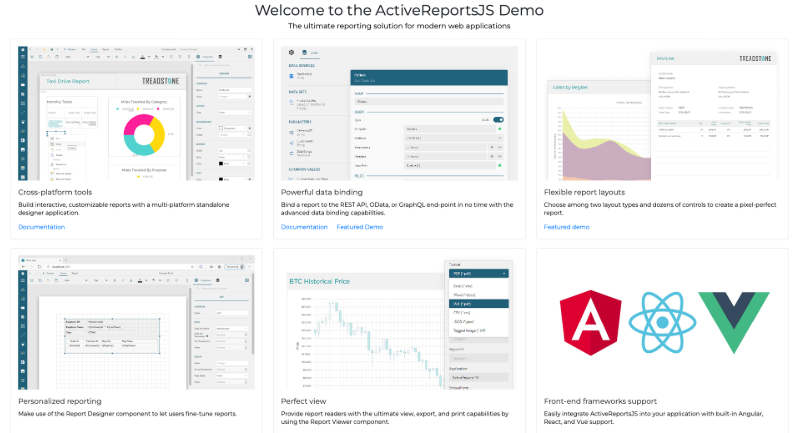
Interactive DemosTest drive ActiveReportsJS through our various demos! Embeddable JavaScript Report DesignerCreate and fine-tune reports by integrating our JavaScript Report Designer. Utilize the API to define application functions to create, save, open, and preview your reports. Change the UI color scheme through either our predefined themes or create your own.
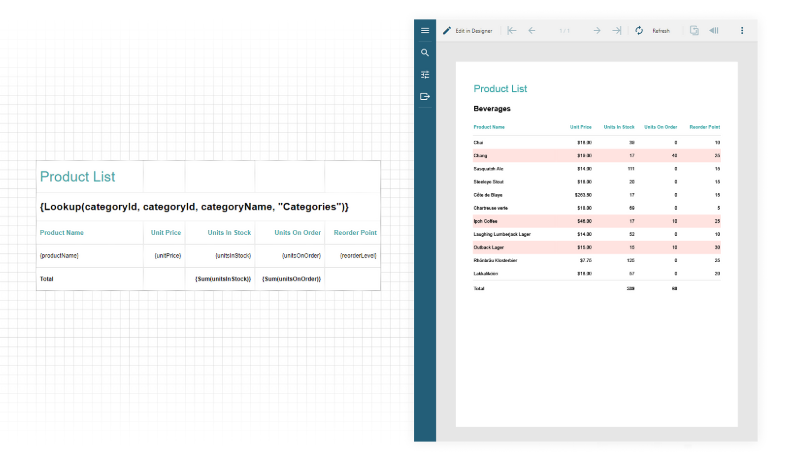
JavaScript Report ViewerProvide the end-users of your applications the ultimate view, export, and print capabilities with our Report Viewer. This JavaScript component can be integrated into a wide variety of front-end solutions and provides unlimited UI customization and localization.
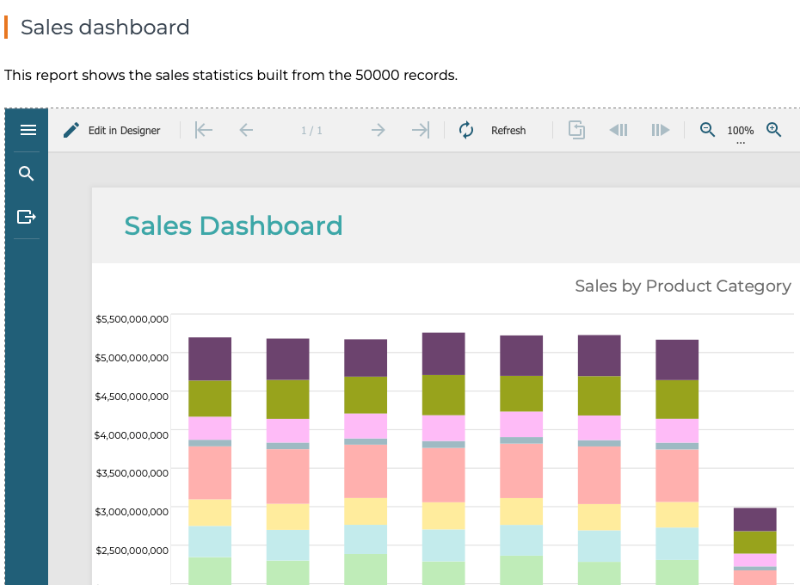
Dashboard LayoutView and edit a sales dashboard use case. This report pulls sale statistics from a data set of 50,000 records.
Demo GalleryView our collection of featured ActiveReportsJS Demos including Personalized Reporting, Flexible Report Layouts, and more. Looking for a specific demo? Try our drop-down menu or search feature.
Additional ResourcesExplore ActiveReportsJS' Features Have Questions? Contact Support The mission of MESCIUS USA is to provide customers with the premier studio of innovative UI controls, tools, and solutions including deep functionality reporting, analysis, and spreadsheet platforms. MESCIUS USA provides the best .NET & JS reporting solution available, ActiveReports; the fastest, deepest spreadsheet solution, Spread; 300+ .NET UI control collection, ComponentOne; 80+ JavaScript UI controls in Wijmo; and Documents Solutions for Word, PDF, and Excel. us.sales@mescius.com | developer.mescius.com | 800.858.2739 | 412.681.4343 ©2026 MESCIUS USA, Inc. All Rights Reserved. |