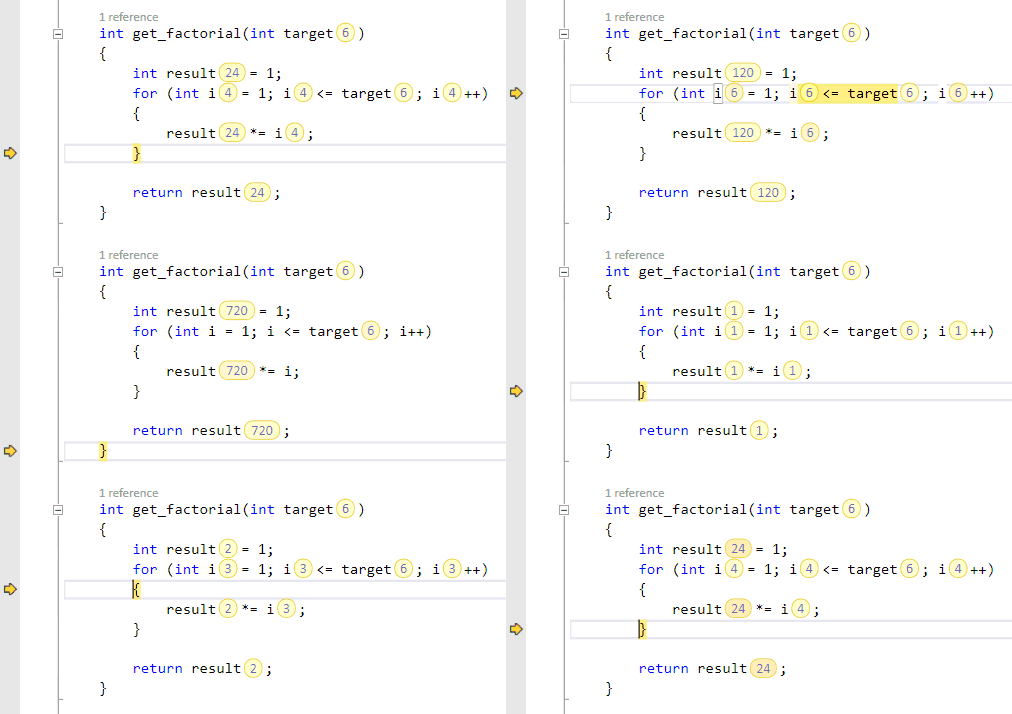
As you debug, Entrian Inline Watch displays the values of variables inline in your source code, updated live as you step through your code:
You can see the live values right there in the source, rather than having to hover over them with the mouse, or find them in the Watch windows. As soon as you land in a function, or at a breakpoint, you can see the values of your function parameters and variables. It's not just for primitive values like numbers and strings - you control how your classes and structures are displayed, eg. a You can also configure how accessor functions are displayed, so that a call to an accessor function, like Entrian Inline Watch makes debugging almost pleasant. You and your team need it. :-) ConfigurationEntrian Inline Watch adds two commands to your Tools menu:
The "Toggle display" command, which is bound to the Shift+Alt+W hotkey by default, switches the display of values off and on. The "Configuration..." command shows the configuration dialog. CompatibilityEntrian Inline Watch works with Visual Studio 2010(✱), 2012(✱), 2013(✱), 2015, 2017, 2019, and 2022(✱); any edition except Express. (✱) This version here in the Visual Studio Marketplace only supports 2015 to 2019 - for other versions, please see the download page. It works with both Managed debugging and Native debugging; in C++, C#, and VB. 30-day free trialWhen you install the trial version, it starts counting the individual days when you use it. (So if you don't use it for a while, your trial won't expire.) After 30 actual days of usage, the trial expires and you'll need to buy a license to continue using it. LicensingA license costs $29 per developer, or $24 with a volume discount. Links See the Entrian Solutions website for the FAQ, the Manual, and the Contact page. |


