|

Visit Company Website
DevExpress engineers feature-complete Presentation Controls, IDE Productivity Tools, Business Application Frameworks, and Reporting Systems for Visual Studio.
|
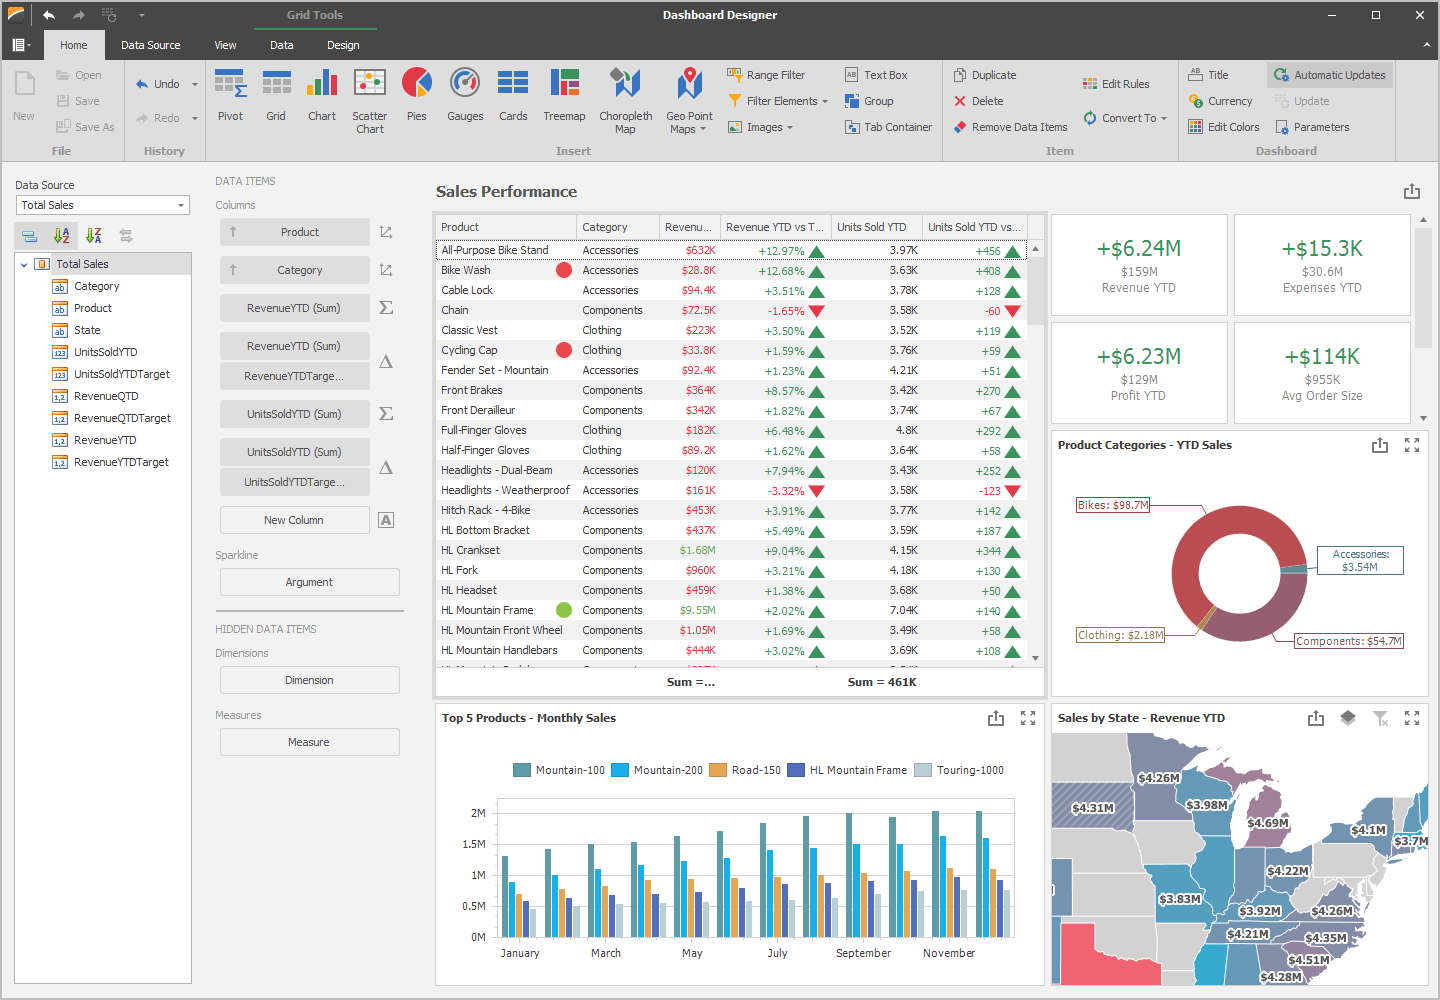
DevExpress Dashboard for .NET
Create and distribute royalty-free decision support systems and effortlessly share business intelligence across your entire enterprise.
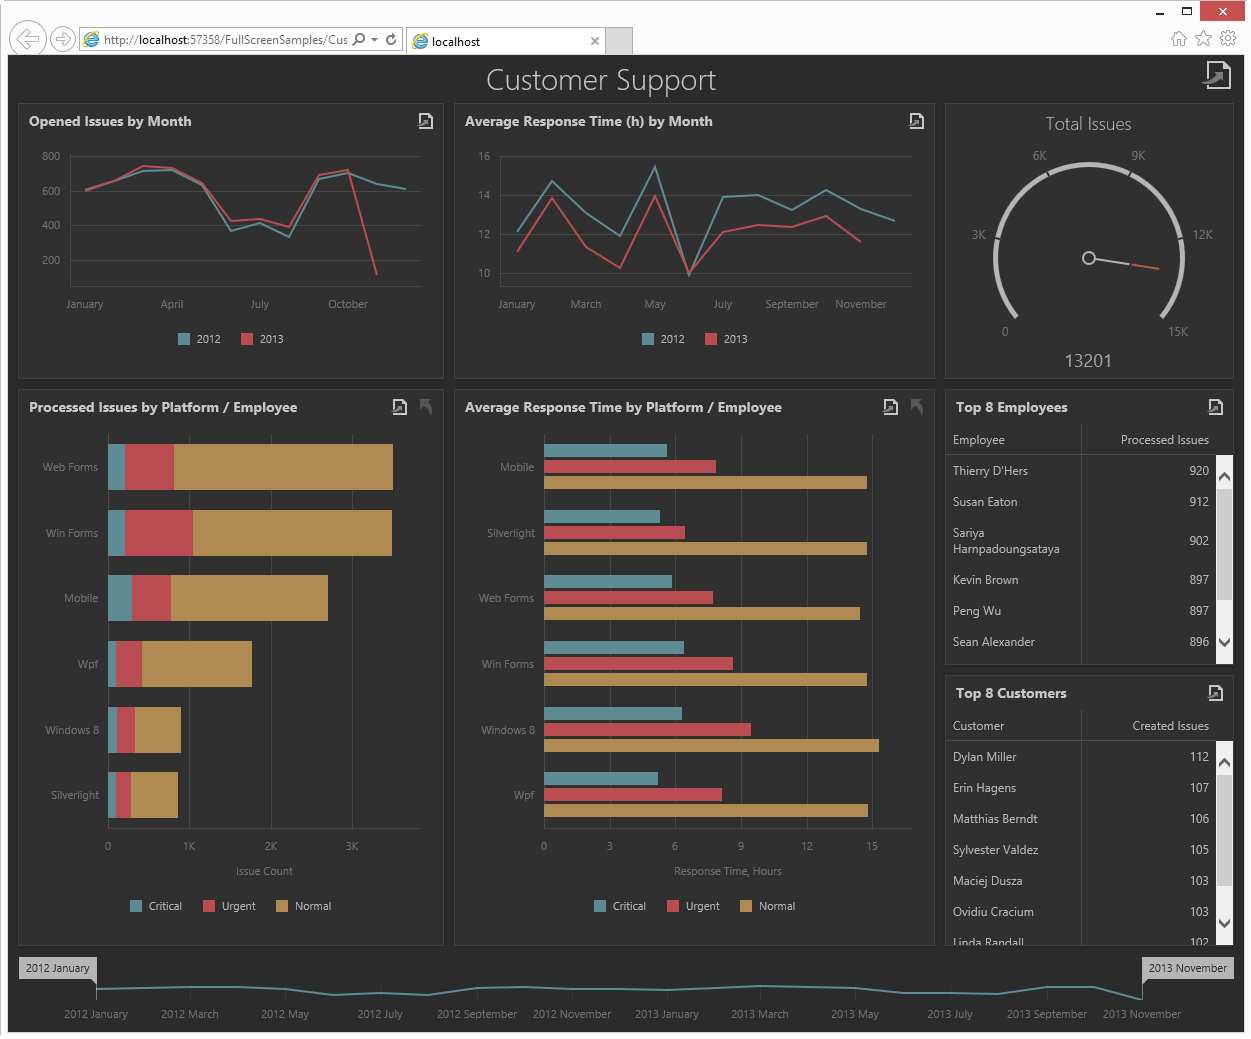
Multiple UI Platforms
- Desktop (WinForms and WPF)
- Web and Mobile - Based on the recently-redesigned DevExpress Web Dashboard core, our ASP.NET WebForms, MVC, ASP.NET Core and client-side HTML5 controls offer you an all-in-one solution that lets you switch between Viewer and Designer modes right on the client, and an optional adaptive layout for tablet and mobile users.
Rich Data Visualization
- Data Grid
- Pivot Grid
- Card View
- Cartesian Chart
- Gauges
- TreeMap
- Map
- Range Control
- Filter Control
- Rich Text Editor
- Image
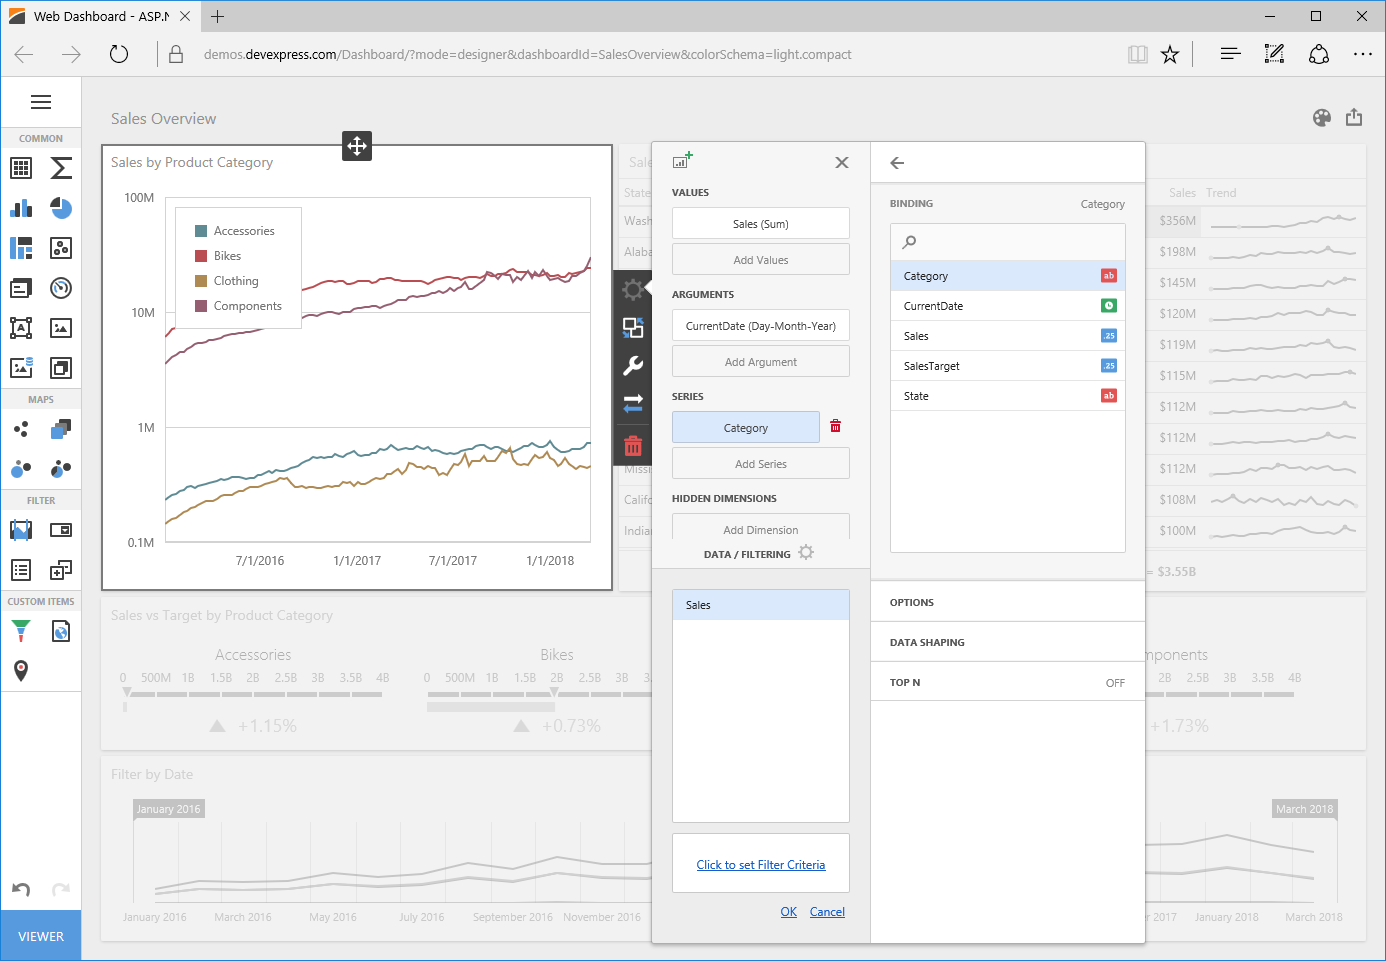
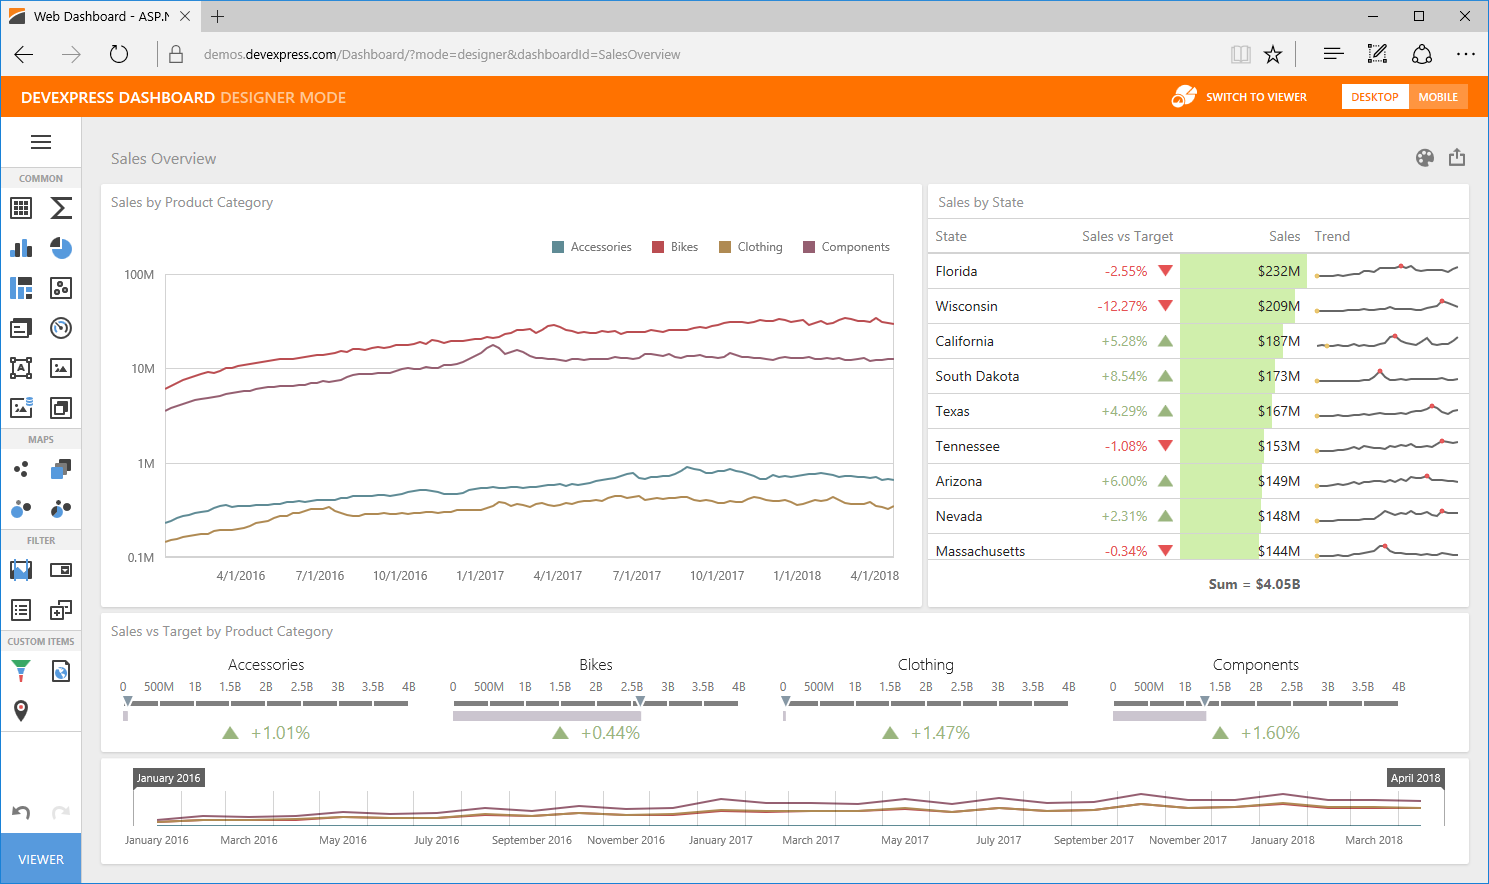
Integrated Dashboard Designer
The DevExpress Dashboard designer allows you to create fully interactive business intelligence dashboards for Windows, the Web and Mobile devices without writing a single line of code.
Drill-Down and Filtering
Each dashboard UI element can instantly provide additional insights into data. Dashboard elements can filter by series, arguments, and even cross filter data from other sources. These filters, which are activated using a single click, enable the visualization itself to control the set of data visualized across the entire dashboard.
Interested in the interaction of an argument within a dashboard element across the entire set? This functionality is available in mere seconds. Need to know more about a particular dashboard item’s series across all visualizations? You are literally a click away. In addition to inter-item filtering, a single dashboard element can also provide a window to data locked within its own confines by using the item's drill-down features.
Self-Service End User Customization
DevExpress Dashboard has been engineered with the executive and power user in mind. Straightforward and intuitive runtime customization means your organization can reduce development time and associated costs by allowing end-users to personalize dashboards as their requirements dictate.
From built in data wizards for simplified data access, to integrated filtering and data transformation tools and a rich set of UI customization options, DevExpress Dashboard is both powerful and easy-to-use, for the developer and end-user alike.
Data Visualization at its Best
DevExpress Dashboard ships with the following UI elements and visual indicators so you can build your best and deliver the fully customizable decision support systems for your enterprise.
- Pivot Table
- Charts
- Cards
- Grid
- Gauges
- Range Filter
Related Links
Download Free Trial
Pricing
Learn More
|
