New Relic CodeStreamShift left by making code performance part of the earliest stages of the development process.
Requirements
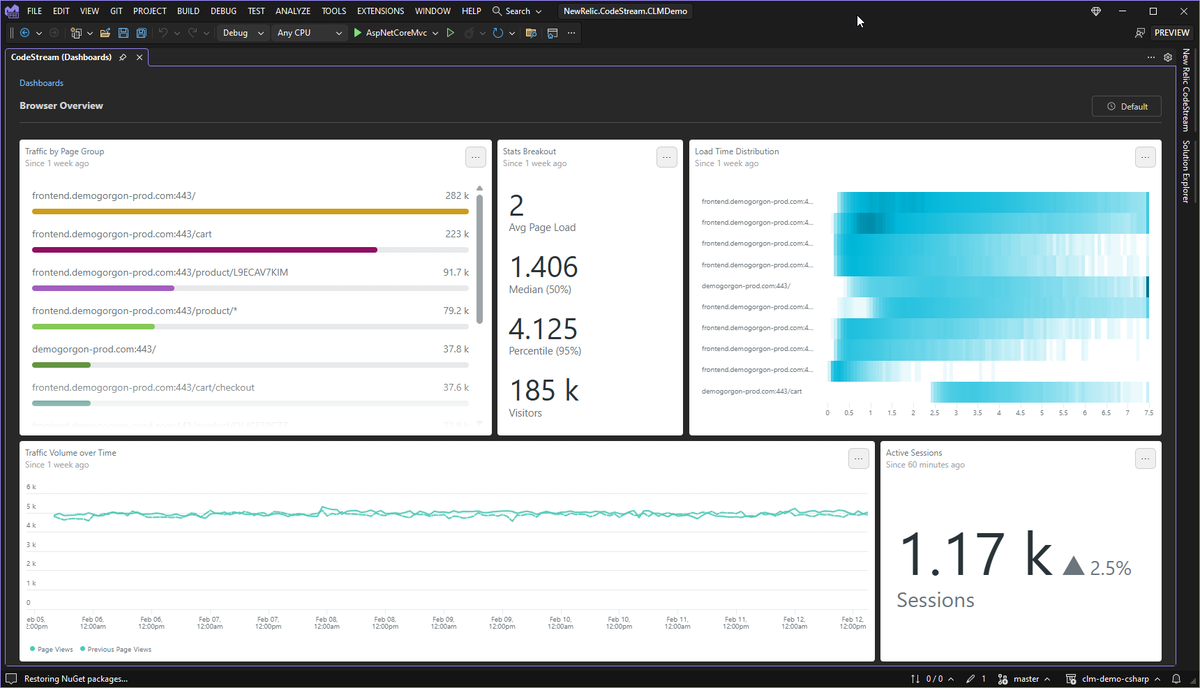
DashboardsDashboards are at the very core of your New Relic experience, and any dashboard can be viewed right from your IDE.
Log SearchNo need to slow down your investigation by context switching between your IDE and your browser to search logs. You can even search for output from specific log lines in your code.
Error InvestigationDiscover errors happening in the code you’re responsible for. Quickly step through the stack trace, with CodeStream automatically taking you to the correct file and line number, then bring relevant teammates into the discussion so that you can resolve the issue as quickly as possible.
Anomaly DetectionCodeStream allows you to catch problems before they escalate by identifying transactions with performance issues. An error rate heading in the wrong direction since your last release? View the performance over time, and jump straight into to relevant errors to get to the root of the problem.
Performance MonitoringGet an in-IDE view of how the services built from your code are performing, in any environment. Golden metrics, service-level objectives and related services give you the big picture at a glance.
Help & FeedbackCheck out the user guide for more information on getting started with New Relic CodeStream. Please follow @newrelic for product updates and to share feedback and questions. You can also contact support. |