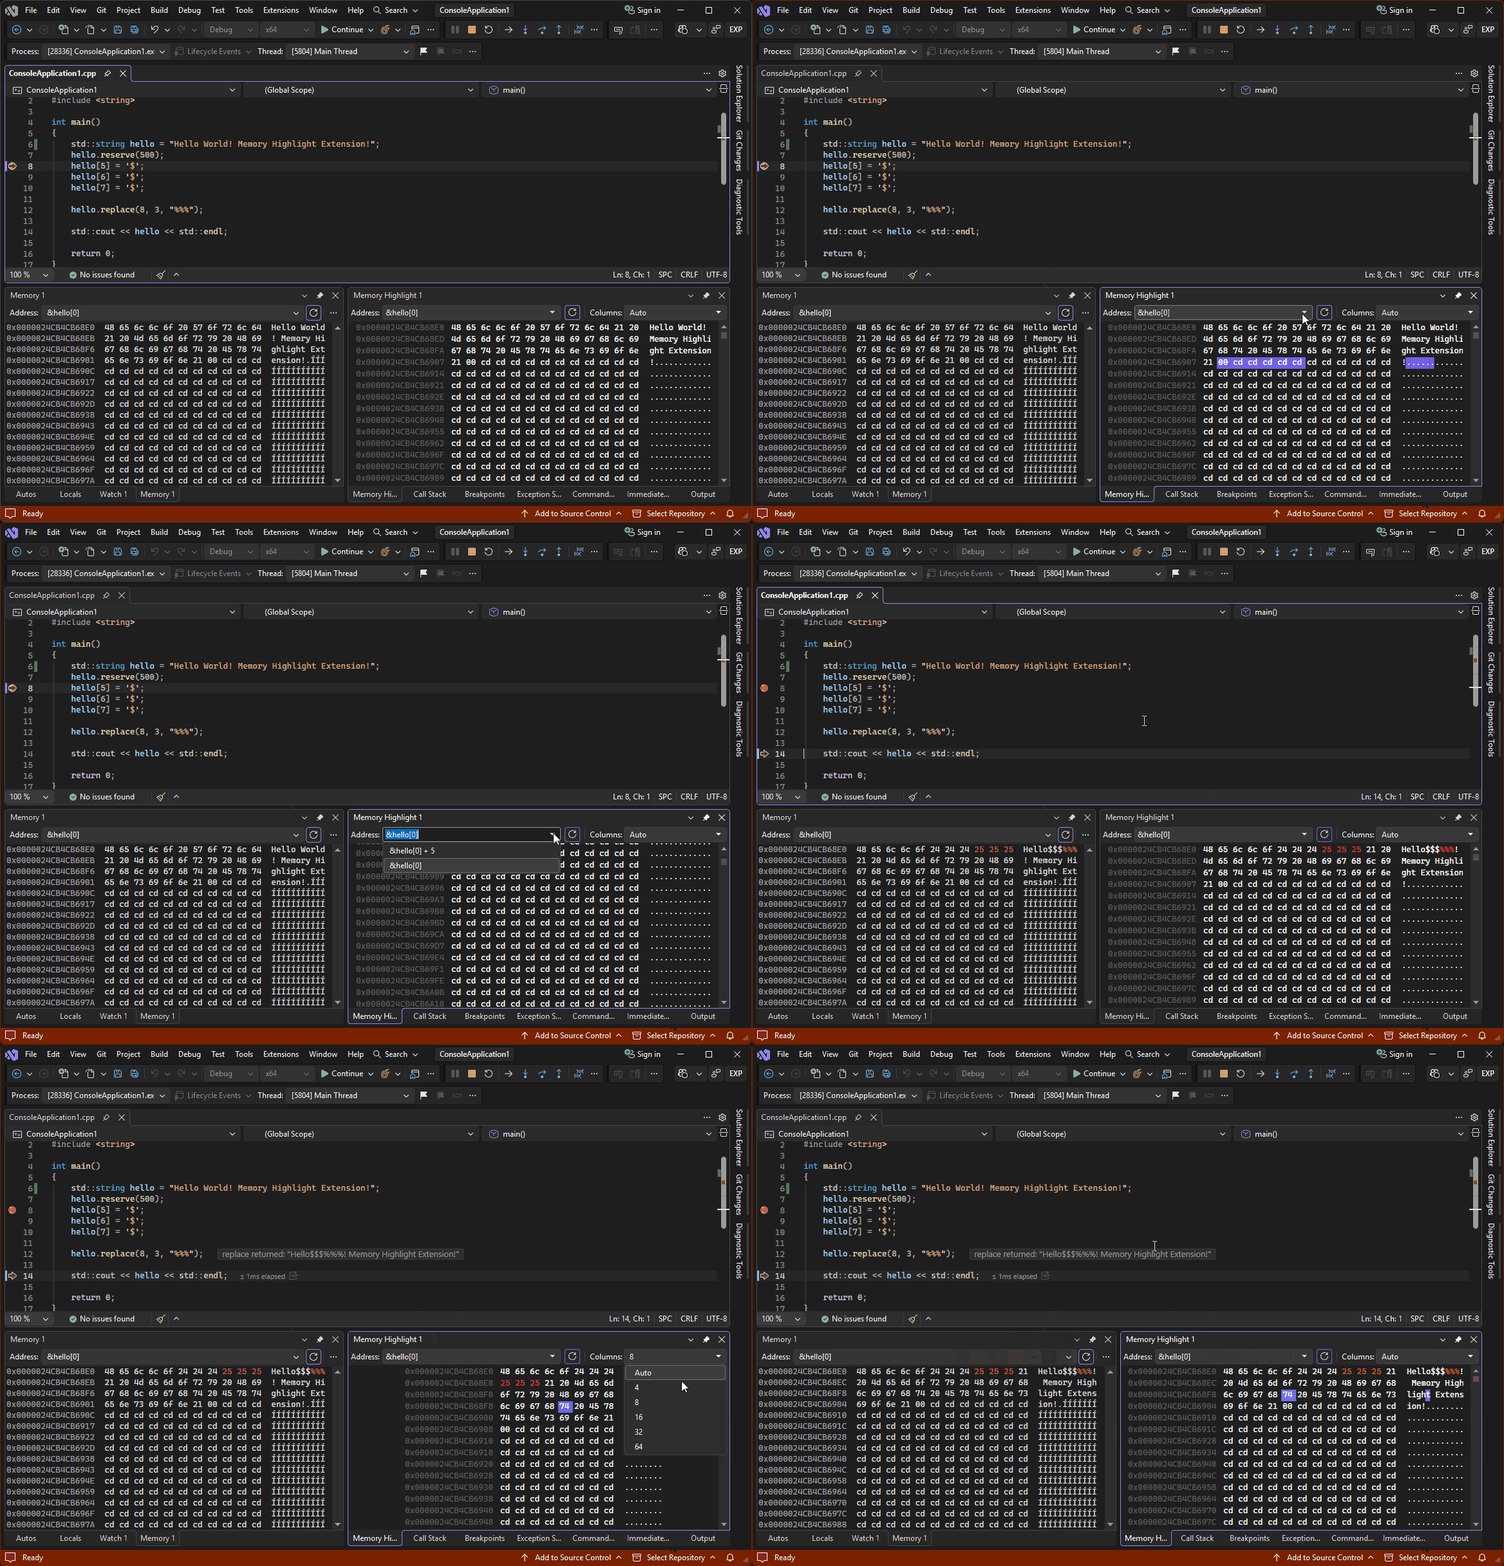
Memory HighlightA Memory-like window with matching hex and ASCII byte highlighting. |

Memory HighlightMemory Highlight is a Visual Studio extension for C++ debugging that provides a Memory-like window with linked hex and ASCII highlighting.
What it does
How to open itAfter installation, restart Visual Studio if requested, then open: Additional windows are available from the same menu: How to use it
The refresh button next to the address box reevaluates the expression automatically after debugger steps. Memory cannot be refreshed while the debuggee is running. NotesMemory Highlight was implemented for native C++ debugging. Other languages have not been tested. The extension does not collect telemetry and does not make external network calls. The project is MIT licensed. Support and ongoing maintenance are not promised. |